Profile (PREVIEW)
This feature is currently in beta phase and is subject to change. Functionality, design, and implementation may be updated in future releases based on user feedback and ongoing development.
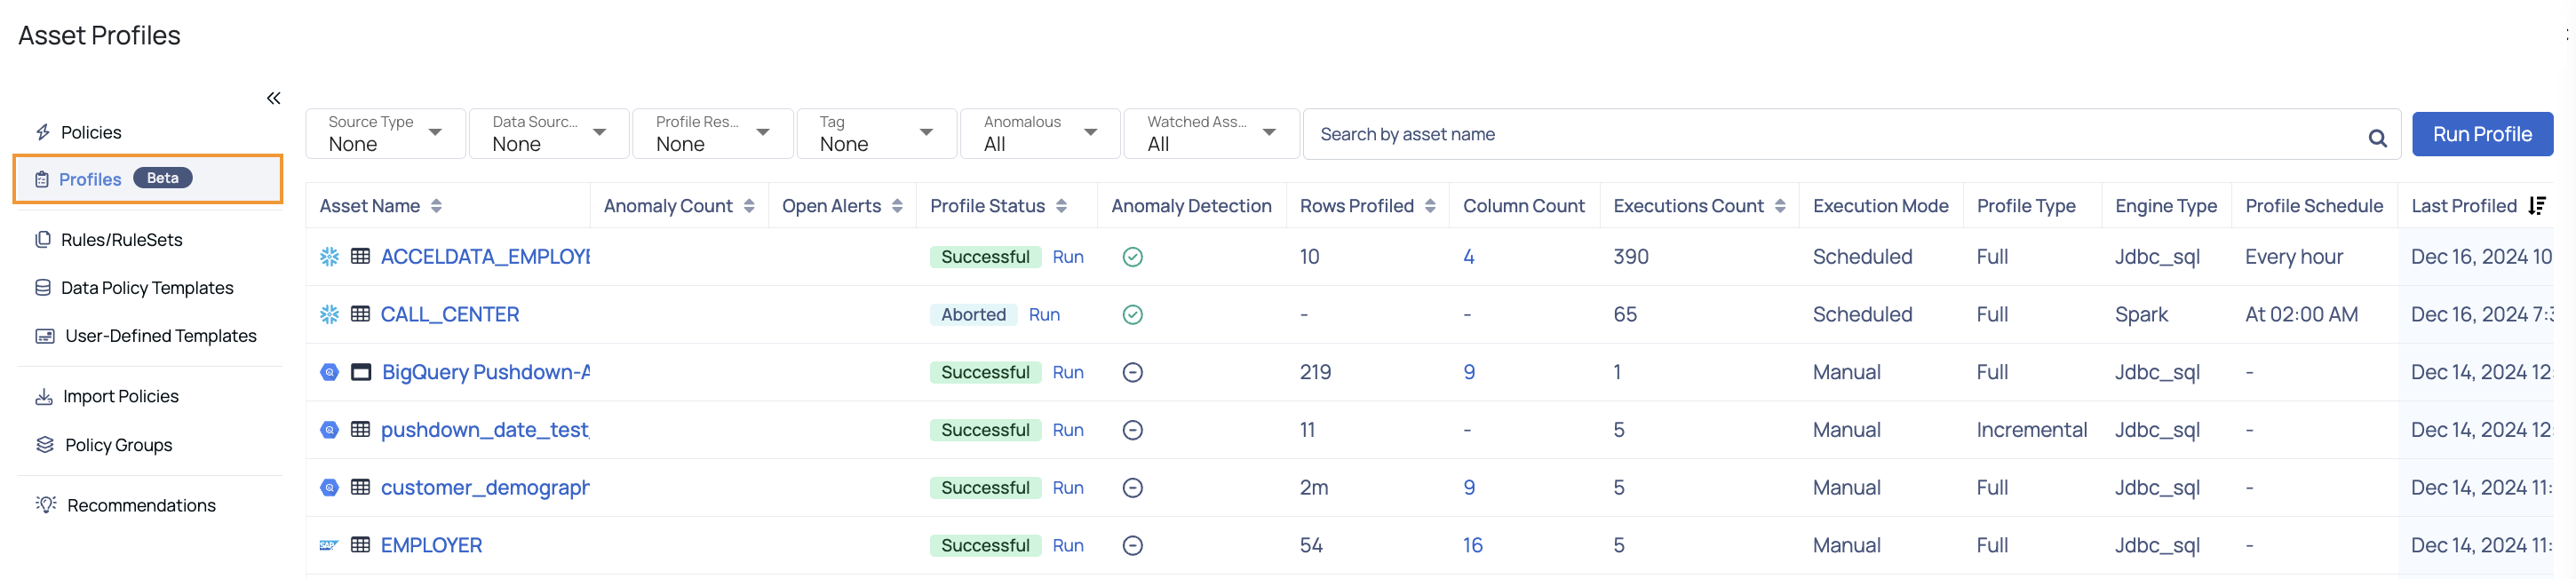
The Asset Profiles Page provides users with an overview of all assets that have been profiled, along with high-level details of the profiling executions. This page enables users to monitor profiling activities, filter specific assets, and initiate new profiling tasks.
What is Profiling?
Profiling is the process of analyzing datasets to collect metadata and statistics about their structure, content, and quality. Profiling helps to:
- Understand data distributions and patterns.
- Detect anomalies, missing values, and inconsistencies.
- Monitor the overall health and quality of datasets.
To navigate to the Asset Profiles page, perform the following:
- Navigate to Data Reliability from the left main menu.
- Click Manage Policies.
- Select the Profiles tab to open the Asset Profiles page.
Understanding the Profiles Table
The table on the Asset Profiles Page displays the profiling status and details for all assets. Below are the descriptions of each column:
| Column Name | Description |
|---|---|
| Asset Name | The name of the asset (e.g., table) that has been profiled. |
| Anomaly Count | The number of anomalies detected during the profiling process. |
| Open Alerts | Indicates the number of unresolved alerts associated with the asset. |
| Profile Status | Displays the status of the most recent profile (e.g., In Progress, Successful, Failed). |
| Anomaly Detection | Indicates whether anomaly detection is enabled for the asset. Hover of the |
| Rows Profiled | The number of rows that were analyzed during profiling. |
| Column Count | The total number of columns in the profiled asset. Clicking on the count displays the data type count (Integral, String) |
| Executions Count | The number of times profiling has been executed for the asset. |
| Execution Mode | Specifies whether profiling was run Manually or Scheduled. |
| Profile Type | Indicates the type of profiling performed (e.g., Full, Incremental, Selective). |
| Engine Type | The engine used for profiling (e.g., Spark, JDBC_SQL). |
| Profile Schedule | Displays the schedule for automatic profiling (e.g., Every Hour, At 2:00 AM) or blank for manual runs. |
| Last Profiled | The timestamp of the most recent profiling execution. |
Filters and Actions
Filters
At the top of the page, users can apply filters to narrow down the list of profiled assets:
- Source Type: Filter by the type of data source (e.g., databases, files).
- Data Source: Filter assets by their data source.
- Profile Result: Filter assets by the result of their profiling (e.g., Successful, Failed).
- Tag: Filter assets by assigned tags.
- Anomalous: View only assets with detected anomalies or all assets.
- Watched Assets: Filter assets being actively monitored.
Search
- Use the Search by Asset Name field to find a specific asset by its name.
Actions
Run Profile
Click the Run Profile button to start profiling a new asset.
In the modal that appears:
Select an Asset: Choose the dataset to profile.
Select Profile Type: Choose the type of profiling:
- Full: Profiles the entire dataset.
- Incremental: Profiles only the new or changed data.
- Selective: Profiles specific columns or subsets of data.
Provide Configurations: Enter additional parameters, if required.
Click Execute to initiate the profiling process.
View Profiling Details
- Click on an asset name to view detailed profiling results and associated metadata in the asset details page.
Monitor Alerts
- Review open alerts to address anomalies or issues detected during profiling.