To enable Pulse to monitor and collect query-level and performance metrics from ClickHouse, ensure the following configurations are applied in Ambari.
Expose ClickHouse Prometheus Metrics
Expose ClickHouse Prometheus metrics so Pulse can collect real-time operational data.
- In the Ambari UI, go to Service > ClickHouse > Configs > Advanced clickhouse-server-config > ClickHouse Server Template.
- In the ClickHouse Server Template, add the following configuration:
xxxxxxxxxx<prometheus> <endpoint>/metrics</endpoint> <port>9363</port> <metrics>true</metrics> <events>true</events> <asynchronous_metrics>true</asynchronous_metrics></prometheus>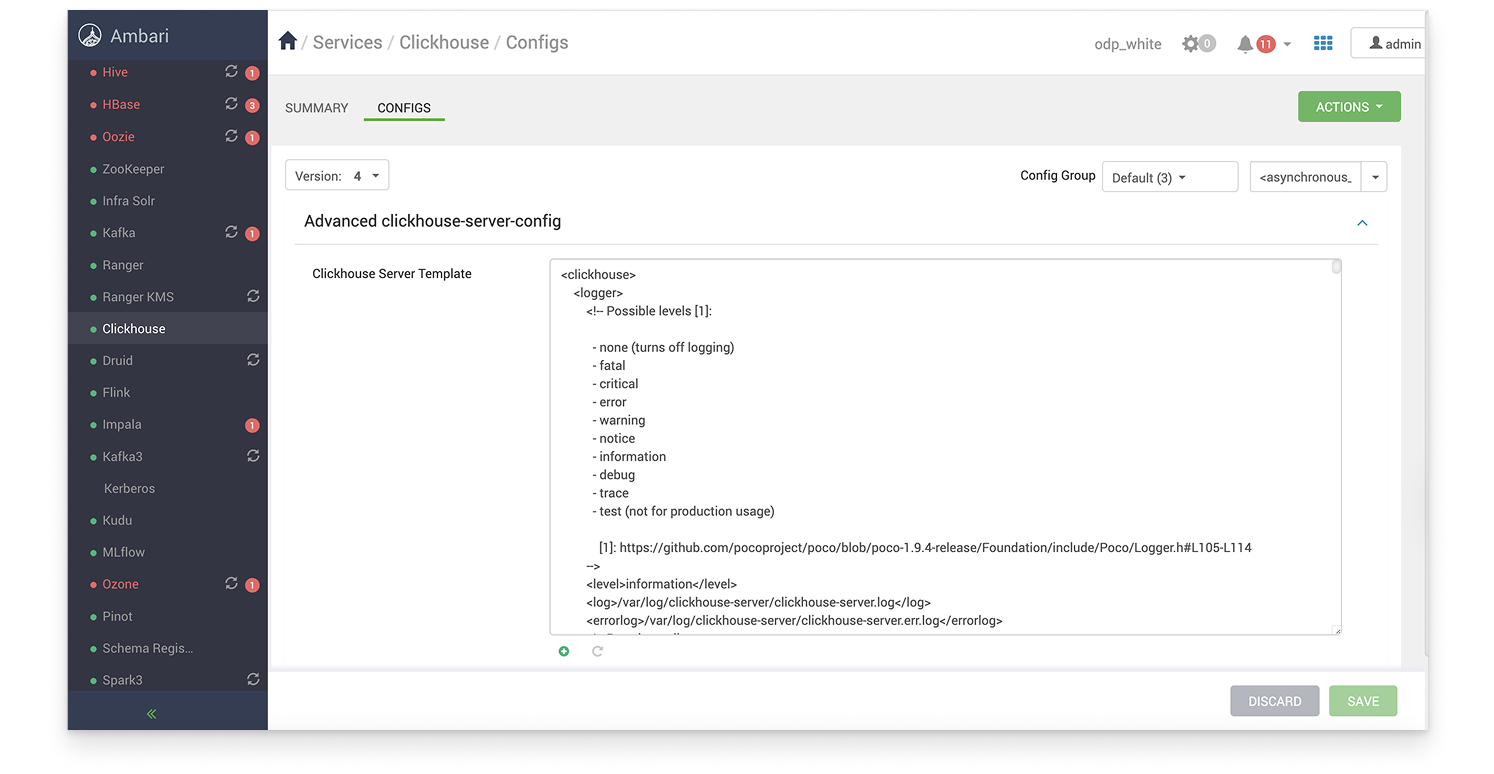
- Save the changes. and restart the ClickHouse service for the changes to take effect.
Purpose:
- Exposes metrics on port 9363. This is the default port, but you can configure it to use any other port as needed. Ensure that the same port number is configured in both Ambari and Pulse for successful communication.
- Enables collection of events and asynchronous metrics.
- Allows Pulse to scrape Prometheus data for ClickHouse performance insights.
Enable Query Logging and Tracing
Enable ClickHouse query logging and tracing so that Pulse can collect and analyze real-time data from all queries and trace events.
- In the Ambari UI, go to Services > ClickHouse > Configs > Advanced ClickHouse Users > Clickhouse Users Template.
- In Clickhouse Users Template, add the following details to the ClickHouse configuration file (if it doesn’t exist already).
xxxxxxxxxx<clickhouse> <profiles> <default> <!-- Query logs --> <log_queries>1</log_queries> <log_query_threads>1</log_query_threads> <!-- Optional: log settings applied per query --> <log_query_settings>1</log_query_settings> <!-- Internal tracing --> <!-- 0..1, probability to start a trace for a query --> <opentelemetry_start_trace_probability>1</opentelemetry_start_trace_probability> <!-- Include internal processors/stages --> <opentelemetry_trace_processors>1</opentelemetry_trace_processors> </default> </profiles></clickhouse>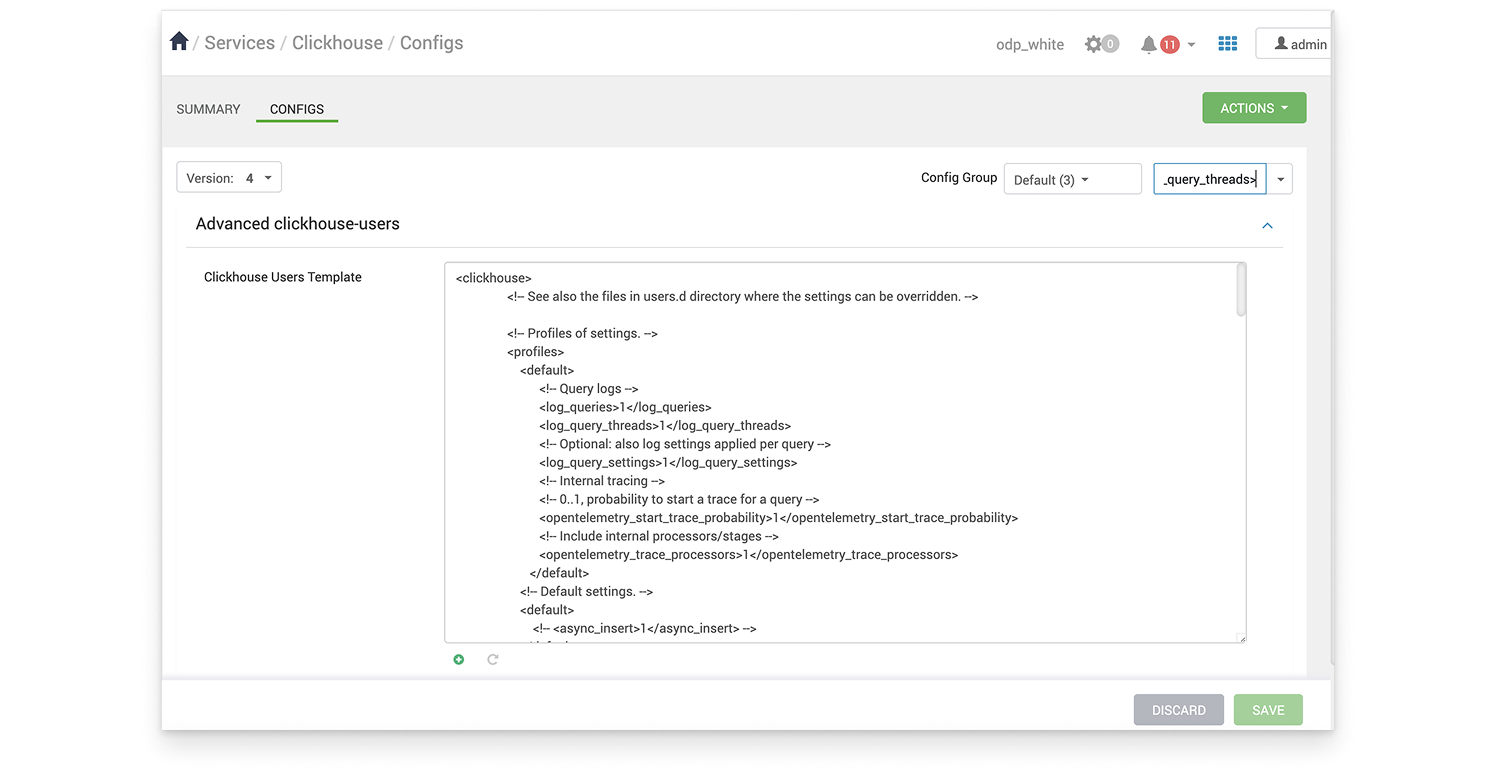
- Save the changes.
Purpose:
- Captures all query executions and thread-level logs.
- Enables OpenTelemetry tracing for all queries.
- Provides full visibility into query performance for Pulse.
After updating both configurations in Ambari, restart the ClickHouse service for the changes to take effect.
Query Listing Latency in Pulse
The Query visibility latency in Pulse depends on the flush interval configuration of query_log and opentelemetry_span_log.
- In the Amabari UI, go to ClickHouse.
- In the ClickHouse page, select Configs.
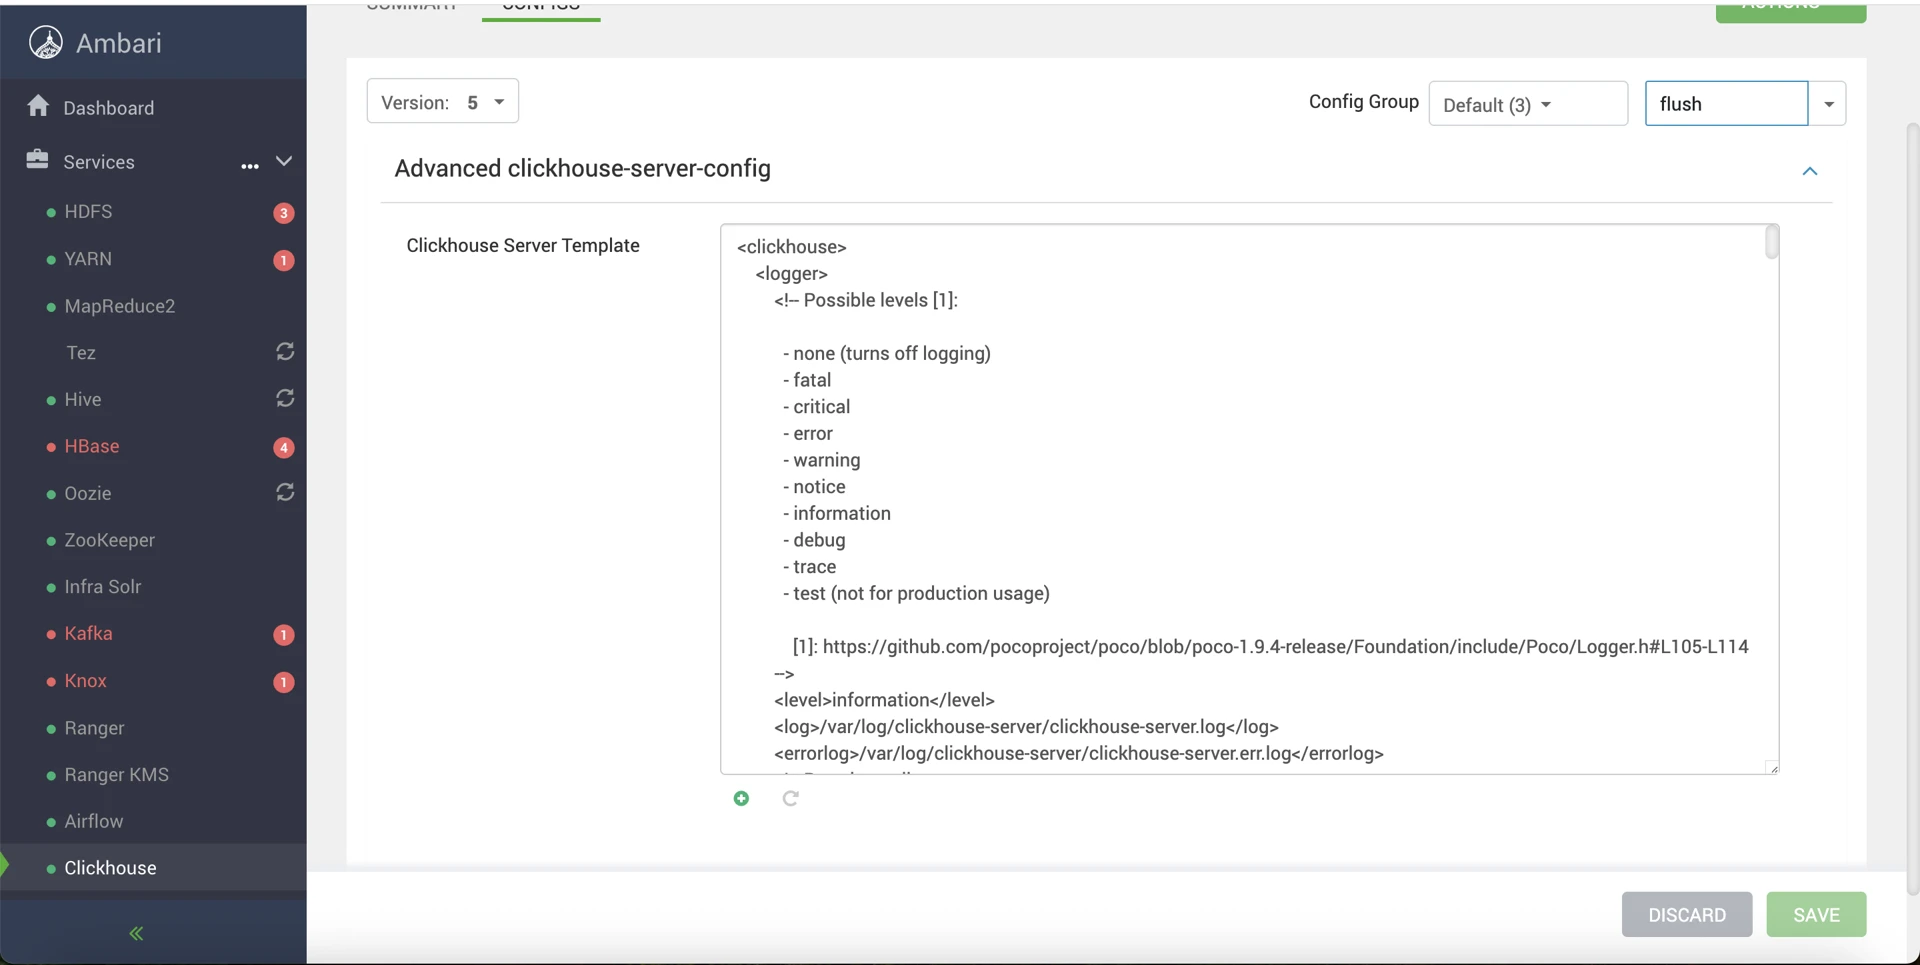
- In Advanced clickhouse-server-config, update the changes in ClickHouse Server Template.
For query_log:
- Lowering the flush interval to 1000 ms is safe and recommended when near-real-time query visibility in Pulse is required.
- The row volume is very low (1–2 rows per query), so the additional I/O and MergeTree overhead is negligible, even on busy clusters.
For opentelemetry_span_log:
- Keep the default flush interval (7500 ms) unless you have a specific need for low-latency span visibility and the cluster has low-to-moderate query concurrency.
- On high-concurrency clusters (100+ concurrent queries), lowering this value increases the risk of:
- MergeTree part accumulation
- Increased background merge pressure
If the flush interval is reduced for opentelemetry_span_log, monitor:
system.metricsPartsActiveBackgroundMergesAndMutationsPoolTask
system.asynchronous_metricsMaxPartCountForPartition
Conclusion
The flush interval setting trades latency for I/O efficiency:
- For
query_log: Lowering the interval is generally worthwhile due to low volume. - For
opentelemetry_span_log: The default is safer because span volume is significantly higher.
Additionally, the stream separation architecture ensures query events are not delayed by span flush timing, regardless of the span log flush interval.
The flush interval configuration can be found in the XML configuration file under the corresponding tab shown in the referenced screenshot.
Create Materialized Views for NATS Integration
Create materialized views in ClickHouse to publish query logs and span events to NATS.
This setup enables real-time streaming of ClickHouse activity to Pulse for monitoring and analysis.
Before You Begin
Obtain the Pulse IP address:
- In case of Docker: Use the IP address of the Pulse core node.
- In case of Kubernetes: Use the IP address of the Pulse database node.
Verify network connectivity: Ensure that the ClickHouse node can connect to the Pulse node on port 19009.
Confirm ClickHouse configuration: Verify that the following settings are enabled in the ClickHouse configuration file:
- log_queries=1
- opentelemetry_start_trace_probability=1
These settings ensure that query logs and OpenTelemetry span logs are captured and forwarded to Pulse.
Run the Command
Run the following commands in the ClickHouse client (clickhouse-client) on a ClickHouse server node.
For 4.0.x:
xxxxxxxxxxCREATE DATABASE IF NOT EXISTS pulse_stream; -- Query Events → NATS --CREATE TABLE IF NOT EXISTS pulse_stream.query_log_to_natsAS system.query_logENGINE = NATSSETTINGS nats_url = '<pulse_node>:19009', nats_subjects = 'clickhouse.query_log', nats_format = 'JSONEachRow', nats_max_rows_per_message = 1; CREATE MATERIALIZED VIEW IF NOT EXISTS pulse_stream.mv_query_log_to_natsTO pulse_stream.query_log_to_nats ASSELECT *FROM system.query_log; -- Traces (Spans) → NATS --CREATE TABLE IF NOT EXISTS pulse_stream.spans_to_natsAS system.opentelemetry_span_logENGINE = NATSSETTINGS nats_url = '<pulse_node>:19009', nats_subjects = 'clickhouse.spans', nats_format = 'JSONEachRow', nats_max_rows_per_message = 1; CREATE MATERIALIZED VIEW IF NOT EXISTS pulse_stream.mv_spans_to_natsTO pulse_stream.spans_to_nats ASSELECT *FROM system.opentelemetry_span_log;For 4.1.x:
xxxxxxxxxxCREATE DATABASE IF NOT EXISTS pulse_stream; -- Query events → NATS --CREATE TABLE IF NOT EXISTS pulse_stream.query_log_to_natsAS system.query_logENGINE = NATSSETTINGS nats_url = '<pulse_node>:19009', nats_subjects = 'clickhouse_events_<cluster_name>.0', nats_format = 'JSONEachRow', nats_max_rows_per_message = 1; CREATE MATERIALIZED VIEW IF NOT EXISTS pulse_stream.mv_query_log_to_natsTO pulse_stream.query_log_to_nats ASSELECT *FROM system.query_log; -- Traces (spans) → NATS --CREATE TABLE IF NOT EXISTS pulse_stream.spans_to_natsAS system.opentelemetry_span_logENGINE = NATSSETTINGS nats_url = '<pulse_node>:19009', nats_subjects = 'clickhouse_events_<cluster_name>.0', nats_format = 'JSONEachRow', nats_max_rows_per_message = 1; CREATE MATERIALIZED VIEW IF NOT EXISTS pulse_stream.mv_spans_to_natsTO pulse_stream.spans_to_nats ASSELECT *FROM system.opentelemetry_span_log;Replace <pulse_node> with the IP obtained.