Profile Tab
Asset profiling serves as an essential precursor to any data quality enhancement initiative, as it enables organizations to better understand the current state of their data, recognize vulnerabilities, and take informed actions to rectify issues and optimize their data assets for more accurate and reliable analytics and decision-making.
ADOC provides the capability to perform data profiling not only for structured data but also for semi-structured data, enabling you to gain valuable insights from both types of data assets.

The Profile tab displays the following information about the assets profiled within the selected table, for a selected date and time.
| Property Name | Definition | Example |
|---|---|---|
| Executed Profile | Defines the most recent date and time at which the profiling of asset occurred. Click the drop-down and select a date and time to view previous profile executions details. | Aug 24, 2023 8:26pm |
| Rows Profiled | Number of rows profiled. | 2976508 |
| Profiling Type | Full or Sample type of asset profiling? | FULL |
| Start Time | Defines the date and time at which the profiling of the asset started. | Aug 24, 2023 8:26pm |
| End Time | Defines the date and time at which the profiling has ended. | Aug 24, 2023 8:27pm |
| Start Value | Defines the value with which the profiling began. | 169271...114824 |
| End Value | Defines the value with which the profiling completed. | 169288...763048 |
- Compare Profiles: Click on the shuffle icon to compare the current profiled data of an asset with previously profiled data.

Profiling an Asset
To start profiling, click the Action button and then select either Full Profile, Incremental, or Selective from under Profile.

Once the profiling is completed, a table is generated with names of each of the columns present in the table. Various metrics are calculated for each column. Each column contains one data type and the metrics generated for a structured column data types are as follows:
| Data Types | Statistical Measures |
|---|---|
| String |
|
| Integral |
|
| Fractional |
|
| Time Stamp |
|
| Boolean |
|
Similarly, the metrics generated for semi-structured column data types are as follows:
| Data Type | Statistical Measures |
|---|---|
| Struct |
|
| Array[String] |
|
| Array[Integral/Fractional] |
|
| Array[Boolean] |
|
| Array[Struct] |
|
Viewing Column Data Insights
To gain deeper insights into any column type, whether structured or not, simply click on the column name. This action will open a modal window presenting the following details:
When the profiling is completed, charts are generated for each of the table's columns. For each column, various metrics are computed. Each column contains a single data type, and the metrics produced for each data type are as follows:
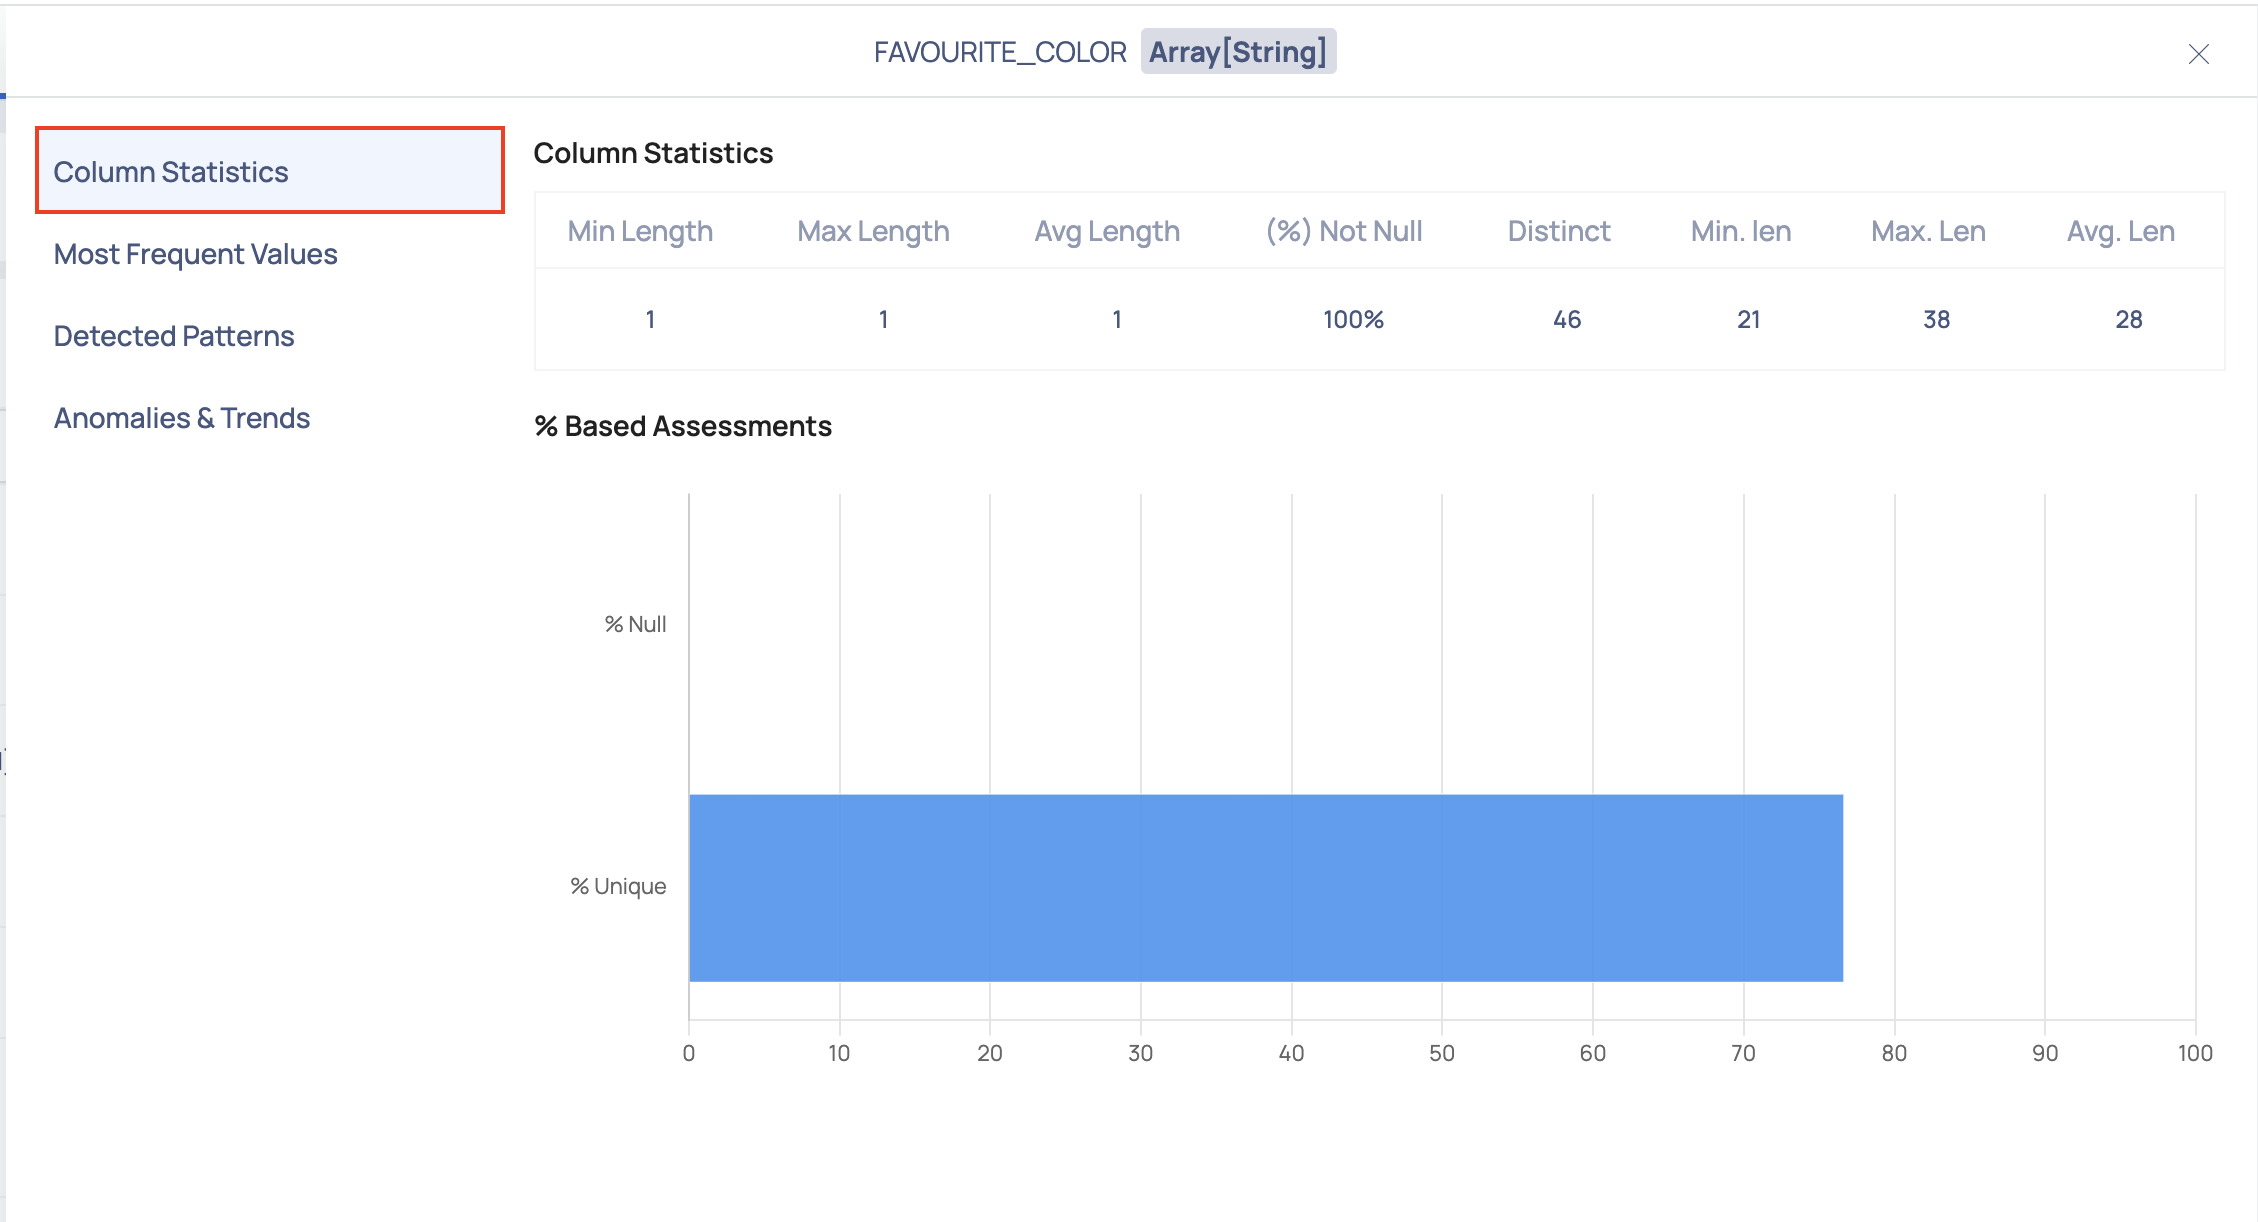
Column Statistics
This section provides a table showcasing statistics for the selected column, accompanied by a bar graph illustrating percentage-based evaluations like % Null values and % Unique values.

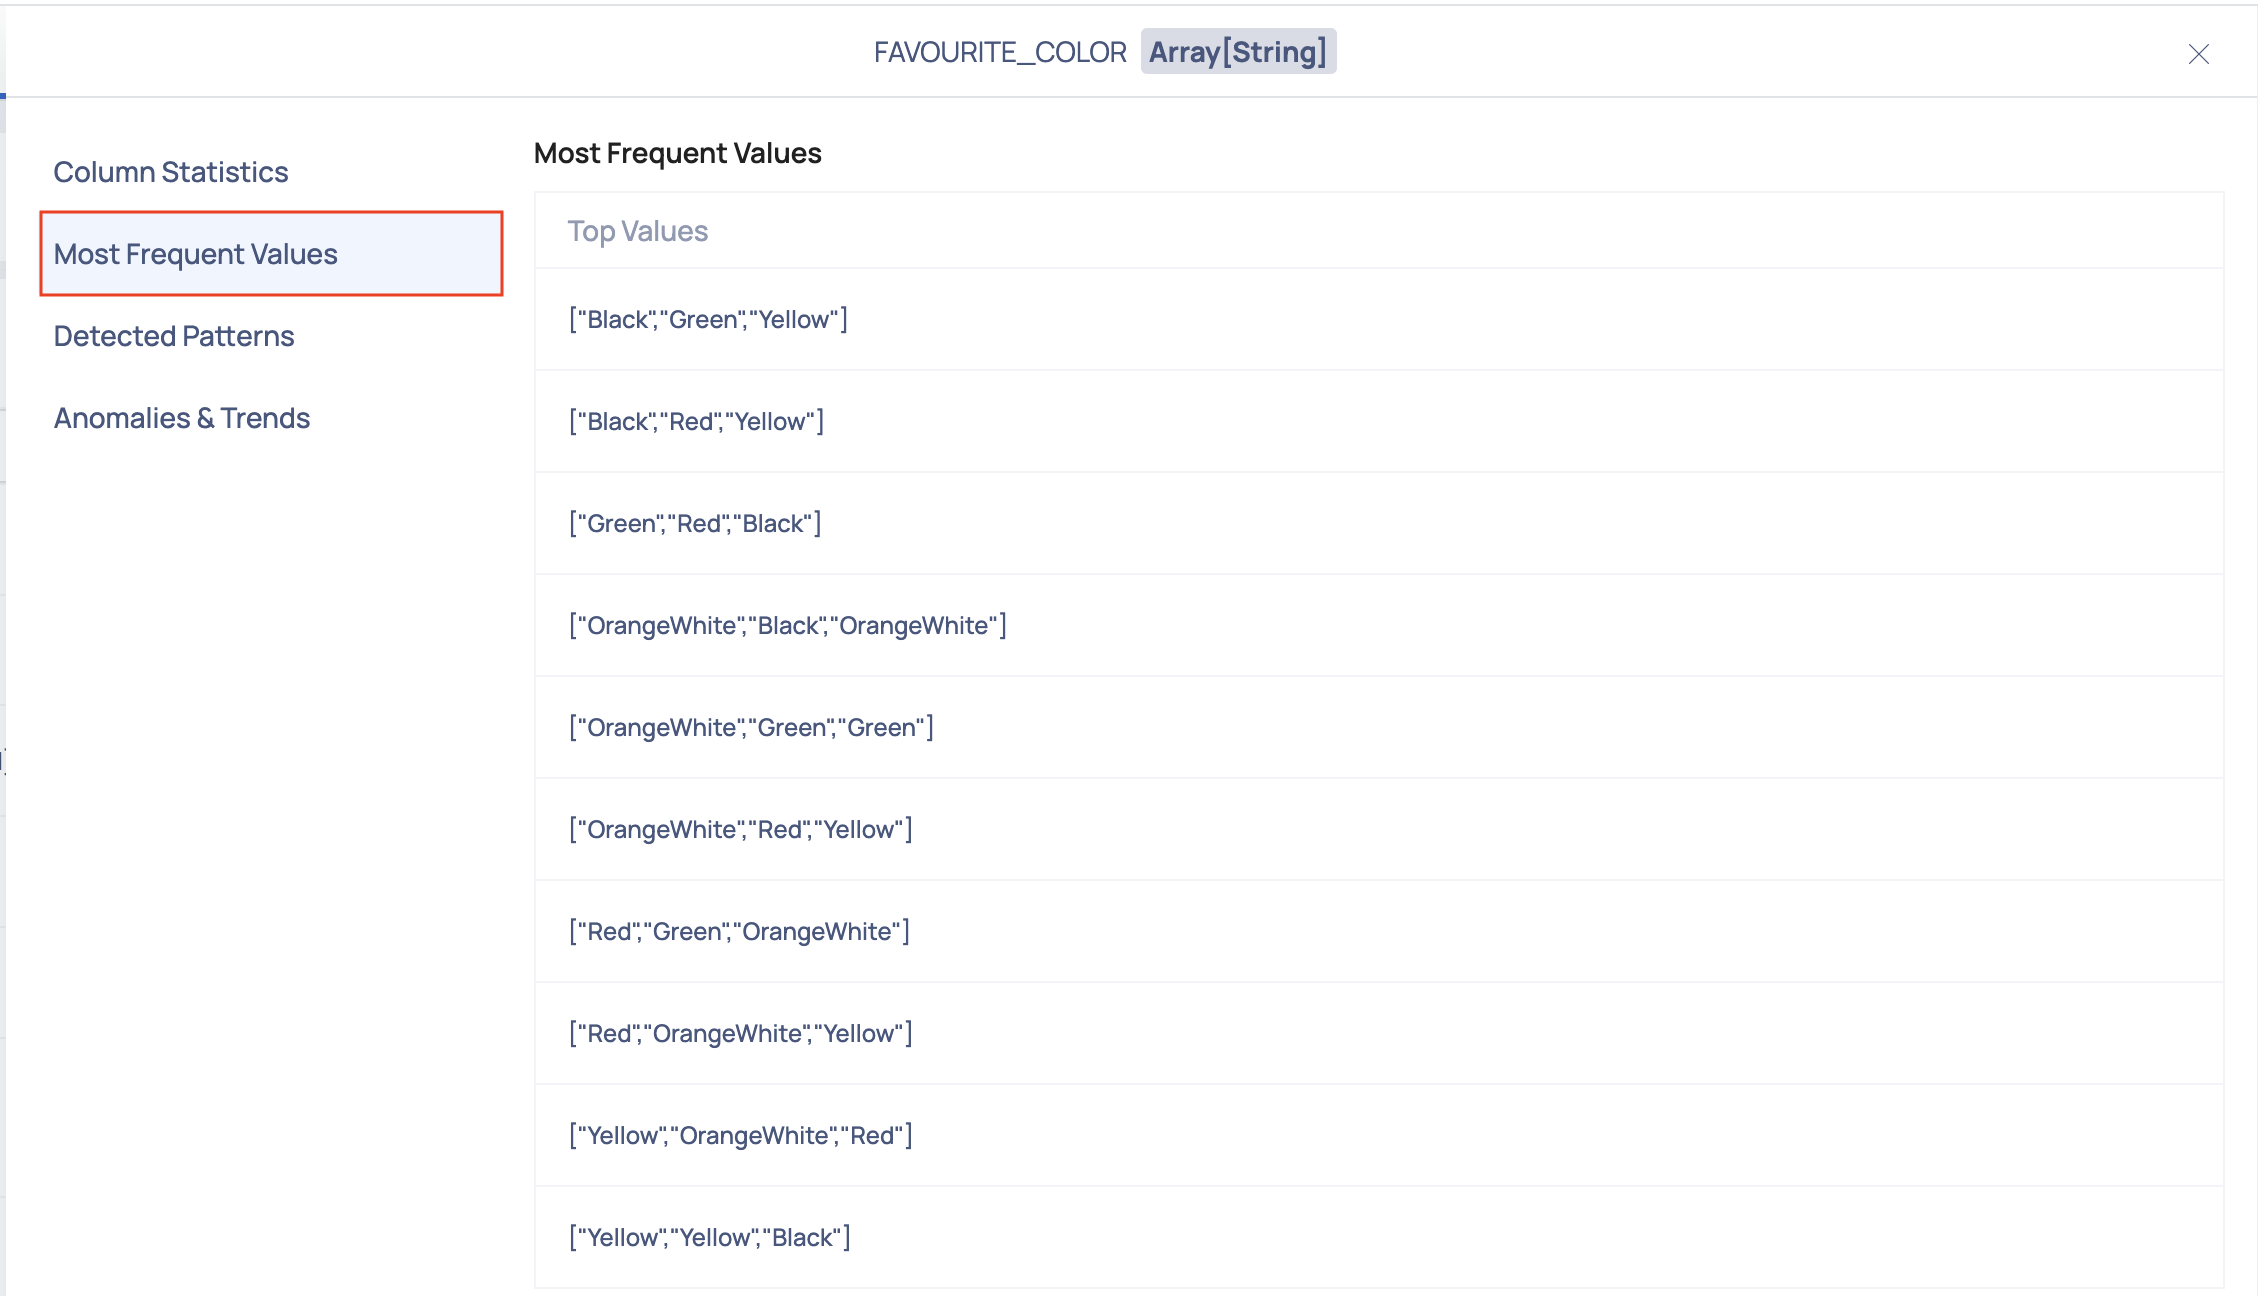
Most Frequent Values
This section provides a list of the most frequent values found for the selected column.

Detected Patterns
This section provides a list of common patterns found for the selected column.
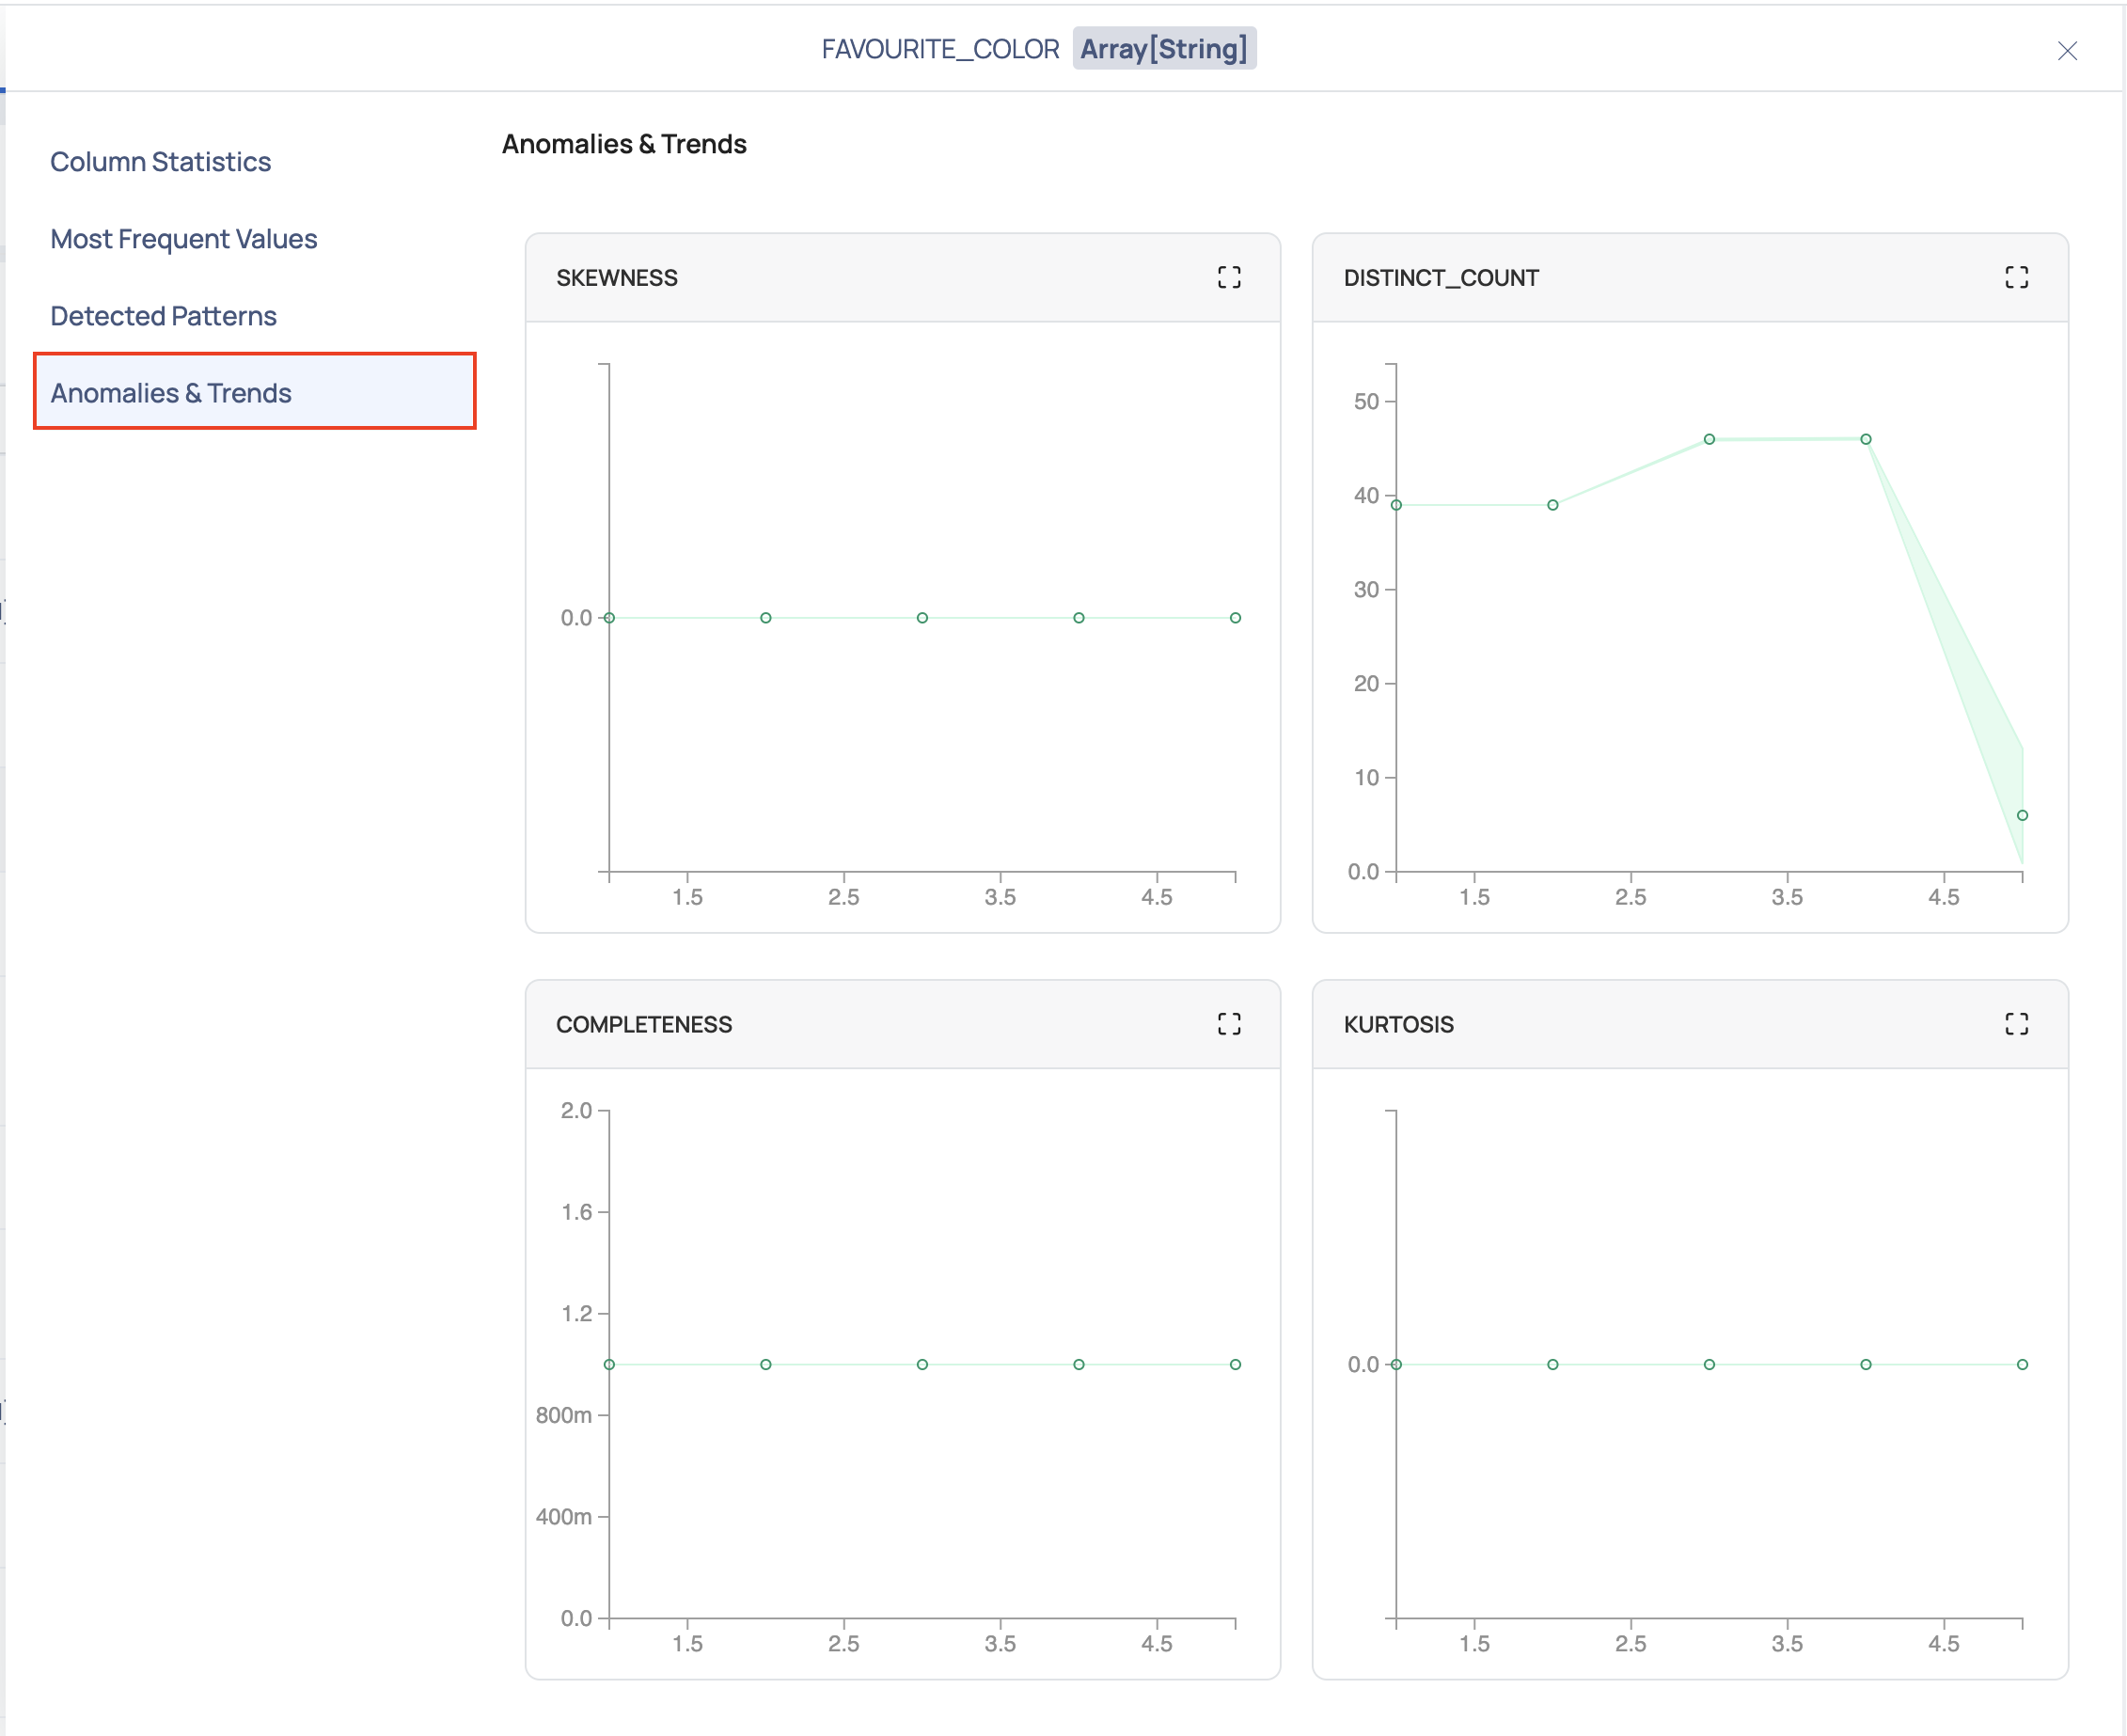
Anomalies & Trends
Within this section, you'll find a variety of charts that offer valuable insights into your data. These visualizations present key metrics such as skewness, distinct count, completeness, and kurtosis. Using the historical data, upper bound for the current value and lower bound for the current value is calculated and plotted over the graph as shown in the following image:
These charts help you understand the distribution and patterns within your data, enabling you to identify potential anomalies and trends that may influence your analysis and decision-making processes.

Every time a table is profiled, a data point is recorded. Overtime, n number of data points is recorded for each metric of every column of the table. The following observations can be made from the graph:
- If the data point lies between the upper bound curve and the lower bound curve, then the data point is non-anomalous.
- If the data point lies beyond the upper bound curve and the lower bound curve, then the data point is anomalous.
The following fields must be configured for anomaly detection:
- Historical Metrics Interval for Anomaly Detection
- Minimum Required Historical Metrics For Anomaly Detection
- For a column of complex data type including array, map, and struct, sub-columns of other datatype other than string, numeric and boolean data type will be treated as string.
- For column with array type, pattern profile and top values will have values only and the count will not be displayed
- For column with array type, total non null count will not be displayed.
- Anomaly detection is not supported for nested column of an asset in the current version of ADOC.
- By default ADOC can profile up to five levels of a complex data structure. This can be updated with an environment variable PROFILE_DATATYPE_COMPLEX_SUPPORTED_LEVEL in the analysis service deployment in the data plane.
REST APIs
The Profiling APIs enable you to programmatically start profiling an asset, get an asset’s profiling status, schedule profiling for an asset, get an asset’s profiling schedule, terminate a profiling job, and autotag assets.
Start Profiling an Asset
The POST Start Profiling method initiates the asset profiling process.
Resource URL:
POST /catalog-server/api/assets/{id}/profile
Get Profiling Status of an Asset
The GET Profile Status method returns the stage of profiling that is currently in progress. For example, if the profiling runs successfully and is complete, the status of the profiling process will be returned as SUCCESS.
Resource URL:
GET /catalog-server/api/assets/{id}/profile
Schedule Profiling for an Asset
The POST Schedule Profiling method allows the profiling of an asset to be scheduled using a Cron-based schedule. A cron-based schedule is when profiling is scheduled to occur on a periodic basis and at specific intervals.
Resource URL:
POST /catalog-server/api/assets/{id}/profile/schedule
Get an Asset’s Profiling Schedule
This GET method returns the profiling schedule for a specific asset based on its id.
Resource URL:
GET /catalog-server/api/assets/{id}/profile/schedule
Terminate Profiling of an Asset
The PUT Cancel Profile method terminates an ongoing profiling job.
Resource URL:
PUT /catalog-server/api/assets/profile/{id}/cancel
Initiate Auto Tagging of an Asset
Auto Tagging allows you to automate the process of applying tags to your asset. Tags are a type of metadata that help describe an asset and allows it to be found through browsing or searching. This method initiates the auto tagging of assets.
Resource URL:
POST /catalog-server/api/assets/{id}/autotag