
Airflow DagRuns
This page provides drill-down visibility into DAG execution history.
Pulse enables full-stack observability for Airflow on Kubernetes by combining:
DAG-level monitoring
Task-level drilldowns
Scheduler and executor health tracking
Resource utilization visibility
Performance trend analysis
Operator-level metrics
This allows faster root cause analysis, improved SLA tracking, and proactive workload optimization.
Navigation Steps
In the xDP UI, select Airflow from the left navigation pane.
Select Airflow > DAG Runs.
Select the desired cluster from the cluster selector in the upper-right corner.
The DAG Runs page opens and displays the DAG runs for the selected Airflow cluster.
Time Period
Use the Time Period selector in the upper-left corner of the dashboard to filter metrics and charts for a specific monitoring window.
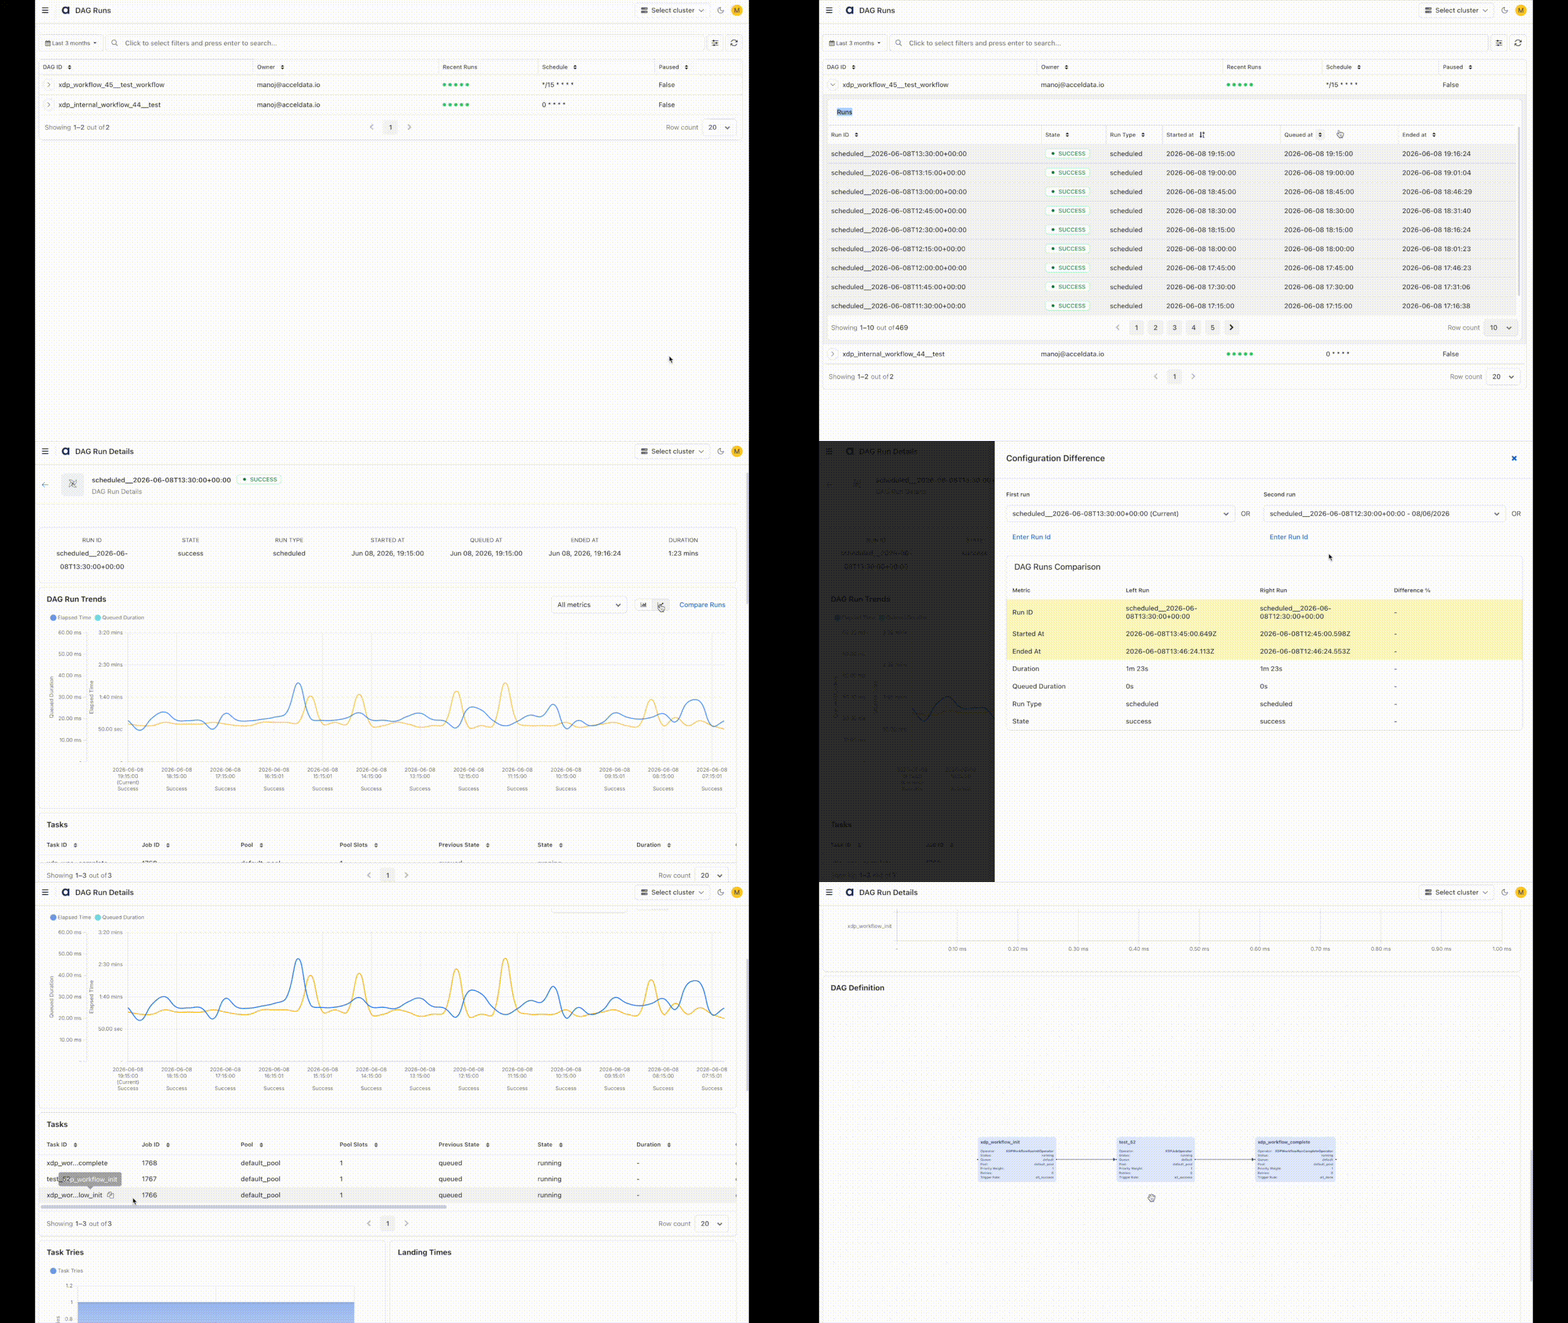
DAGs
DAG ID — Unique DAG name
Owner — DAG owner
Recent Runs — Status indicators of the latest runs
Schedule — Cron or preset schedule
Paused — Whether DAG is paused
Start Date — Initial activation date
Runs Section
Expand a DAG, and for each DAG run, you can find these details.
Run ID — Unique run identifier
State — Success, Failed, Running, etc.
Run Type — Scheduled, Manual, Backfill
Started At — Execution start time
Queued At — Time entered queue
Ended At — Completion time
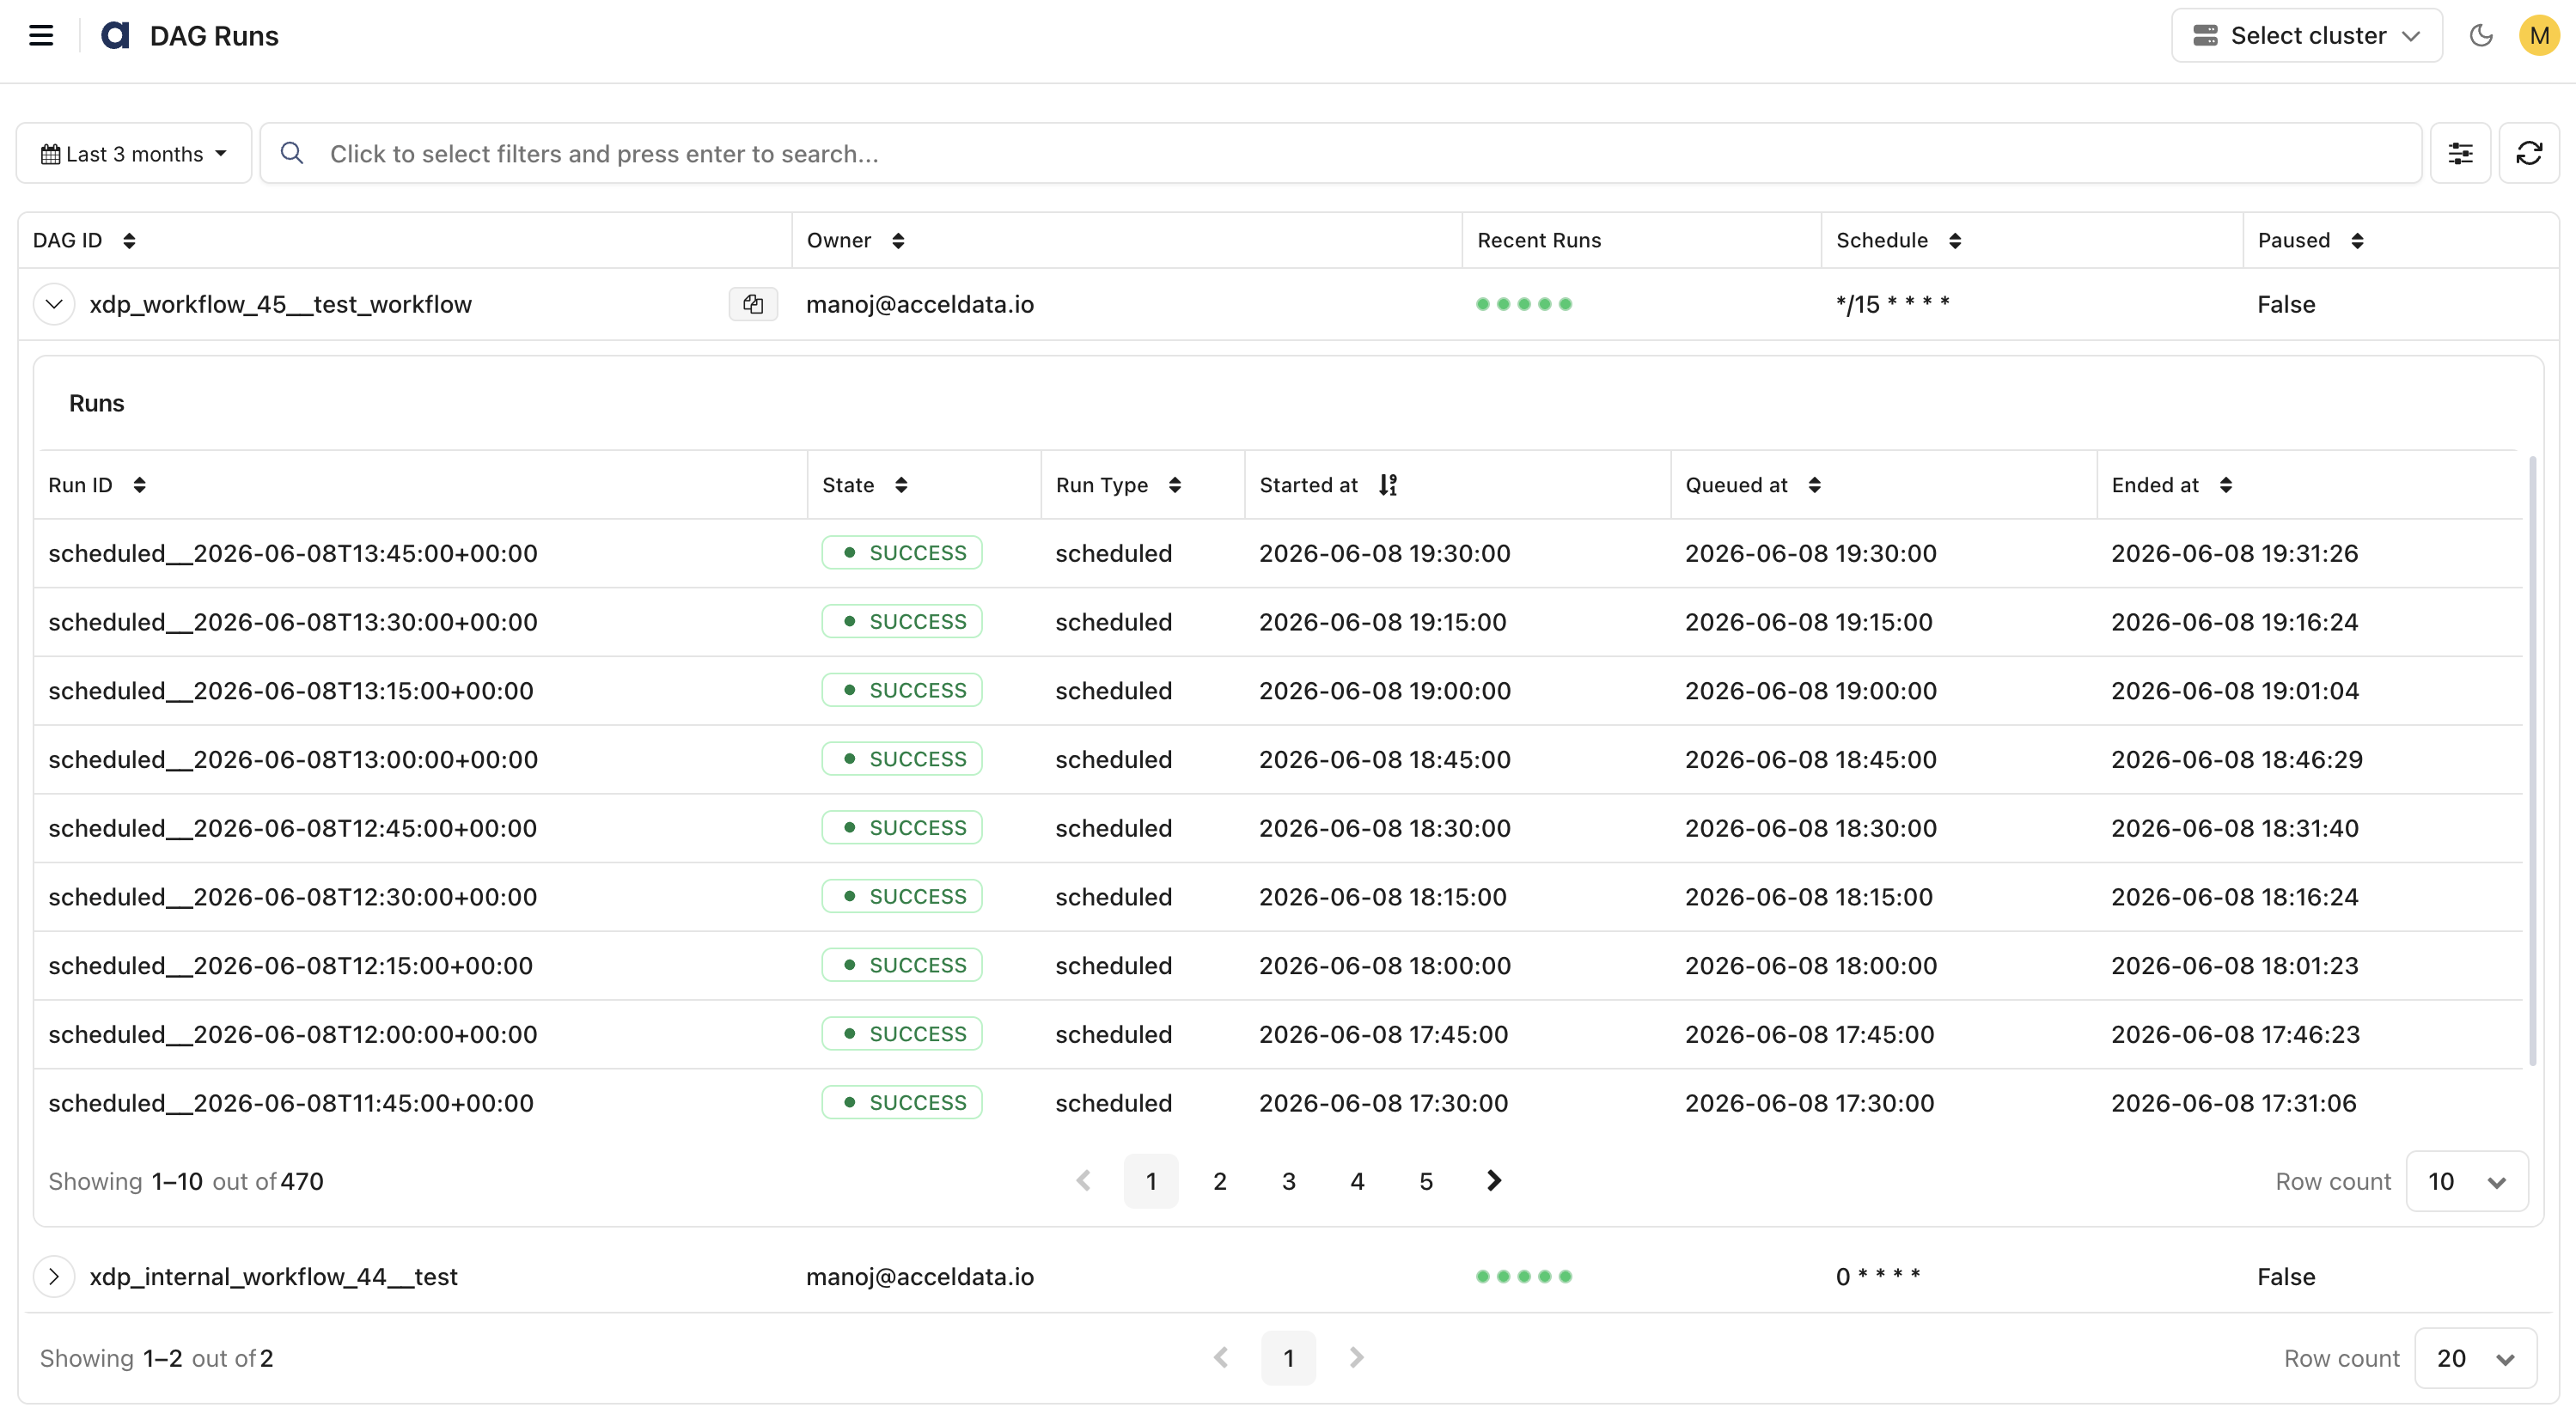
DAG Run Details
Provides deep observability for a specific DAG run.
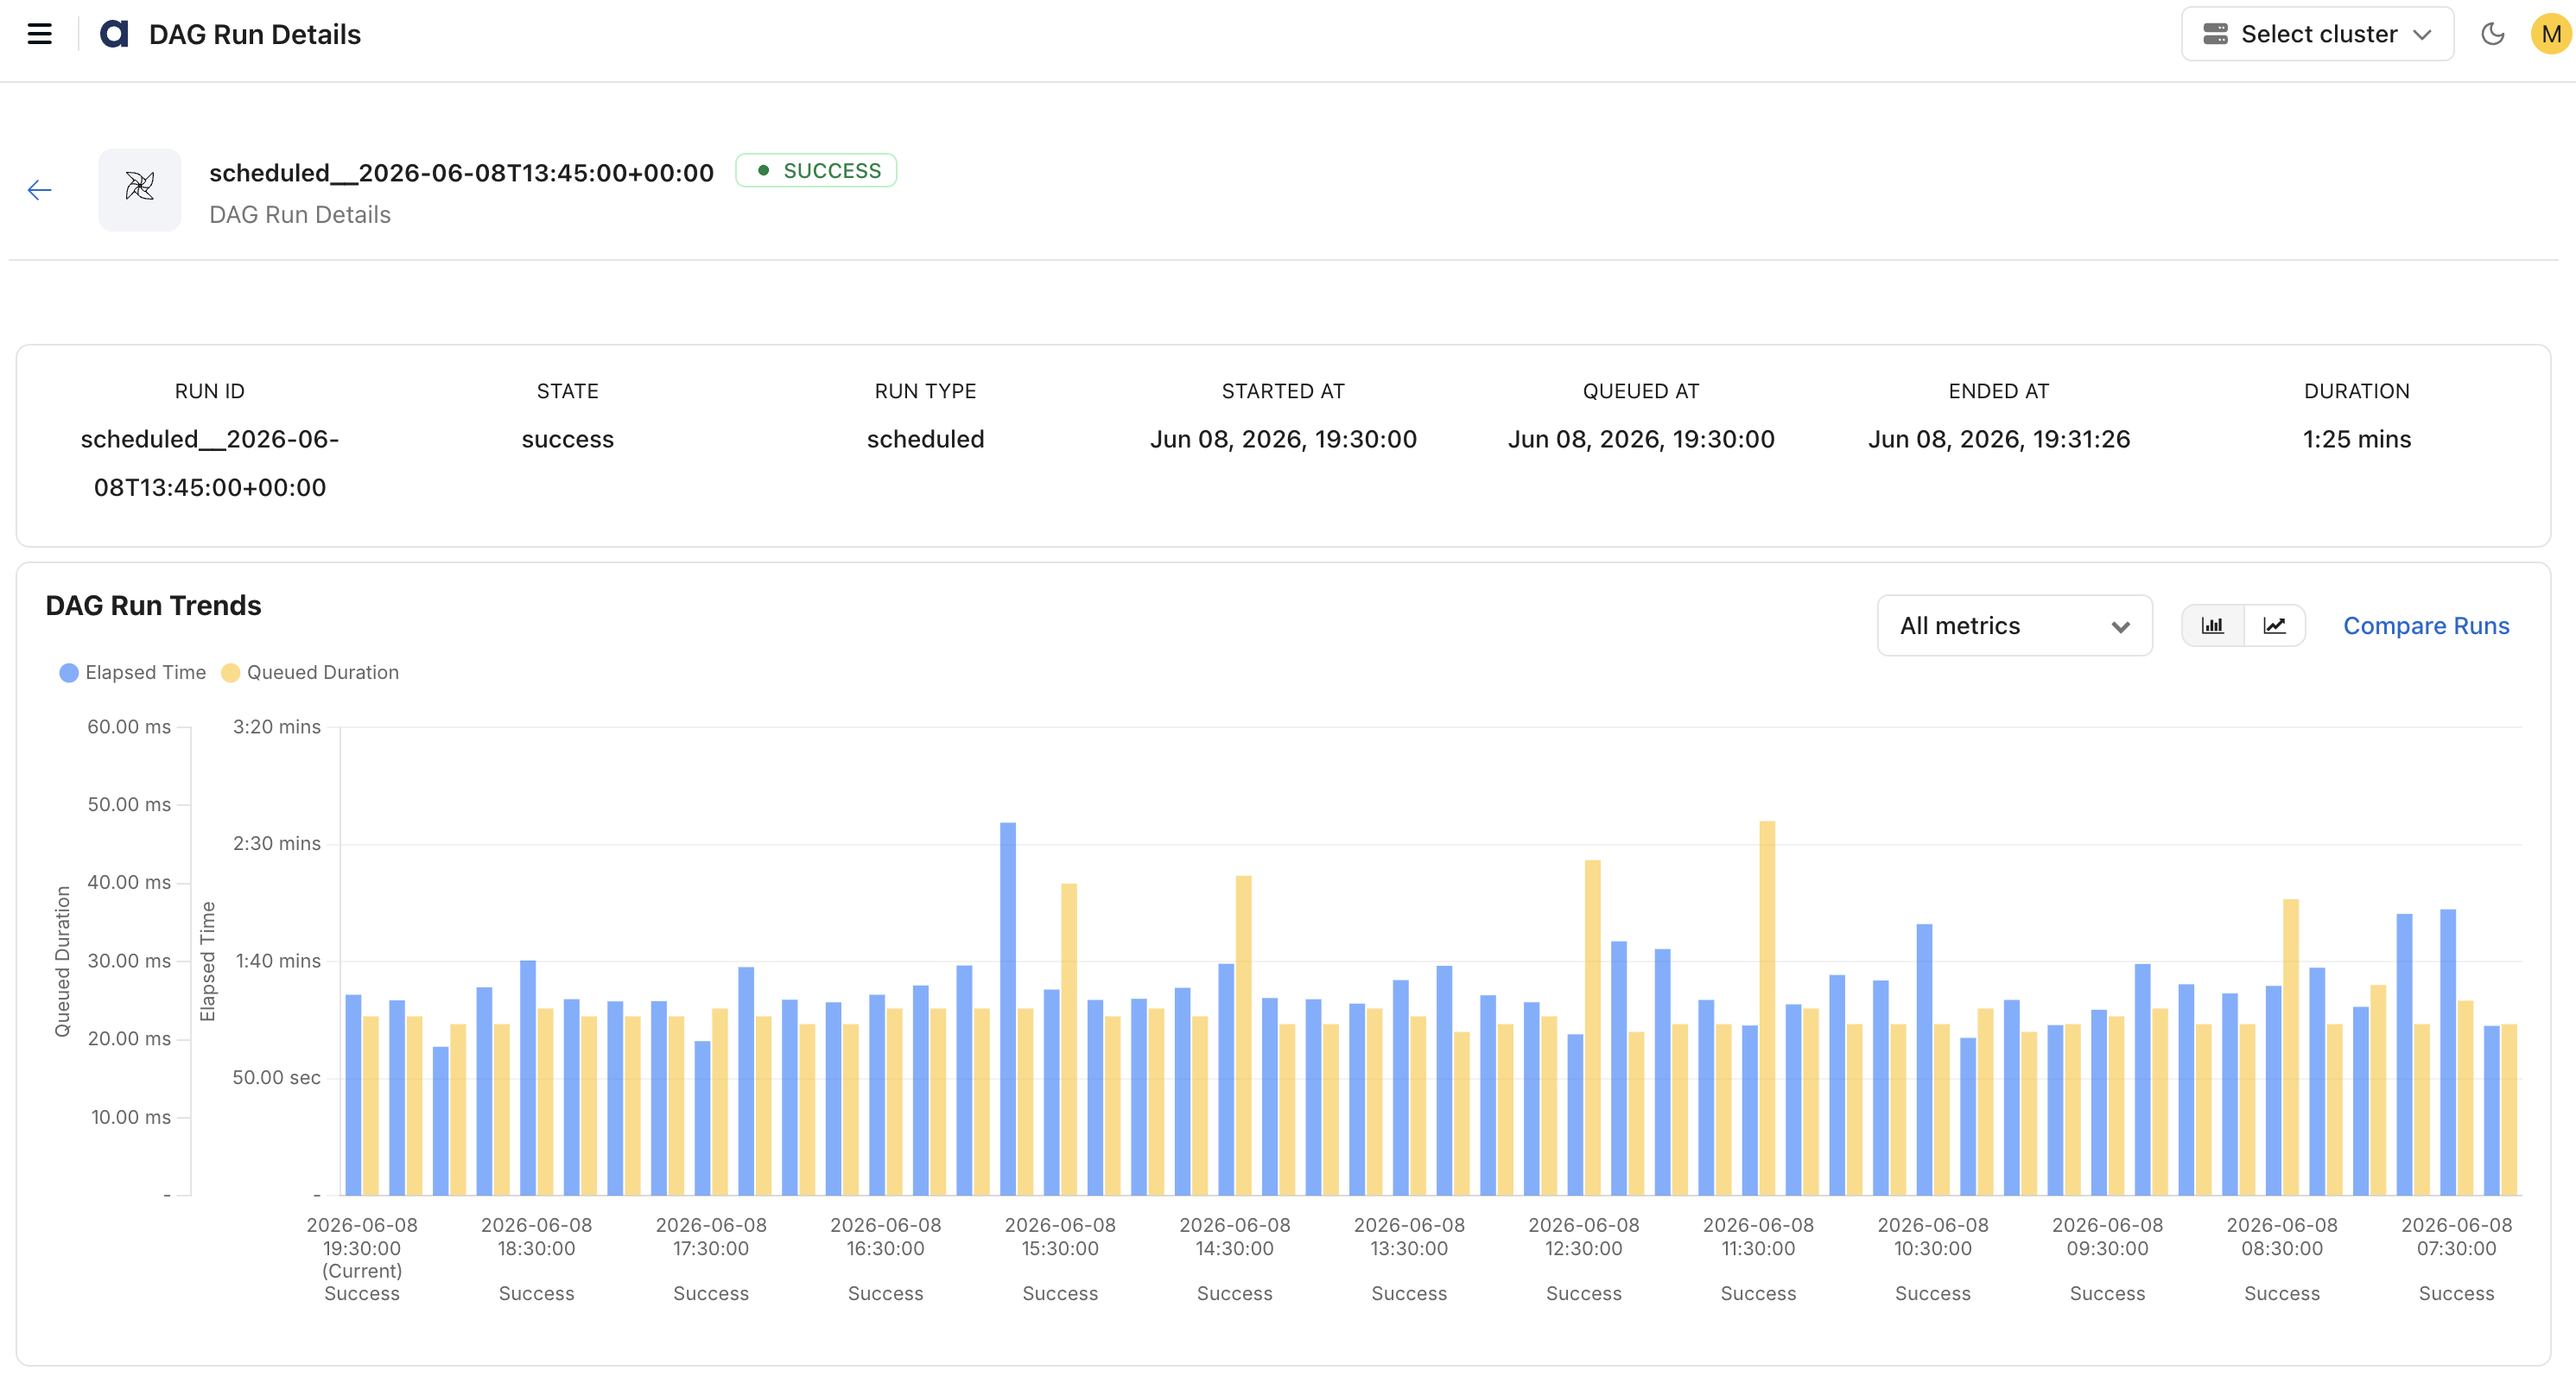
Run Summary
Run Information
Run ID
Run Type
State
Timing Details
Started At
Queued At
Ended At
Duration
DAG Run Trends
Compares:
Elapsed Time
Queued Duration
Across historical runs.
Tasks Table
For each task:
Task Information
Task ID
Job ID
Operator
Execution Status
Previous State
Current State
Timing Details
Queue
Started At
Ended At
Duration
Resource and Scheduling
Pool
Pool Slots
Priority Weight

Task Tries
Shows retry attempts and retry behavior trends.
Landing Times
Displays task scheduling, landing times, and execution distribution.
Execution Timeline
Visual timeline view showing:
Task execution order
Parallelism
Dependencies
Branch behavior
DAG
Displays the workflow execution flow as a Directed Acyclic Graph (DAG), showing task dependencies, execution order, task status, and operator details from workflow initialization through completion.
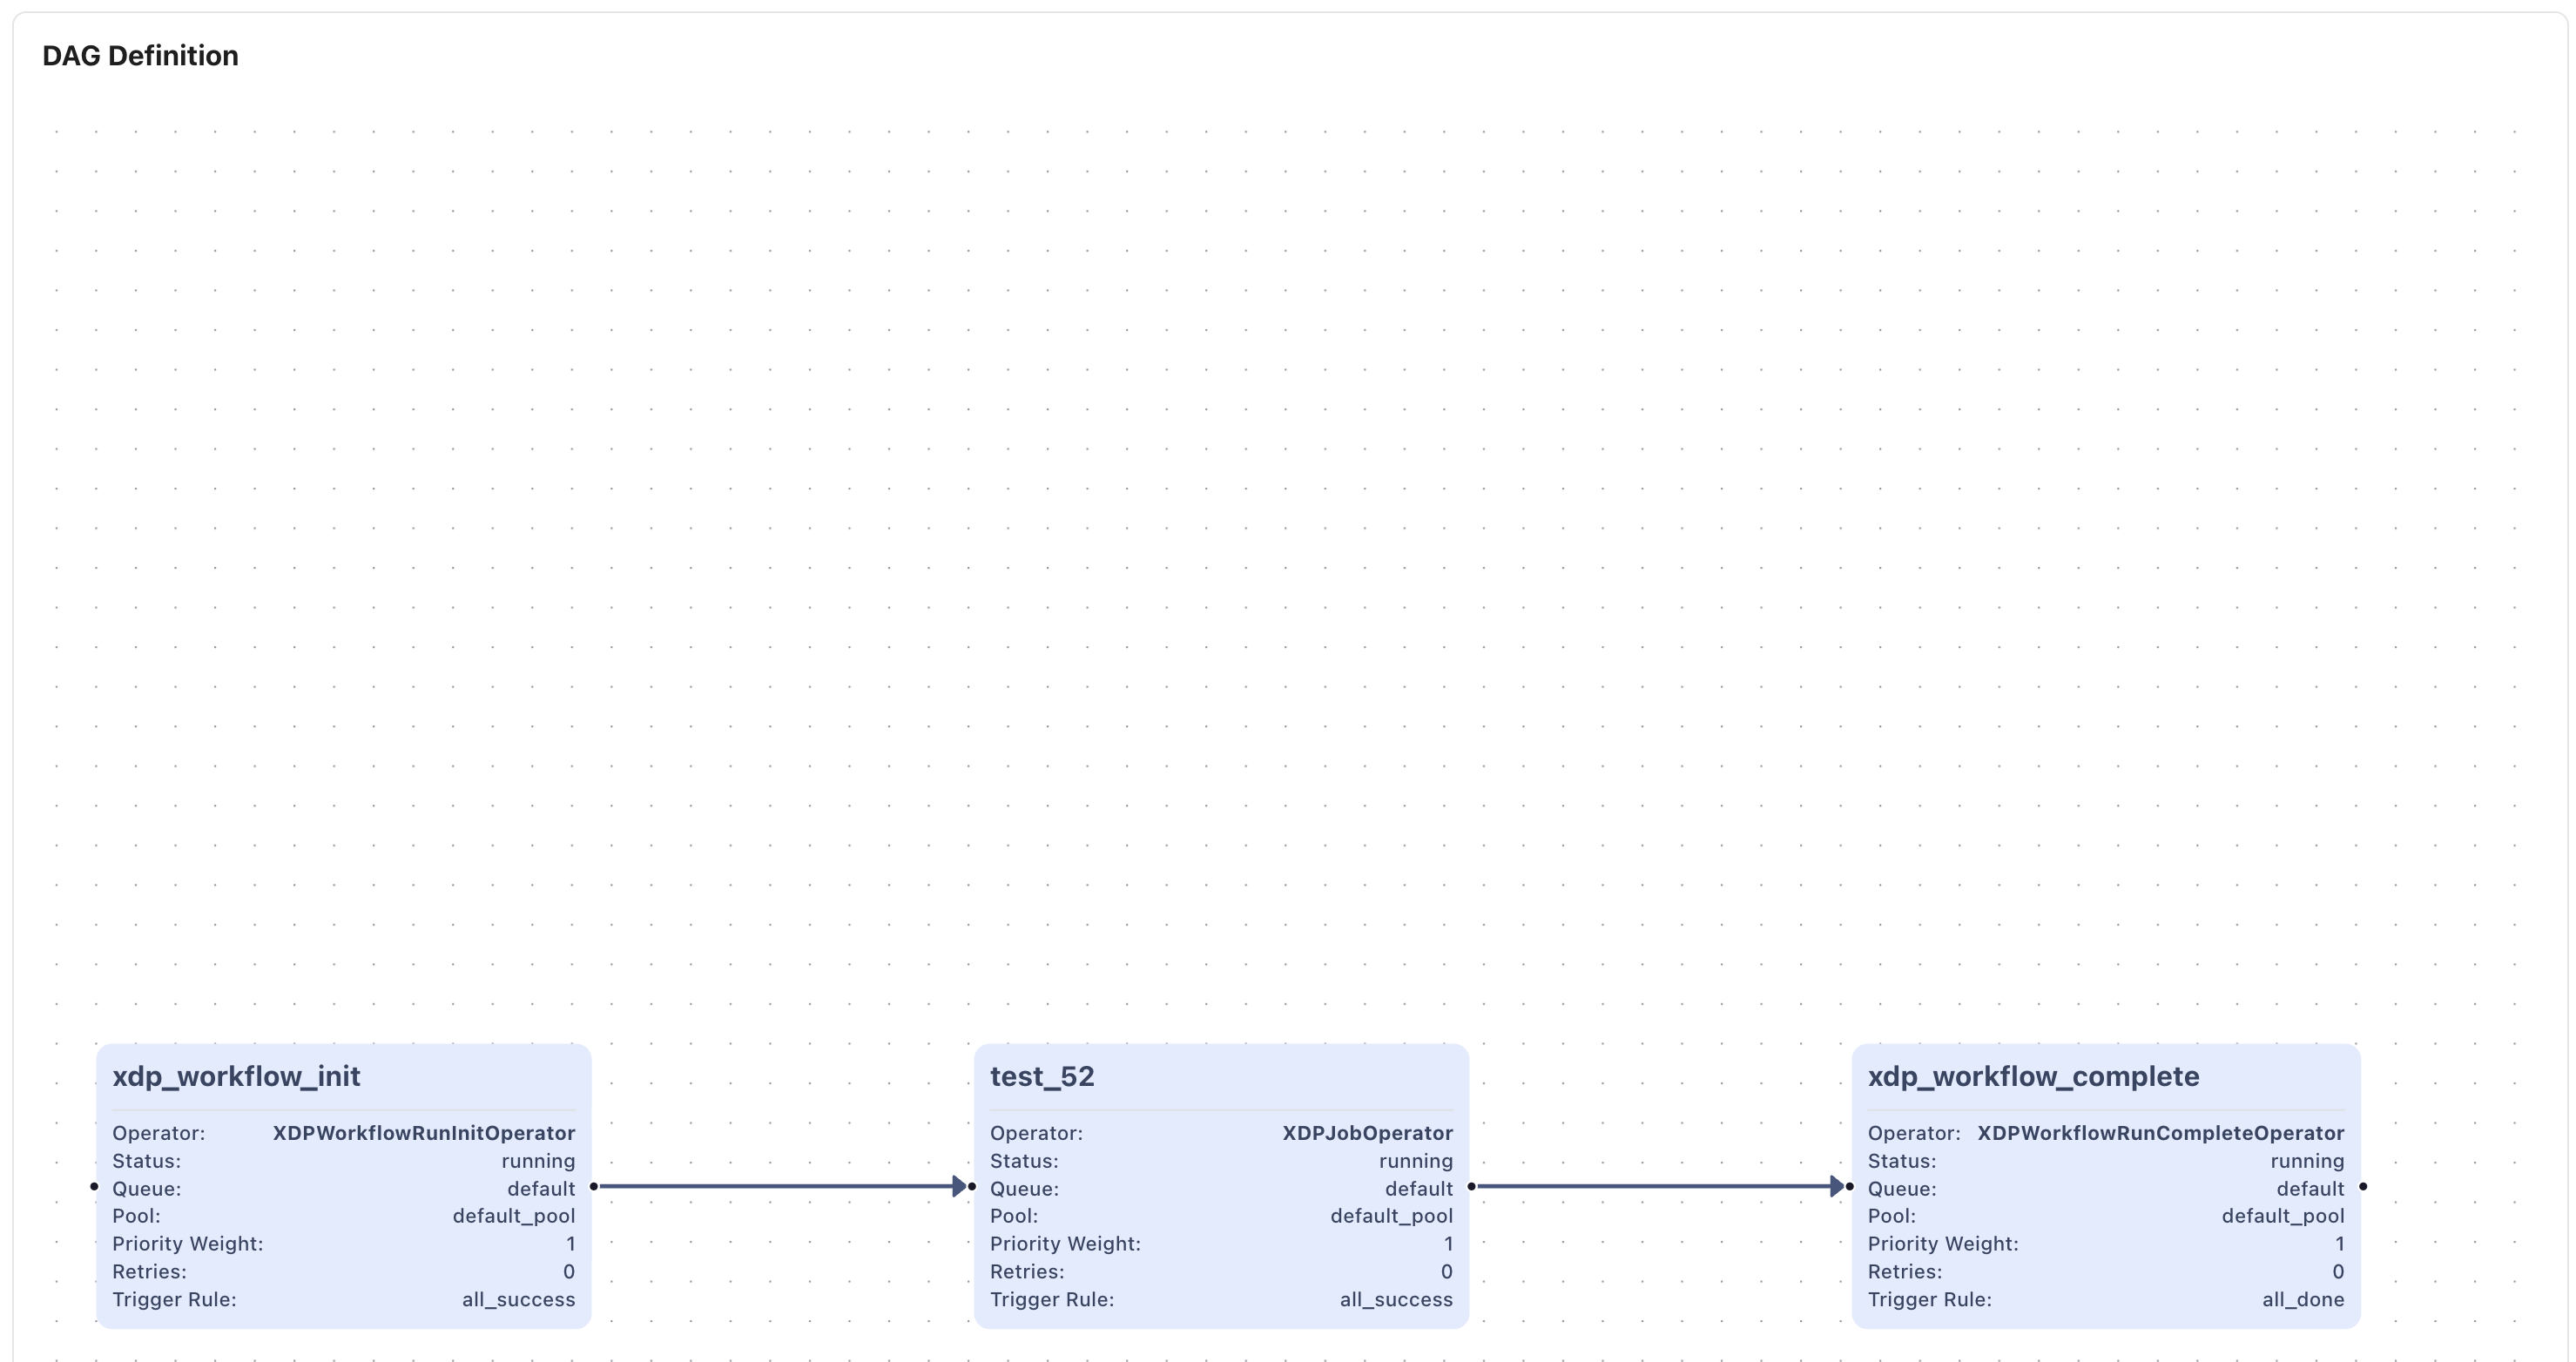
Features
Search and filter: You can search and filter the records.
Refresh the page to retrieve the latest job metrics.
Have a suggestion?