
Spark Job Details
The Spark Job Details page provides detailed information about the execution and performance of an individual Spark application. Use this page to monitor resource utilization, analyze jobs and stages, investigate failures, and identify performance bottlenecks.
With xObserve, you can:
- Troubleshoot failed or slow-running Spark applications.
- Monitor job, stage, and task execution.
- Analyze driver and executor resource utilization.
- Identify inefficient stages, scheduling delays, and data skew.
- Compare application runs to investigate performance differences.
- Analyze execution plans and identify optimization opportunities.
Access Spark Job Details
To view the details of a Spark application:
- In the xObserve UI, navigate to Spark > Jobs.
- Select the cluster from the cluster selector in the upper-right corner.
- Locate the Spark application you want to investigate.
- Click the Application ID.
The Spark Job Details page opens, displaying application information, execution metrics, resource utilization, and performance analytics.
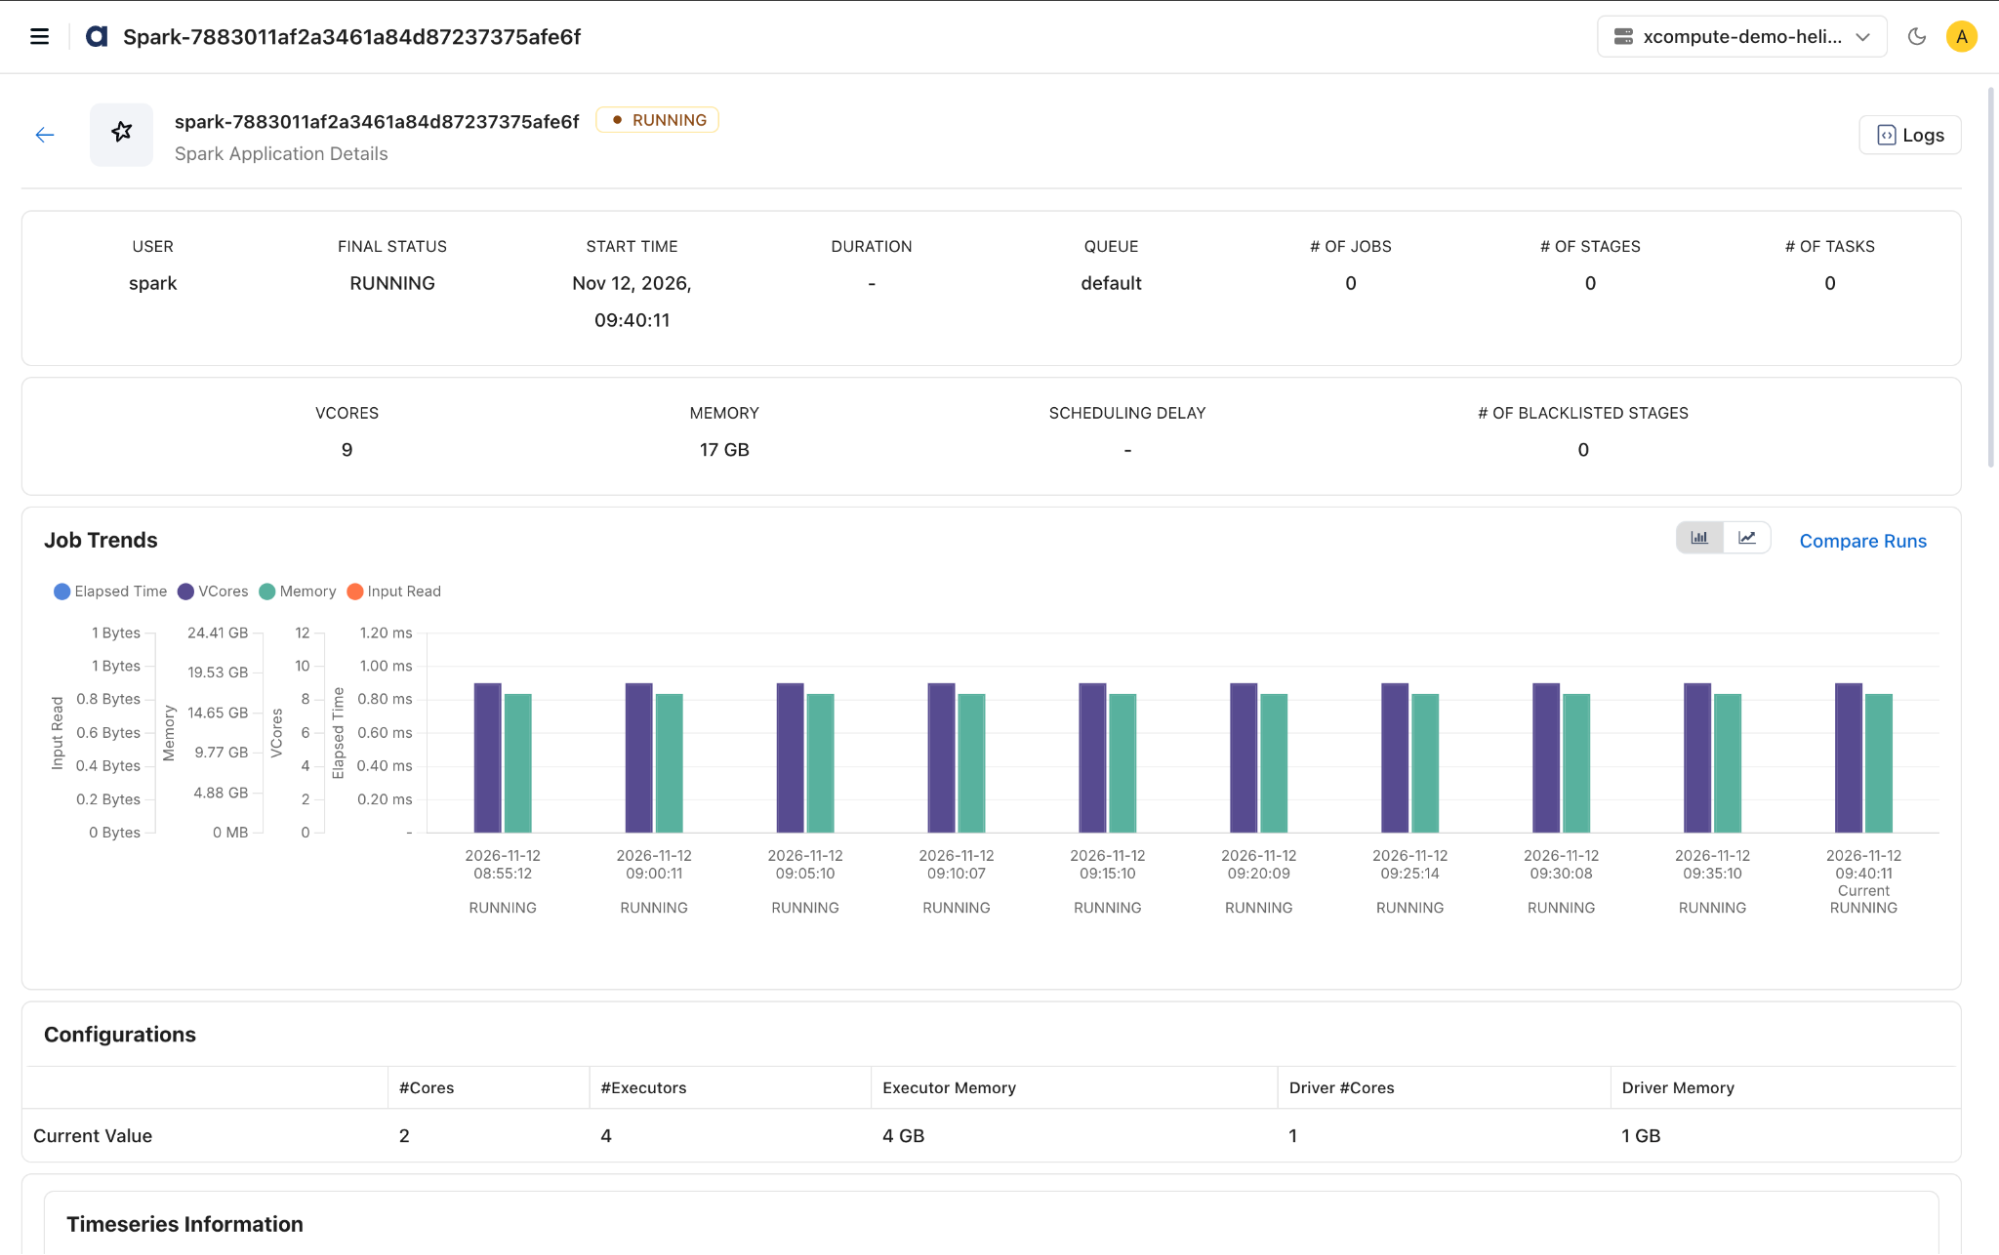
Spark application summary
The application summary provides an overview of the selected Spark application's execution status, resource utilization, and performance.
Application information
View the following application details:
- Application ID
- User
- Final Status
- Start Time
- Duration
- Queue
- vCores and Memory
Execution statistics
Monitor the following metrics:
- Number of Jobs
- Number of Stages
- Number of Tasks
- Inefficient Stages
- Blacklisted Stages
- Average Memory Usage
- Average vCore Usage
- Scheduling Delay
Use these metrics to assess application execution and identify potential performance issues.
Job Trends
The Job Trends section displays historical execution trends for the same Spark application.
Monitor the following metrics:
- Elapsed Time
- vCore Usage
- Memory Consumption
- Input Data Read
Use this information to compare application runs, identify performance regressions, monitor workload growth, and evaluate tuning changes.
Compare Runs
Use Compare Runs to compare two Spark application executions and identify differences in performance, resource allocation, and configuration.
Select two Spark application IDs to view their execution details side by side.
Metric comparison
The Metric tab displays the following execution metrics:
- Execution Time
- Application ID
- Start Time
- End Time
- Driver Cores
- Executor Cores
- Driver Memory
- Executor Memory
- Dynamic Executor Settings
- Application Attempts
For each metric, the comparison displays the values from both applications and the percentage difference, where applicable.
Use this information to identify performance regressions, execution anomalies, and resource utilization differences.
Configuration comparison
The Config tab compares the Spark configurations used by the selected application runs.
Configuration details include:
- Spark Application ID
- Driver Host
- Driver Address
- Spark UI Proxy Settings
- Application Start and Submit Times
- JAR Locations
- Driver and Executor Configuration Parameters
- Spark Runtime Properties
Use this comparison to identify configuration changes that might affect application performance or execution behavior.
You can also use Compare Runs to validate tuning changes and troubleshoot differences between application executions.
Configuration details
The Configurations section displays the resources allocated to the Spark application.
View the following settings:
- Number of Cores
- Number of Executors
- Executor Memory
- Driver Cores
- Driver Memory
Use these settings to investigate resource allocation and application performance.
Spark Jobs
The Spark Jobs section displays the jobs executed within the selected Spark application.
For each job, view:
- Job ID
- Job Name
- Failed Stages
- Completed Tasks
- Duration
- Status
You can also:
- Use Group By Job ID to organize jobs by their IDs.
- Use Show Inefficient Stages to identify stages with potential performance issues.
- Expand a job to view its stages.
Job stages
Expand a job to view the following stage-level metrics:
- Stage ID
- Job ID
- Task Count
- Duration
- Maximum Task Memory
- I/O Utilization
- Shuffle Read
- Shuffle Write
- Task Skew
- Status
- Failure Reason
Use these metrics to investigate long-running stages, data skew, shuffle bottlenecks, memory pressure, and execution failures.
Job Timeline
The Timeline view displays job execution activity chronologically.
Use this view to:
- Track execution progress.
- Identify scheduling delays.
- Understand stage execution order.
- Analyze parallel execution.
Timeseries Information
The Timeseries Information section displays runtime metrics for the selected Spark application.
Use the time range selector to focus on a specific execution period.
Schedule Information
The Schedule Information panel displays task scheduling metrics, including:
- Active Tasks
- Current Thread Pool Activity
Use these metrics to investigate scheduling delays, resource contention, and task concurrency.
You can also display metrics for individual executors.
I/O Metrics
The I/O section displays data read and write activity.
Monitor:
- Input Bytes Read
- Output Bytes Written
Use these metrics to analyze data throughput and identify I/O bottlenecks.
Driver Memory Usage
The Driver Memory Usage section displays memory utilization for the Spark driver.
Monitor:
- Driver Total Memory
- Heap Memory Usage Distribution
Use these metrics to identify memory pressure and evaluate driver memory allocation.
Executor Memory Usage
The Executor Memory Usage section displays memory utilization across Spark executors.
Monitor:
- Executor Total Memory
- Heap Memory Usage Distribution
You can view aggregated metrics or enable Show Individual Executors to analyze executor-specific memory usage.
Use this information to identify memory bottlenecks and evaluate executor resource allocation.
GC and CPU Distribution
The GC and CPU Distribution section displays JVM garbage collection and CPU utilization metrics.
Monitor:
- JVM Garbage Collection Count
- CPU Utilization
Use these metrics to identify excessive garbage collection, high CPU utilization, and resource inefficiencies.
You can also view executor-level metrics for detailed analysis.
Shuffle Information
The Shuffle Information section displays data transfer metrics between Spark stages.
Monitor:
- Shuffle Bytes Written
- Shuffle Local Bytes Read
- Shuffle Remote Bytes Read
- Shuffle Remote Bytes Read to Disk
Use these metrics to identify expensive shuffle operations, network bottlenecks, and data transfer overhead.
Storage Memory
The Storage Memory section displays Spark storage memory utilization.
Monitor:
- Block Off-Heap Memory Used
- Block On-Heap Memory Used
- Block Max On-Heap Memory
- Block Max Off-Heap Memory
- Block Disk Space Used
Use these metrics to analyze caching behavior and storage memory consumption.
HDFS Information
The HDFS Information section displays storage activity associated with the Spark application.
Monitor:
- HDFS Read Activity
- HDFS Write Activity
Use these metrics to identify storage access patterns and potential bottlenecks.
Aggregate Metrics
The Aggregate Metrics table summarizes task execution statistics.
Metrics include:
- Executor Runtime
- JVM GC Time
- Input Bytes Read
- Disk Bytes Spilled
- Memory Bytes Spilled
For each metric, the table displays:
- Sum
- Minimum
- Maximum
- Mean
- Description
Use these metrics to identify resource-intensive tasks, excessive disk or memory spills, garbage collection overhead, and runtime inefficiencies.
Core Usage by Locality
The Core Usage by Locality section displays compute resource utilization.
Monitor:
- Used Core Percentage
- Wasted Core Percentage
Use these metrics to identify underutilized resources, evaluate executor sizing, and improve workload placement.
DAG Visualization
The DAG section displays the Spark execution plan as a Directed Acyclic Graph (DAG).
Use this visualization to understand execution flow, analyze stage dependencies, and identify expensive operations.
For each node, view details such as:
- Operation Name
- Duration
- Output Rows
- Execution Relationships
Use the DAG to investigate execution paths and identify optimization opportunities.
Additional actions
The Spark Job Details page also supports the following actions:
- Search and filter job information, where available.
- Expand jobs to view stage details.
- Switch between Jobs and Timeline views.
- Compare historical executions using Compare Runs.
- Enable Show Individual Executors to view executor-specific metrics.
- Refresh the page to retrieve the latest execution data.
This version preserves the original feature coverage and section flow while removing repetitive explanations, using action-oriented language, and keeping UI labels consistent.
Have a suggestion?