User Guide
Pulse 4.1.x
Get Started
Architecture
Core Concepts
Monitor and Analyze
Manage Alerts and Actions
Optimize Resources
Generate Reports
Manage Users and Roles
Workflows
Title
Message
Create new category
What is the title of your new category?
Edit page index title
What is the title of the page index?
Edit category
What is the new title of your category?
Edit link
What is the new title and URL of your link?
Collect Service Profiling Data
Summarize Page
Copy Markdown
Open in ChatGPT
Open in Claude
Connect to Cursor
Connect to VS Code
The Service Profiler feature provides deep visibility into the runtime behavior of Java services by capturing detailed performance metrics using Java Flight Recorder (JFR).
With Service Profiler, you can:
- Collect Profiling Data: Capture detailed runtime performance data for Java-based services running on cluster nodes.
- Analyze CPU Utilization: Identify CPU-intensive operations and isolate performance bottlenecks at the JVM level.
- Perform Offline Analysis: Access and review JFR files directly on the node where profiling data is generated for in-depth offline diagnostics.
This is introduced in Pulse 4.0.0.
Profiling Scope and Limitations
- Supported Applications: Pulse currently supports profiling for JVM-based applications only.
- Event Type: Presently, CPU event profiling is supported.
- Profiling Mode: Pulse uses time-based profiling, which allows you to capture data over a defined duration.
- Ideal Use Cases: Best suited for services that show recurring or predictable performance issues, especially those observed daily or during specific operational windows.
- Storage Considerations: Since profiling data is stored locally on the node where the service and its components are running, ensure sufficient storage availability before enabling profiling.
Before You Begin
To use the Service Profiler capability in Pulse, make sure the following components are deployed:
- Profiler Agent on all Hadoop nodes to collect JVM profiling data. For details, see Install Pulse Agents.
- Pulse JFR Profiler addon in the Pulse environment to enable the ad-pulse-profiler service and process JVM profiling data. For details, see Deploy the Service Profiler Add-on Service.
Service Profiler Options
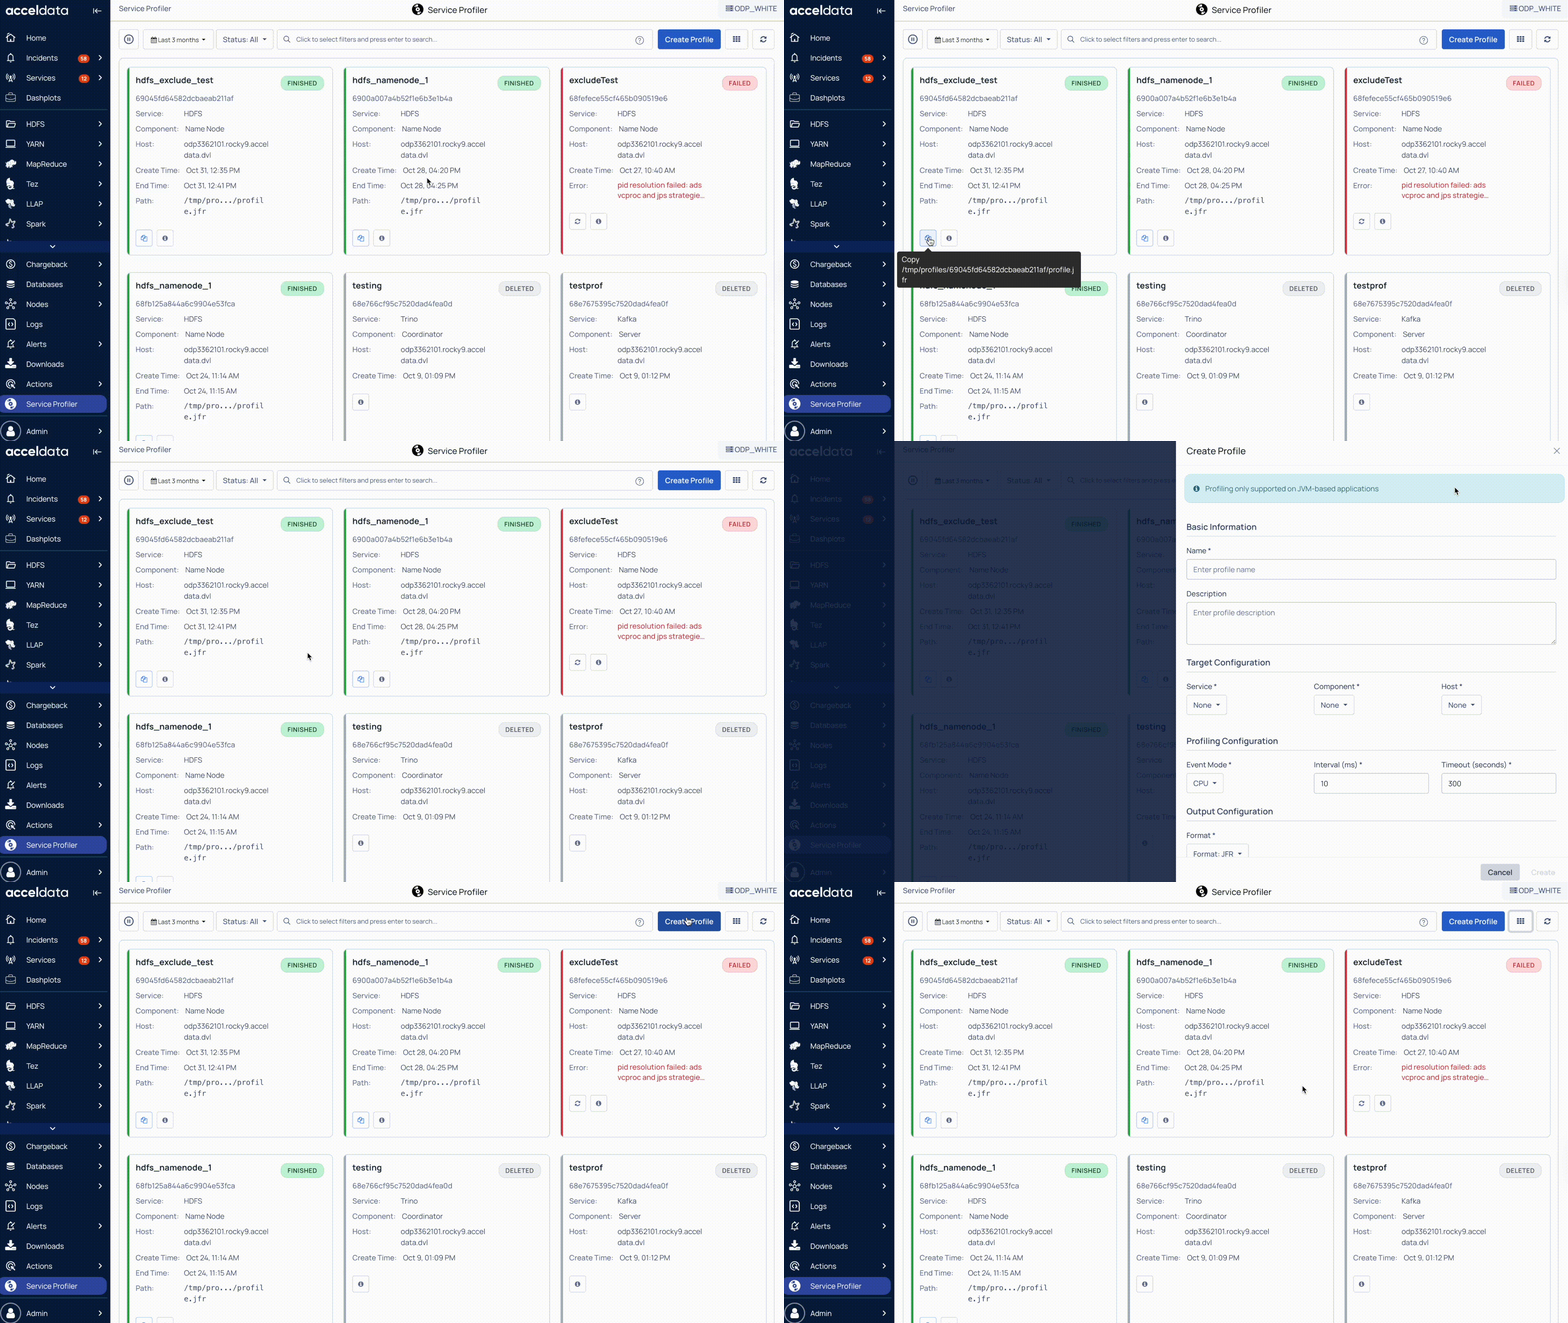
The Service Profiler page in the Pulse UI lists all service profiles that have been created. It displays the current status of each profile and provides quick access to its details.
Profile Information
- Status: Shows the current state of each profile, such as Finished, Queued, etc.
- JFR File Path: Displays the path on the node where the JFR file is stored.
- View Details: Click View Details to see complete profiling information for the selected profile.

Key Features
The Service Profiler page provides several options for managing and viewing profiling data:
- Refresh Status: Use the Play (⏵) button to automatically refresh the cluster status every 10 seconds. Use the Pause (⏸) button to stop refreshing.
- Timestamp: Filter profiles by time range, such as Today, Last 12 hours, or Last 3 months, or choose a custom period and click Apply.
- Status Filter: Filter profiles by their current status, such as Created, Requested, Profiling, Failed, etc.
- Search: Search and locate profiles using keywords. For guidelines and examples for searching records, see Search and Analyze Records.
- Create Profile: Click Create Profile to start a new profiling request.
- Change View: Click Change View to switch between card view and table view.
- Refresh: Click Refresh to update the list of service profiles.
Explore in Detail
Type to search, ESC to discard
Type to search, ESC to discard
Type to search, ESC to discard
Last updated on
Was this page helpful?
Next to read:
Deploy the Service Profiler Add-on ServiceFor additional help, contact www.acceldata.force.com OR call our service desk +1 844 9433282
Copyright © 2026
Discard Changes
Do you want to discard your current changes and overwrite with the template?
Archive Synced Block
Message
Create new Template
What is this template's title?
Delete Template
Message