Overview
The Spark History Server provides a persistent web UI for analyzing completed Spark applications. Use it to debug failures, troubleshoot performance bottlenecks, and review resource utilization long after a job has finished running.
Accessing the Spark History Server
Prerequisites
A completed (Success or Failed) Spark job in xDP.
Appropriate permissions to view job run details.
Steps
From the xDP side navigation, go to Spark > Job Runs.
Select a completed job run to open its details page.
In the top-right corner of the Run ID details page, click Spark History Server.
You are redirected to an authentication portal. Click Sign in with OpenID Connect to proceed.
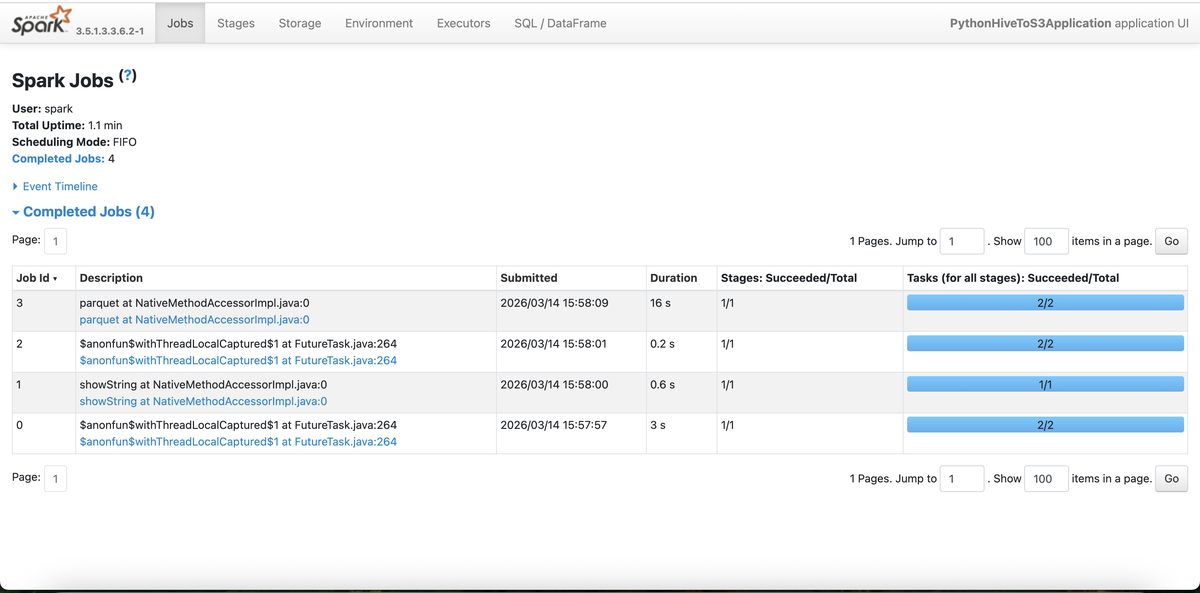
After authenticating, the standard Apache Spark UI opens.
The Spark UI is the standard Apache Spark web interface. It provides tabs for Jobs, Stages, Storage, Environment, Executors, and SQL / DataFrame — use these to investigate job execution, resource usage, and query plans as needed.
How-to Guides
How to Identify a Performance Bottleneck
Open the Spark History Server for the target job run.
Navigate to the Stages tab and sort by Duration to find the longest-running stage.
Click the stage's Description link to open its detail page.
In the Tasks table, sort by Duration to find straggler tasks.
Check for high GC Time, Shuffle Write Time, or disproportionate Input Size (data skew) among the slowest tasks.
How to Verify Spark Configuration for a Past Job Run
Open the Spark History Server for the job run.
Navigate to the Environment tab.
Scroll to the Spark Properties table.
Use browser search (Ctrl+F / Cmd+F) to locate specific properties such as
spark.executor.memoryorspark.sql.shuffle.partitions.
Best Practices
Right-size your resources. Use the Executors tab to check memory and GC time. Consistently low storage memory suggests over-provisioning; high GC time suggests under-provisioning.
Review critical jobs proactively. Periodically inspect the History Server for long-running pipelines to catch performance regressions early.
Correlate with cluster metrics. Combine History Server data with infrastructure metrics from the xDP Compute Clusters page for a complete picture.