Spark Job Run Details
The Job Run Details page gives a granular view of a single Spark job execution — timeline, logs, and the exact configuration used for that run.
Navigating to a Run
From the side navigation, go to Spark Jobs and click the job name.
In the Job Runs table on the Job Details page, click a Run ID to open its details.
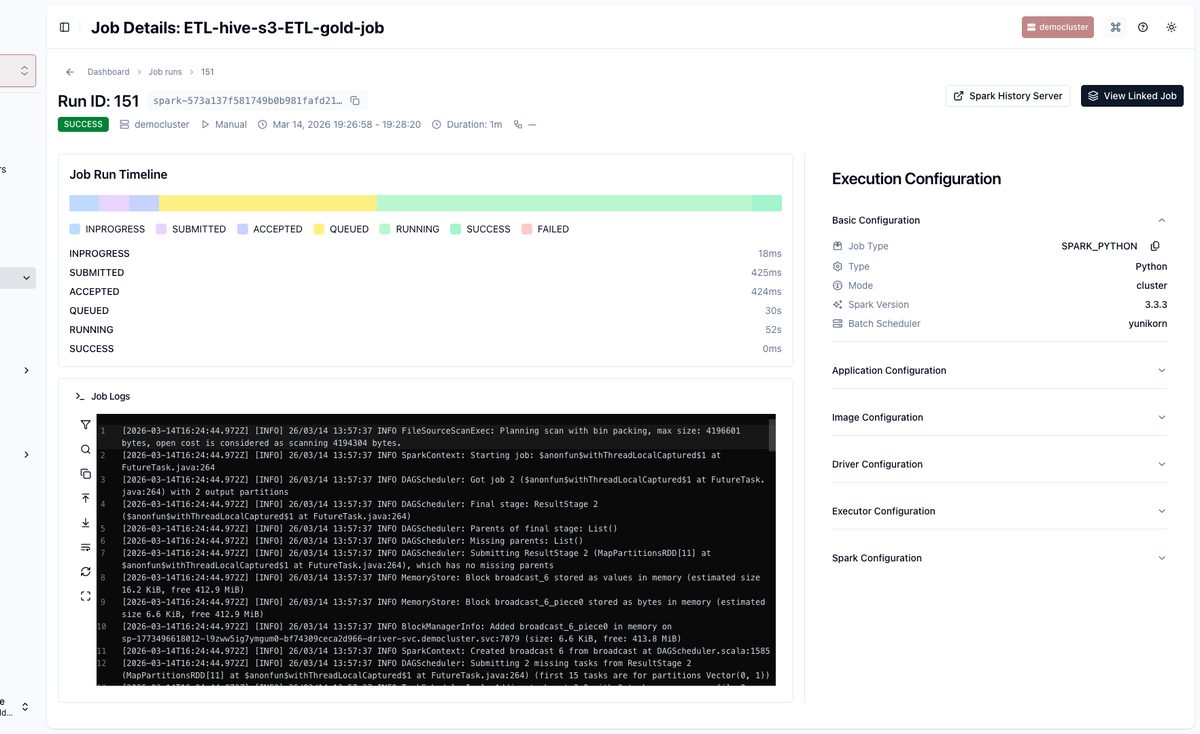
The page header shows the final status, total duration, and trigger type. The Execution Configuration panel on the right shows the exact settings used for this run.
Timeline and Logs
Job Run Timeline — Visual breakdown of run lifecycle stages: Submitted → Queued → Running → Success/Failed. A long
QUEUEDtime indicates resource contention; a longRUNNINGtime points to an issue in the Spark application.Job Logs — Raw stdout/stderr from the Spark driver. Use the search, copy, and download tools in the log viewer.
For deep-dive performance analysis, click Spark History Server (completed runs) or Live Spark UI (running jobs) in the top action bar.
Diagnose a Failed Run
Open the failed run from the Job Runs table.
Check the Job Run Timeline to identify which stage failed.
Expand Job Logs and search for error messages or stack traces.
To compare against a successful run: open both run detail pages side-by-side and compare their Execution Configuration panels — differences in data access mode, resources, or Spark properties are common root causes.