Snowflake Query Studio
The Query Studio offers data on various warehouse and query metrics. On this page, you may use asset-level filters, found in the top left pane, as well as a Global Calendar filter.
You may view your previous queries in Query Studio. Snowflake also allows you to view real-time queries.
This page provides advanced filtering as well as the ability to cancel running queries.
One of the most important features is the ability to view comparable questions using a concept known as fingerprinting, in which similar requests are grouped together with the same fingerprint ID. This provides a bird's-eye perspective of how many similar requests are being fired, as well as other pertinent statistics.
In addition, Studio gives a detailed overview of query performance, allowing users to examine execution durations and resource use. It also allows you to monitor query progress and any issues or warnings that may arise during execution. Users may optimize their queries and enhance overall system efficiency with this comprehensive view.
In Query Studio, you will find the following tabs:
Query Studio
Query Studio Tab
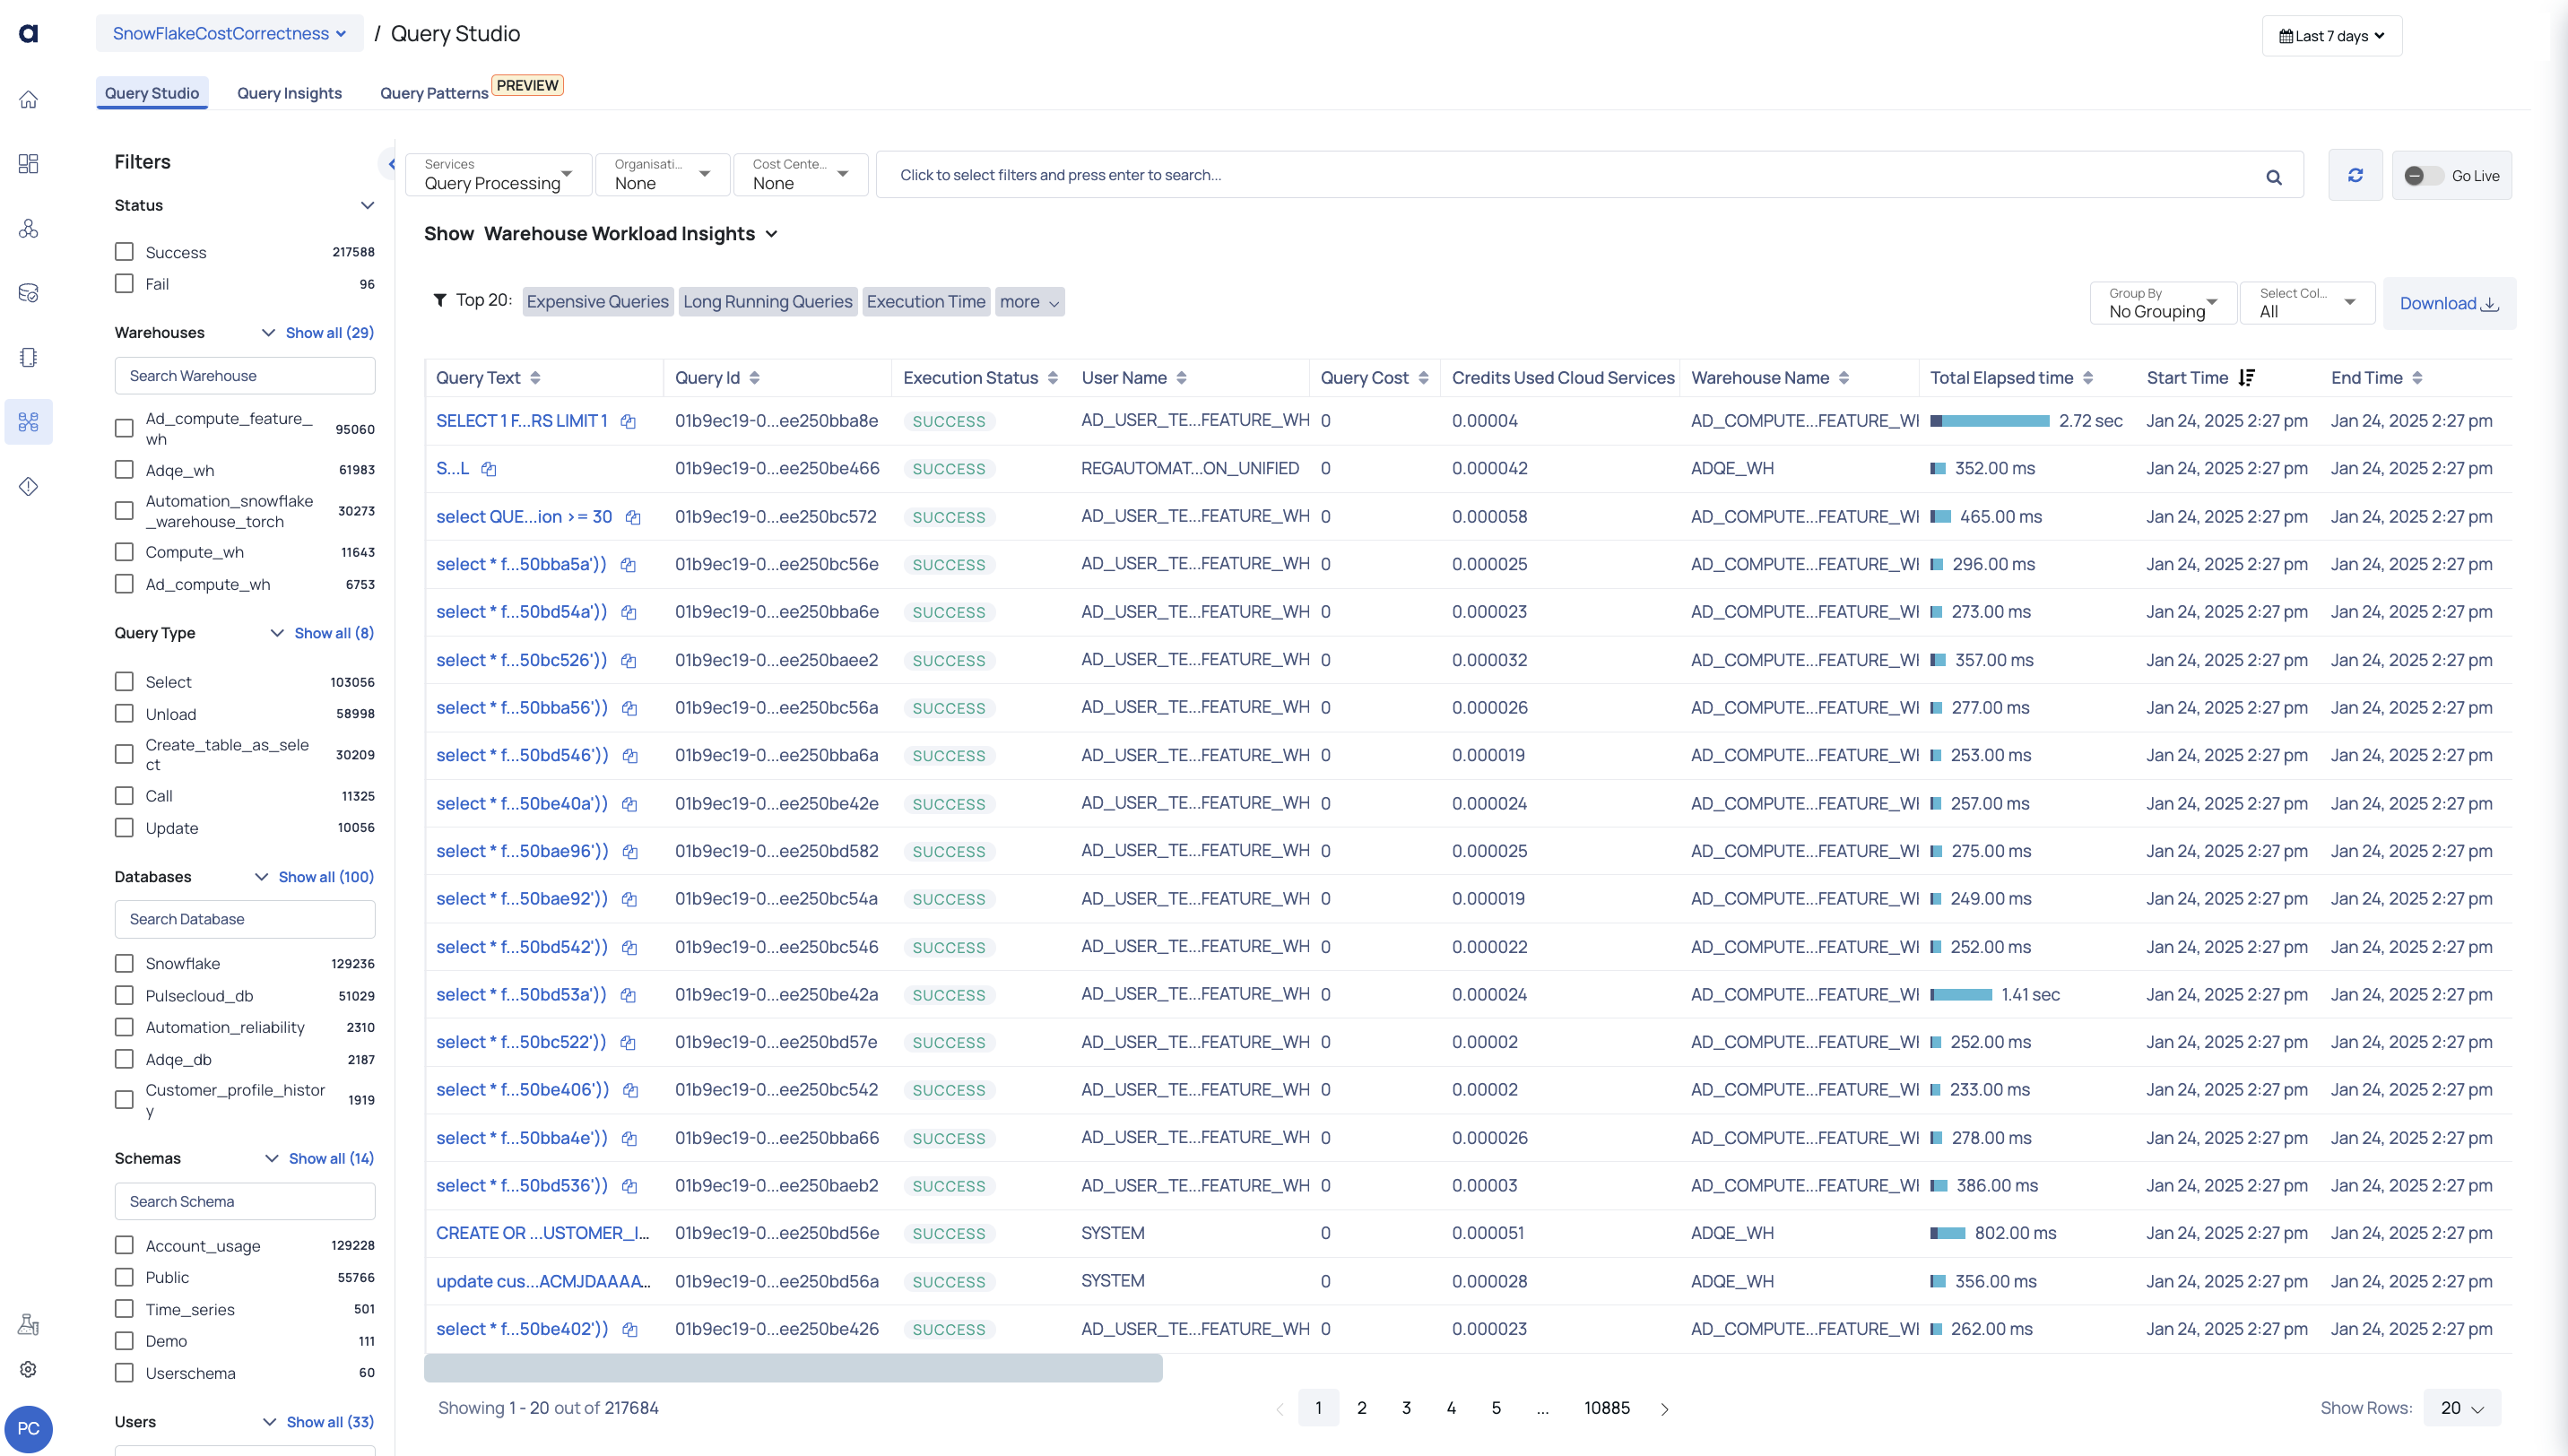
The Query Studio page offers data on various warehouse and query metrics. On this page, you can use asset level filters (found on the left pane) and the Global Calendar filter.
You may view your previous queries in Query Studio. On Snowflake, you can also view real-time queries. This page provides advanced filtering as well as the ability to cancel running queries.
One of the most important features is the ability to view comparable questions using a concept known as fingerprinting, in which similar requests are grouped together with the same fingerprint ID. This provides a bird's-eye perspective of how many similar requests are being fired, as well as other important statistics.
| Widget | Descriptions |
|---|---|
| Warehouse Workload Insights | Warehouse Workload Insights chart is a heat map that displays the 95th percentile value of various parameters for your Snowflake warehouses. Note: The 95th percentile is a number(s) that is greater than 95% of the numbers in a given set. In the heat map, the parameters whose values are above normal with respect to other warehouses are highlighted. The horizontal row represents the warehouse names and the vertical column represents various parameters such as Latency, Query Load, Queue Load, Blocked, and Credits. You can apply filters to view data specific to query status, warehouses, query types, databases, and so on. These filters are contextual (for example, if you select a specific warehouse in the filter, only the databases of that warehouse are displayed in the database filters). You can also apply global calendar filters to the table. You can view the date and time when data was last fetched from Snowflake. You can refresh the screen to fetch the latest data from Snowflake. |
| Query Aggregate Table | The Query Aggregate table aggregates similar queries together to form a Query Fingerprint. You can view all the details of aggregated queries in this table. Alternatively, you can also view the query details individually without any fingerprint and also group by Users. |
| Query Fingerprint Table | In this table, each aggregated query group is assigned a unique ID called query fingerprint ID. You can drill down on the query fingerprint ID column to view the details of each individual query which are part of the Query fingerprint. When you apply any filters from the left pane, the data in the Query Aggregate table is refreshed as per the filters applied by you. The various columns included in the Query Aggregate table are described as follows: Sample Query: This columns displays the query used. Click the copy icon to copy the query to your clipboard. Clicking on the query will navigate you to the Query Details page. Distinct Warehouses: The number of unique warehouses. Query Count: The number of queries grouped as a result of query fingerprint process. Cloud Services Credits: The total number of credits consumed by the Query fingerprint. Query Cost: The estimated resources consumed by a database query, used to evaluate and optimize performance. Avg Execution Time: The average execution time of the queries which are grouped as part of the fingerprint. Max Execution Time: The maximum execution time of the queries which are grouped as part of the fingerprint. Median Execution Time: The median value of the query execution time of the queries which are grouped as part of the fingerprint. Median Queued Provisioning Time: The median value of the queue provision time of the queries which are grouped as part of the fingerprint. Avg Compilation Time: The average compilation time of the queries which are grouped as part of the fingerprint. Avg Total Elapsed Time: The average value of the total time elapsed in executing the queries, grouped as part of the query fingerprint process. This table displays filters which allow you to select the top 50 queries in various categories. The categories supported are Top 50 expensive queries, Top 50 long running queries, and so on. When you select any category, the filters in the left panel are automatically updated as per the selected category. All the left panel filters only display 50 queries which belong to the category selected. |
| No Grouping Table | This table displays data about all the individual queries. There is no fingerprinting in this view. The various columns displayed in this table are as follows: Query Text: The actual query. You can copy the query by clicking the copy icon. Query Id: The unique ID of the query. Execution Status: The execution status of the query. User Name: The username of the user who crated and executed the query. Acceldata Cost: The query-attributed cost calculated by Acceldata. This metric includes warehouse idle time, distributed across running queries. The previously named Snowflake Cost: The total cost of the query, derived from Query Cost: The estimated cost of the query execution. Credits Used Cloud Services: The cloud service credits consumed by the query. Credits Attributed Compute: The number of Snowflake-provided credits consumed by this query. This includes only the credits used for query execution and excludes any warehouse idle time. Warehouse Name: The name of the warehouse in which the query exists. Note You can now click on the Warehouse Name. It will take you to the Query Details page, where you can view details such as the actual cost incurred for a selected Snowflake query. Query Tag: The query tag assigned to this statement via the Query Hash: A hash value generated by Snowflake based on the canonicalized SQL text of the query. Parameterized Query Hash: A hash value provided by Snowflake, computed based on the parameterized version of the query. Total Elapsed Time: The total time spent for the query execution to complete (including time spent in queue). Start Time: The date and time when the query execution started. End Time: The date and time when the query execution ended. Bytes Scanned: The total amount of data scanned by the query (in bytes). Rows Produced: The number of new rows created y the query. Warehouse Size: The size of the warehouse in which the query executes. Query Type: The type of query based on operation performed (for example, Select query selects some data, Update query updates existing data). Database Name: The name of the database in which the query executed. Schema Name: The name of the database to which the query belongs to. Execution Time: The total time taken for the query to execute. Compilation Time: The total compilation time of the query. Partitions Scanned: The number of partitions scanned by the query. Partitions Total: The total number of available partitions. % Partitions Scanned: The percentile value of total scanned partitions: (partitions scanned/total partitions)*100. Error Code: The error code encountered during query execution (if any). Error Message: The error message received during query execution (if any). Queued Provisioning Time: The total queue provisioned time of the query. Queued Repair Time: The total queued repair time of the query. Queued Overload Time: The total queued overload time of the query. Transaction Blocked Time: The transaction blocked time of the query. Bytes Spilled to Remote Storage: The bytes of data stored by query on a remote storage location. Bytes Spilled to Local Storage: The bytes of data stored by query on a local storage location. |
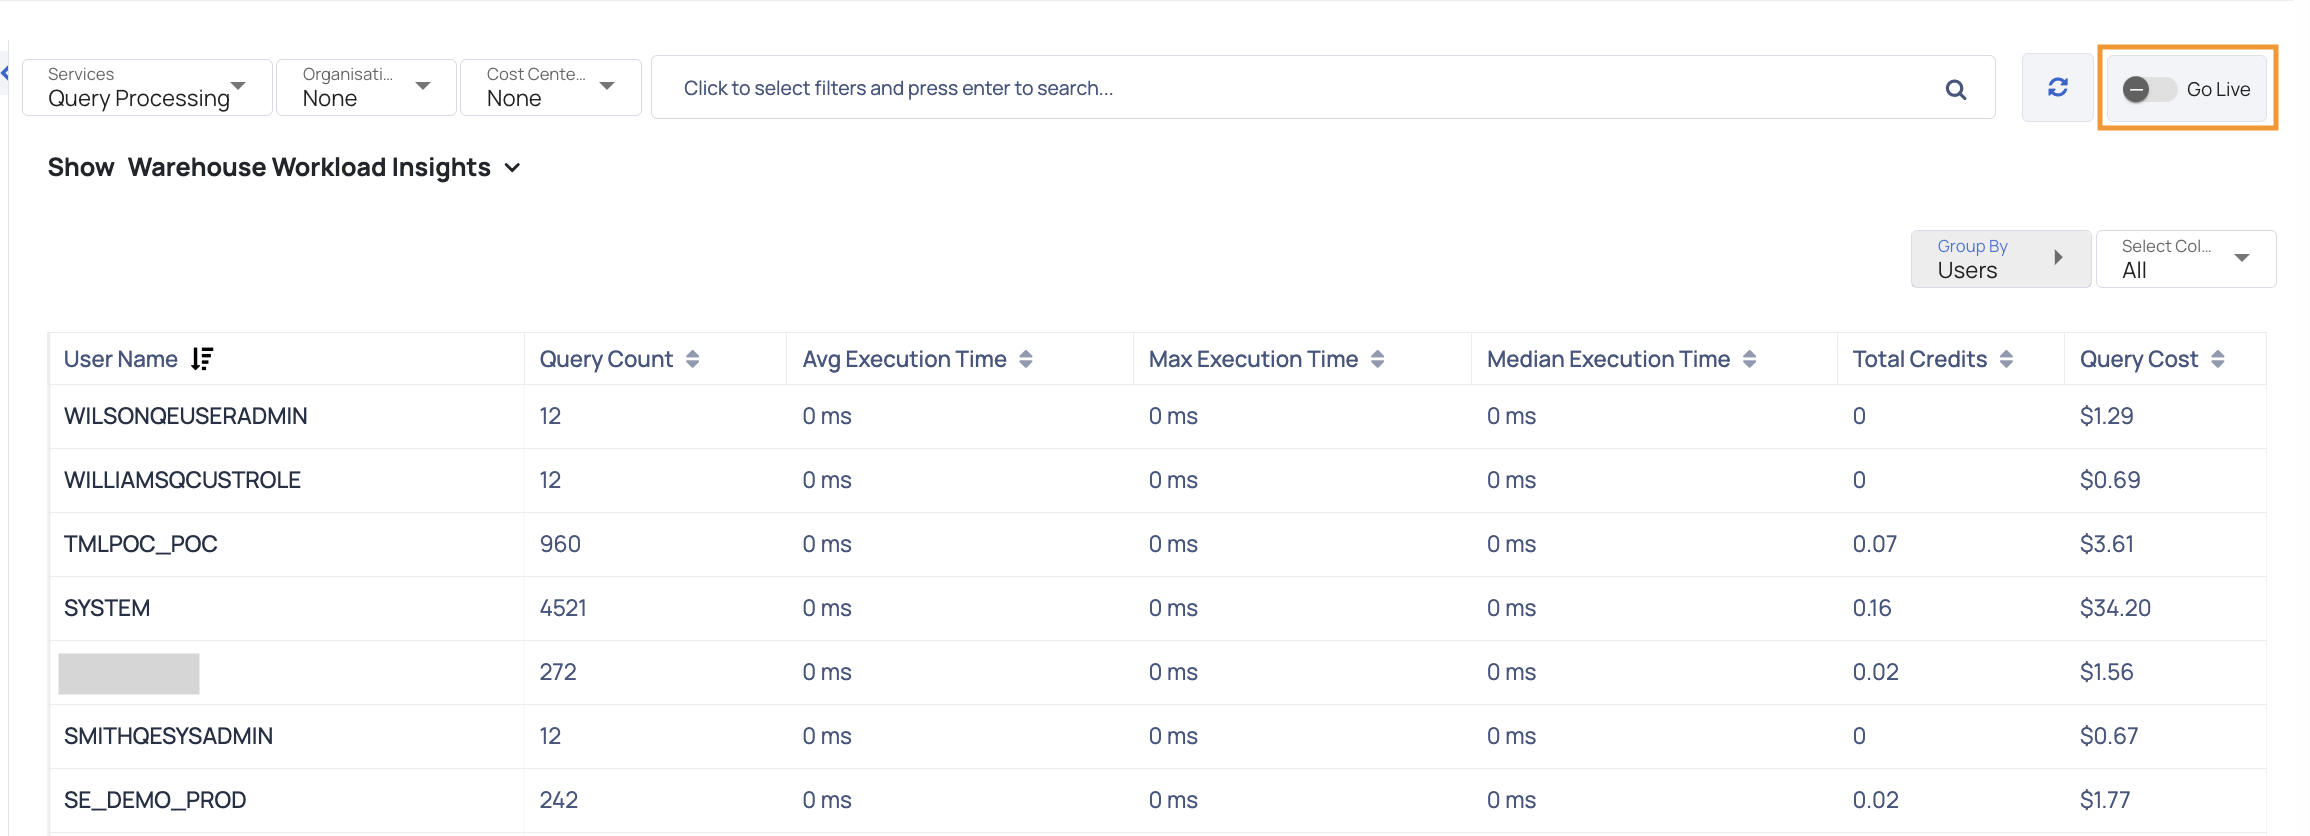
| Group By Users | This filter allows you to group by users displaying a table with the following columns: User Name: Displays the names of the users who have executed queries. It helps identify the individuals responsible for query executions. Query Count: The Query Count column showcases the total number of queries executed by each user within the specified grouping. It provides insights into the query workload of each user. Avg Execution Time: The Avg Execution Time column presents the mean duration taken by queries executed by a user. It offers an overview of the typical time taken for query completion. Max Execution Time: Max Execution Time shows the longest duration taken by any query executed by a user within the selected group. It highlights the maximum time taken for query execution. Median Execution Time: Max Execution Time shows the longest duration taken by any query executed by a user within the selected group. It highlights the maximum time taken for query execution. Total Credits: Total Credits column illustrates the cumulative credits consumed by a user for their query executions. It quantifies the overall resource consumption for each user's queries. Query Cost: The Query Cost column provides an approximation of the cost incurred by a user for their query executions. It offers an estimation of the monetary value associated with resource usage. |
Export Raw Data
You can download data as a CSV for the current page, with all applied filters accurately reflected. This ensures that the exported data matches your selected view and filter criteria.

Viewing Real Time Snowflake Data
ADOC allows you to view Snowflake data in real time. The Go Live toggle switch must be turned on.
When this toggle switch is turned on, real-time data from your Snowflake is presented.
When you enable the Go Live toggle switch, you can additionally specify how frequently you want data to be automatically refreshed. It is acquired from Snowflake. You can have the data refreshed every minute, every two minutes, or every five minutes.
When viewing Snowflake data in real time, you cannot apply filters.
Analyzing the Warehouse Response Time
Consider an initial value as your Warehouses' response time. This figure must be computed by taking into account a variety of parameters such as previous execution times when the workload was similar to what it is now, warehouse size, number of queries being executed, amount of data handled by the warehouse, and so on.
Once you calculate the initial value, perform the following steps:
One of the simplest activities to optimize your Snowflake costs is warehouse resizing. The cost of warehouses, warehouse response time, and warehouse workload are all considerations to consider while resizing. Because these factors are constantly changing based on the data pouring into your Snowflake account, warehouse resizing is not a one-time task. Warehouse resizing must be done on a regular basis to ensure cost savings as well as improved warehouse response time and workload.
- Navigate to the Query Studio page.
- Note down the 95th Percentile execution time for queries on the required warehouse.
Query Insights
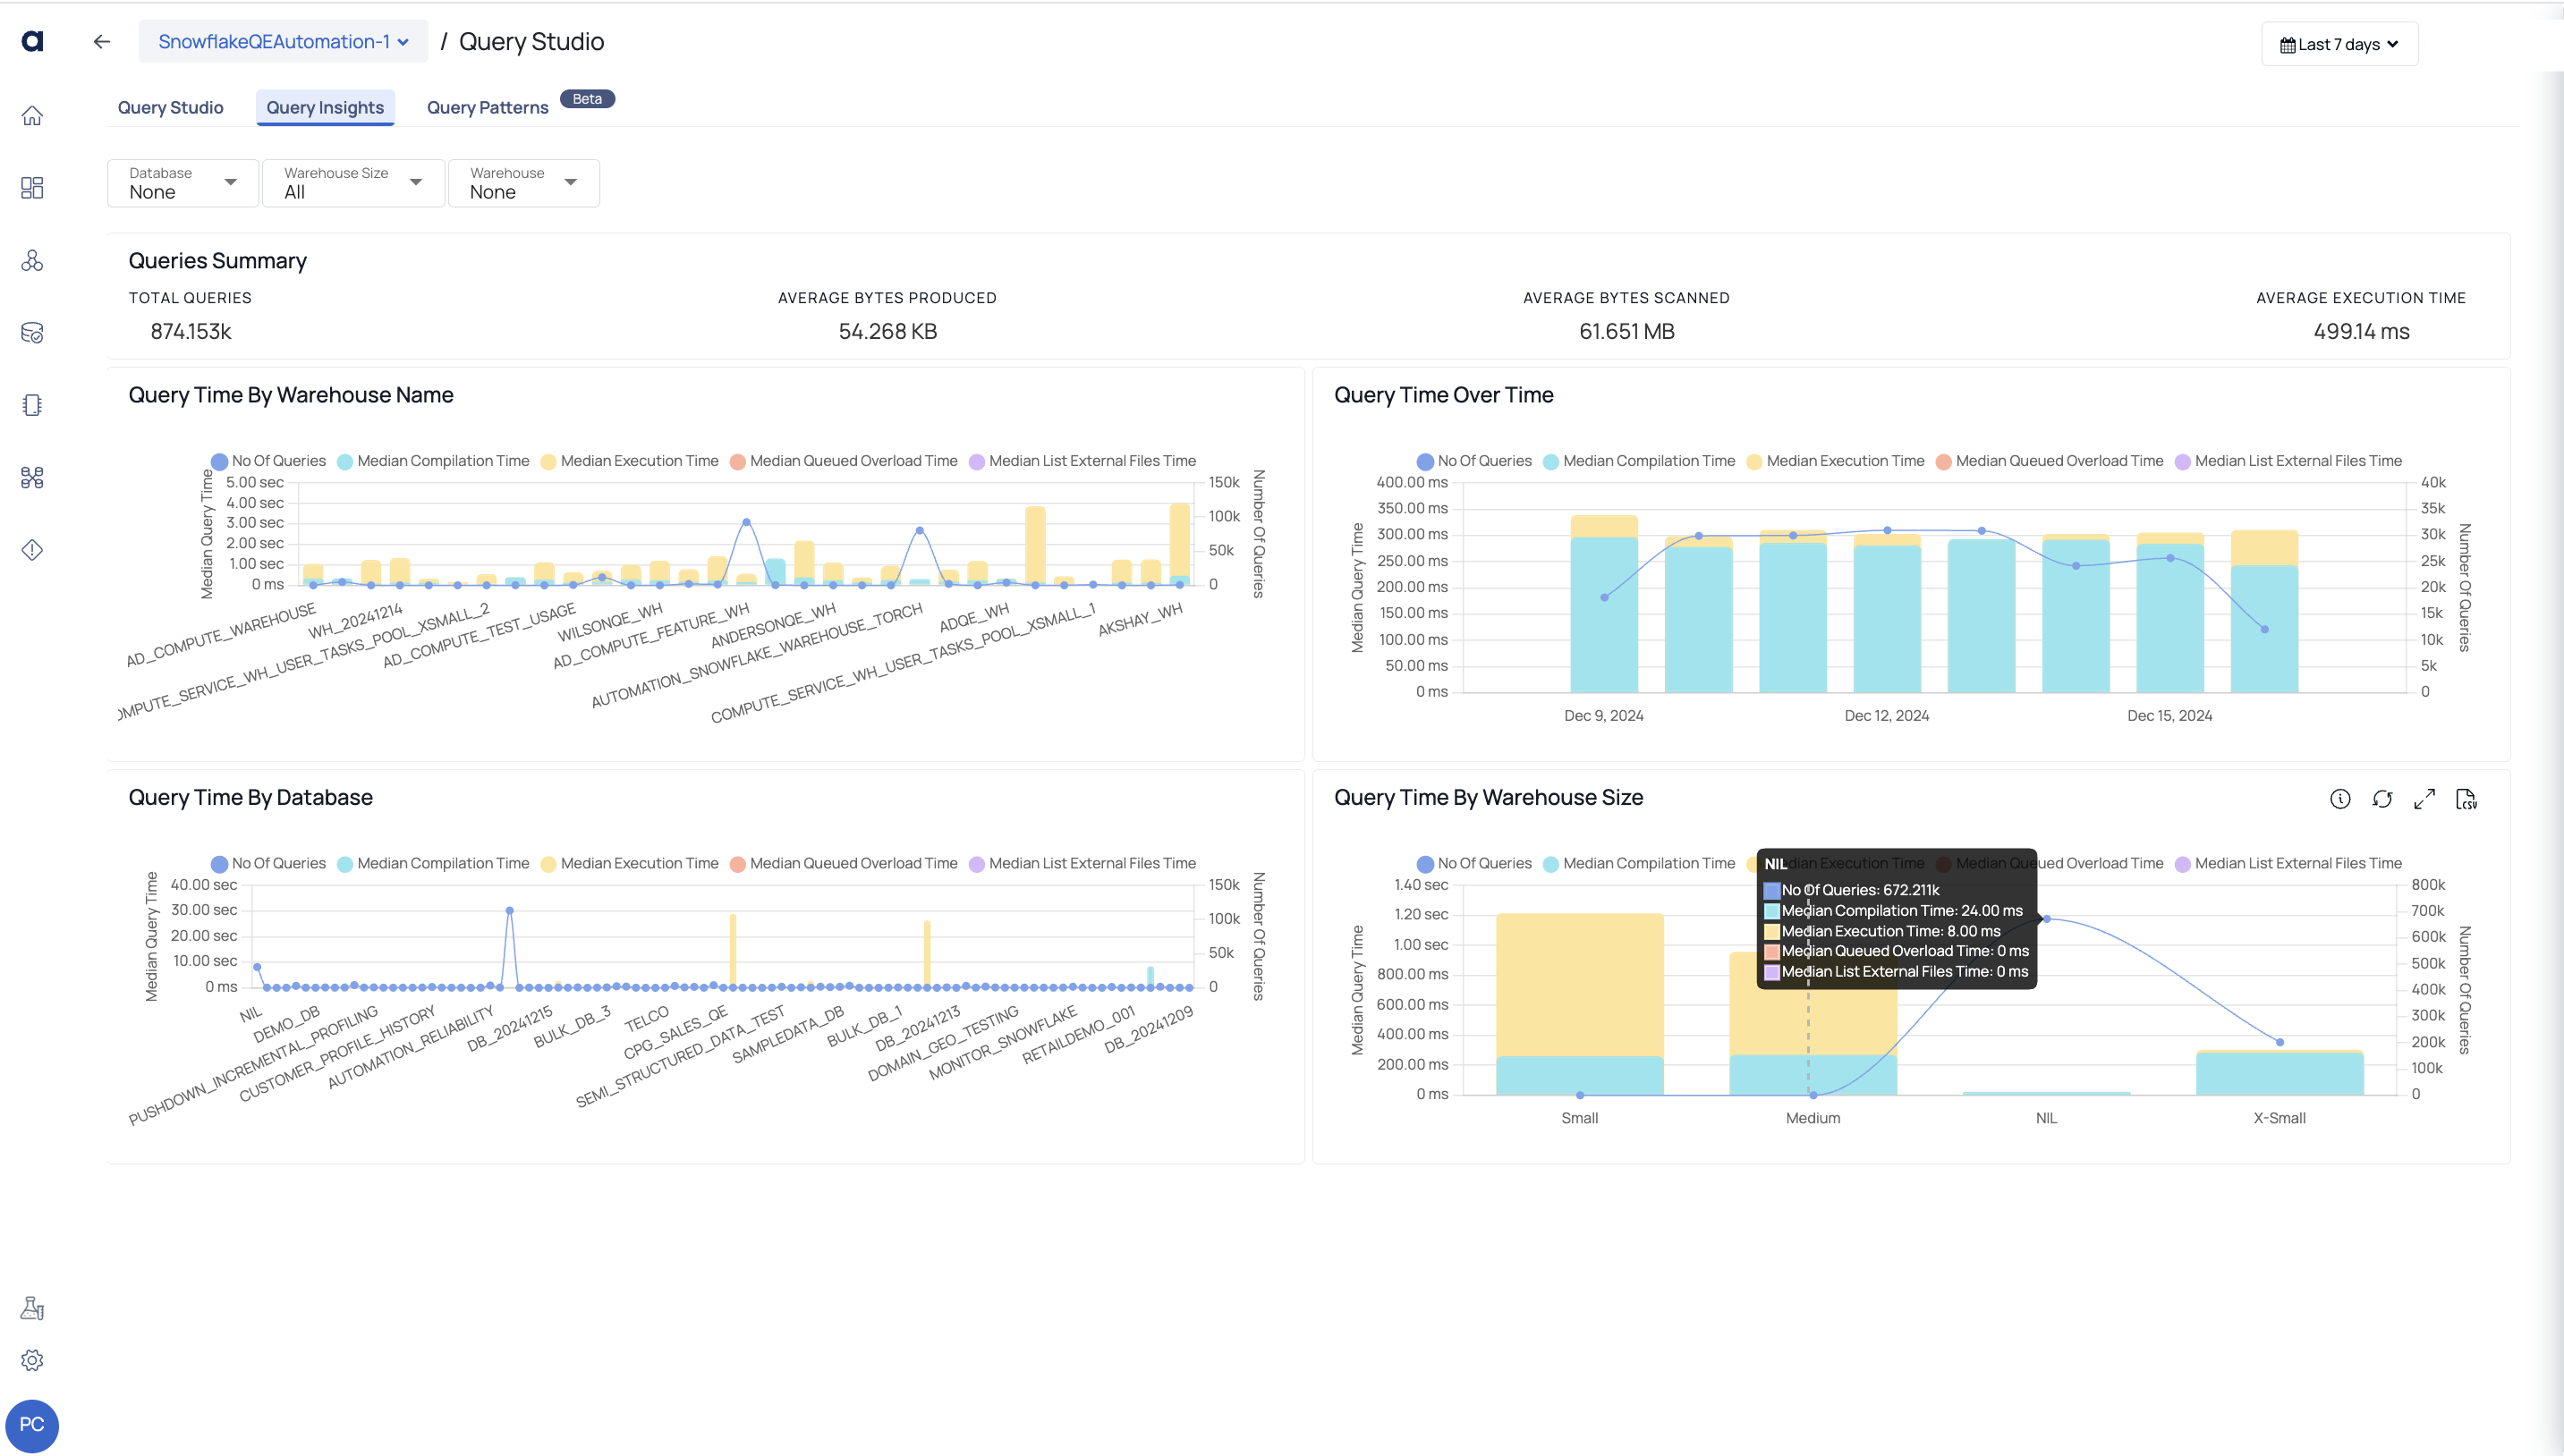
You can view critical information about Queries and Warehouses on this page.
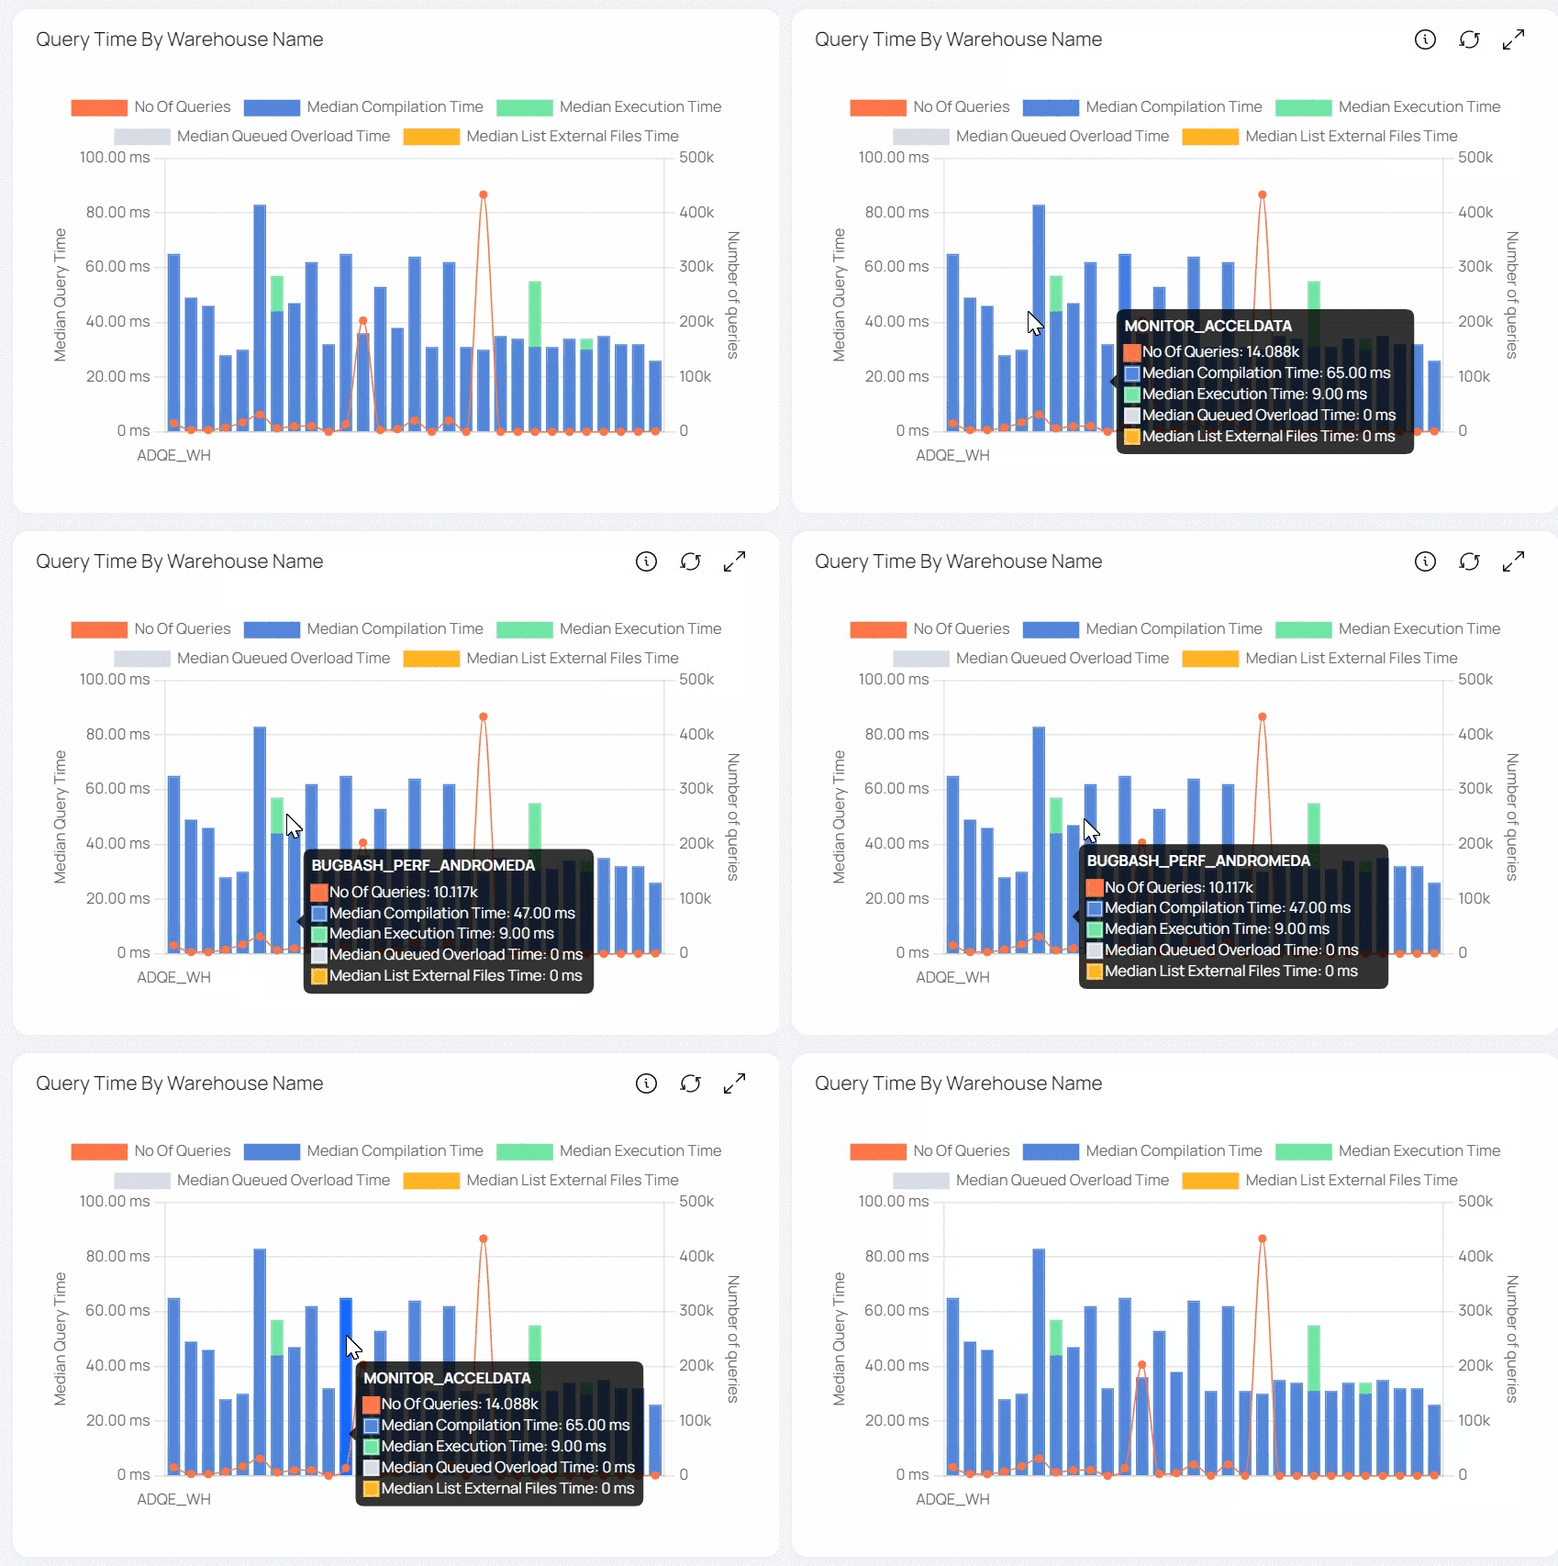
A Query execution consists of various levels. Compilation Time is the time taken by the Query to get compiled, execution time is the time taken by the query to get executed, and so on.
When you hove over a bar, you can view the number of queries executed on the Warehouse size and the median time spent by Query at each level such as compilation, execution and so on.
| Widgets | Description |
|---|---|
| Queries Summary | The Queries Summary provides an overview of query performance metrics, including the total number of queries executed, the amount of data processed, and the time taken to execute each query on average. Total Queries: This widget displays the total number of queries served during the selected time period. Average Bytes Produced: The average value of the total number of bytes transmitted on the network. Average Bytes Scanned: The average value of the total number of bytes scanned. Average Execution Time: The average of total execution time for all the queries. |
| Query Time by Warehouse Name | This bar graph shows the median value of various execution timings (median compilation time, median execution time, and so on) for all queries across all Warehouses. The list of Warehouses is determined by the filters set in the filters section. The warehouse names are displayed on the x axis. The y axis represents the median value of query execution time (left) and query count (right). Each bar symbolizes a Warehouse and is colored differently. Each color reflects the median value of a query execution time (e.g., median compilation time, median execution time, etc.). This bar graph also includes a trend line that shows the number of searches processed. |
| Query Time Over Time | This bar graph shows the median value of various execution times (e.g., median compilation time, median execution time, and so on) for all queries at various time intervals. The time interval is determined by the filters used in the Global Calendar. The date and time are displayed on the x axis. The y axis represents the median value of query execution time (left) and query count (right). Each bar indicates a Date and Time and is colored differently. Each color reflects the median value of a query execution time (e.g., median compilation time, median execution time, etc.). This bar graph also includes a trend line that shows the number of searches processed. |
| Query Time by Database | This bar graph shows the median compilation, execution, and other execution times for all queries on different databases. The filters section determines the database list. The x-axis shows Database names. The y axis shows the median query execution time (left) and number of inquiries (right). Multiple colors represent Databases on each bar. Each color reflects the median query execution time (compilation, execution, etc.). A trend line shows the number of requests in this bar graph. |
| Query Time by Warehouse Size | The bar graph displays the median value of query execution times for various Warehouse sizes, including x-small, small, medium, and large. The x-axis displays Warehouse size names, while the y-axis displays median execution time and query execution time. The graph also features a trend line displaying the number of queries executed. |
Query Patterns (Beta)
ADOC offers enhanced capabilities for analyzing query performance, particularly when examining any type of query like Top 50 expensive queries, To 50 long running queries and more. Previously, you could only access a list of queries, but now you can delve deeper into specific query issues related to particular columns. This functionality is accessible through the Query Patterns tab, where you can explore the percentage of usage for Group by or Table Join statements. This beta feature provides valuable insights that facilitate optimization efforts. By taking action based on these insights, you can identify and address potential performance bottlenecks related to specific columns.
Additionally, you can click on a table to navigate to its Details page, where you can access additional metadata and clustering information.
This comprehensive view enables you to make informed decisions and implement targeted optimizations to maximize query efficiency and overall system performance.
Query Advisor
The Query Advisor is an AI-powered tool that analyzes and optimizes SQL queries. It identifies inefficiencies in query execution, provides recommendations for optimization, and predicts potential performance improvements. By leveraging these insights, you can enhance the efficiency of the SQL queries and improve overall system performance.
Inefficient queries can significantly impact the performance on Snowflake. Common issues identified in poorly optimized queries include expensive execution, prolonged execution times, high data scan volumes, and a lack of adherence to best practices. The Query Advisor addresses these problems by offering targeted recommendations to improve query performance and ensure optimal resource utilization.
Navigating to the Query Advisor
- Go to Compute.
- Select any Snowflake data source.
- Click on Query Studio.
- Select a query from Query Studio, which will take you to the Query Details page.
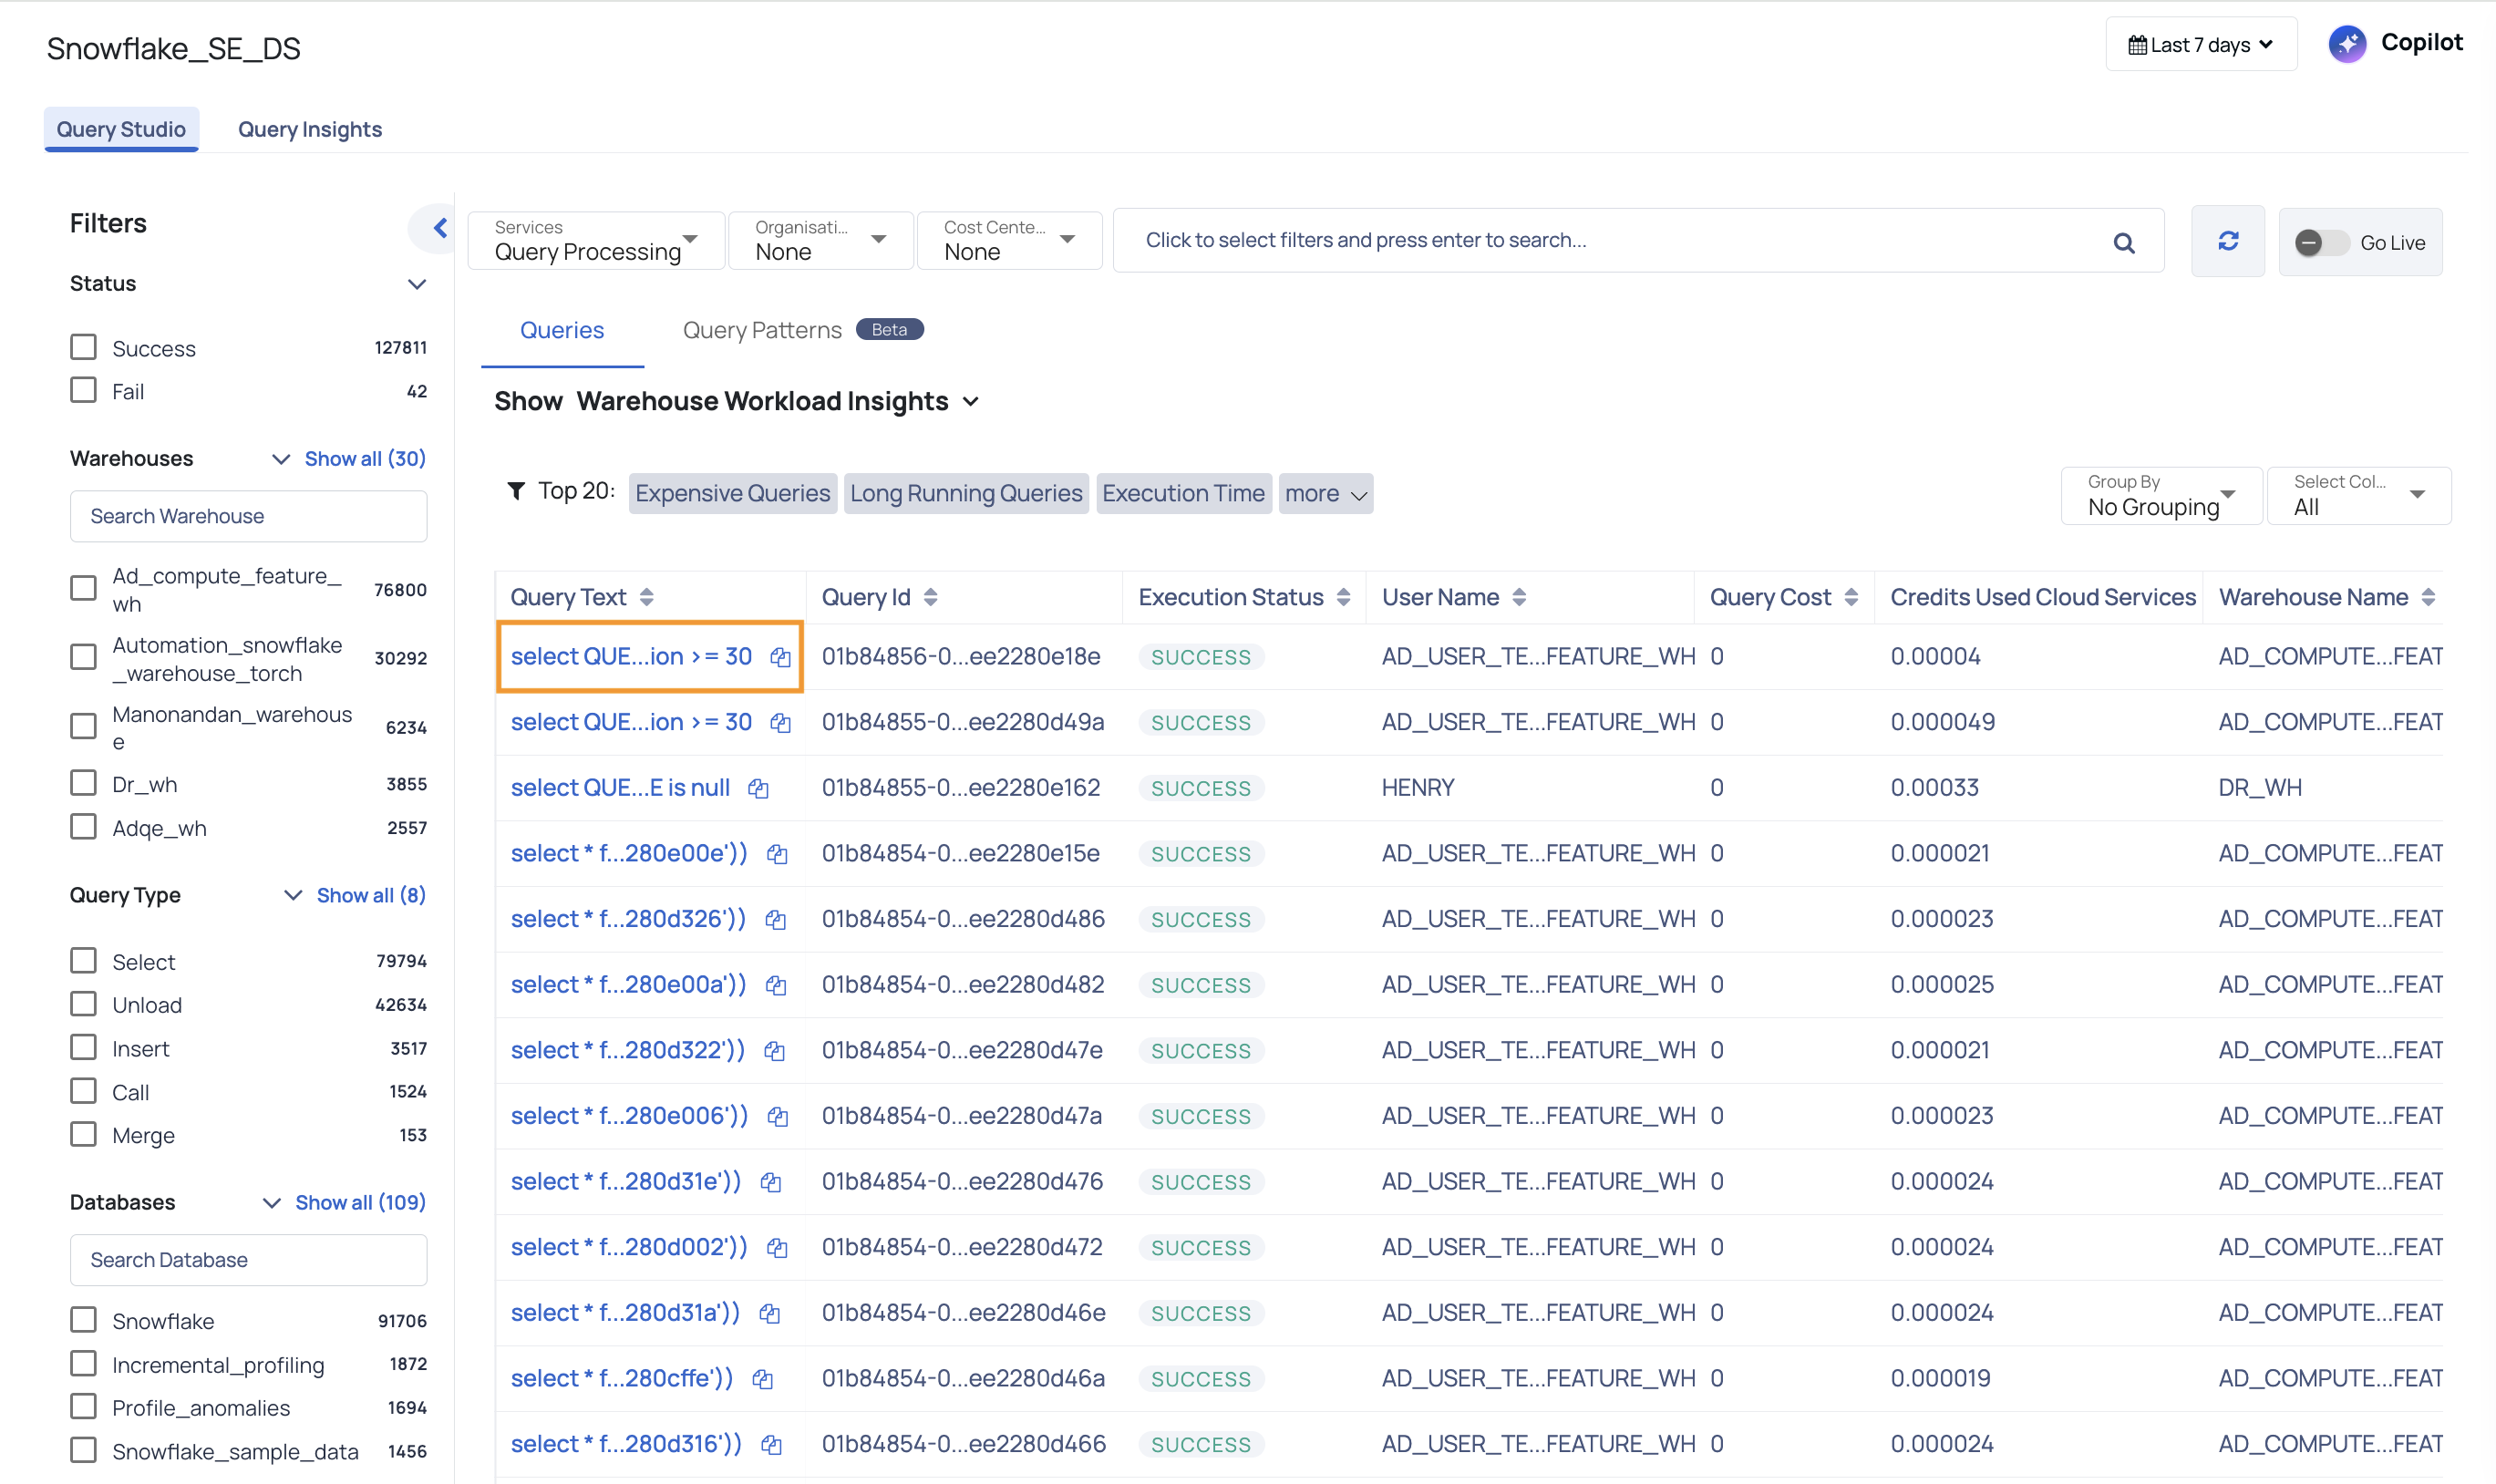
Once you navigate to the Query Details page, a detailed breakdown of the query's performance and potential areas for optimization in the Query Advisor section, is displayed. The interface provides the following key components:
- Original Query Text: Displays the full SQL query being analyzed. This helps you easily review the structure and syntax of the query for potential inefficiencies.
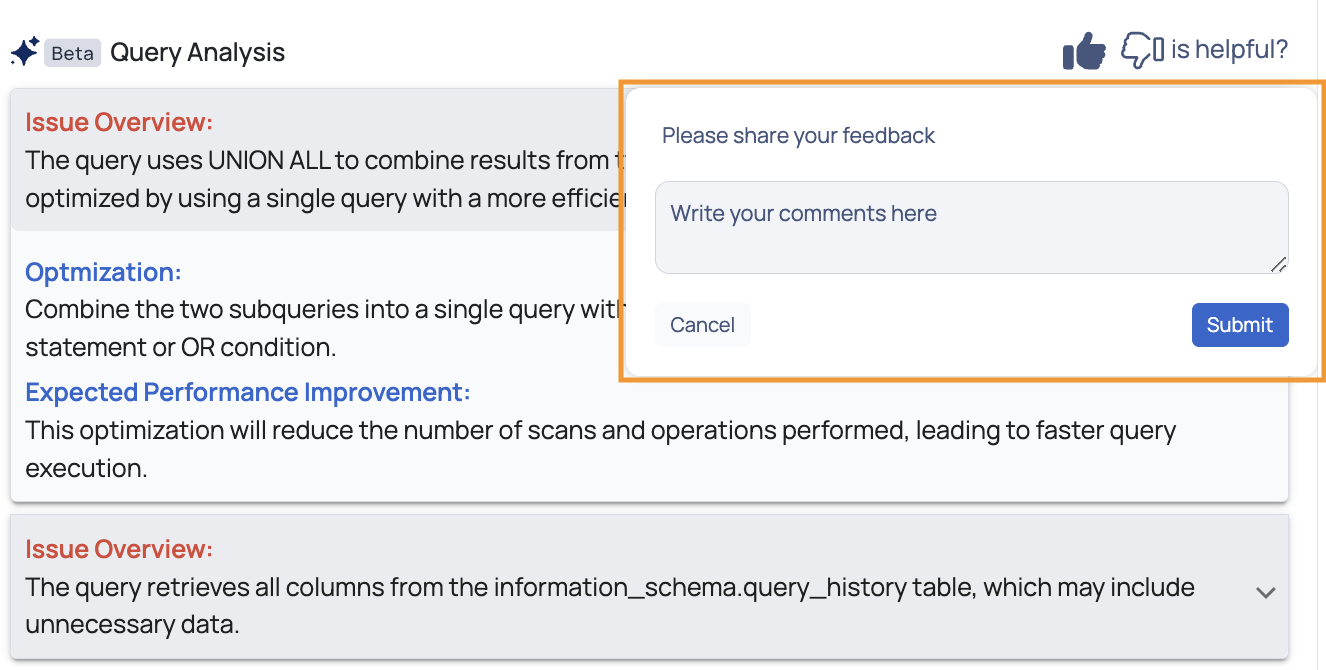
- Query Analysis: The Query Advisor identifies specific performance issues and provides recommendations for improvement. These include:
- Issue Overview: Summarizes inefficiencies found in the query, pointing out areas where query performance may be impacted.
- Optimization Recommendations: Suggests specific actions to enhance query efficiency, such as simplifying logic or reducing resource usage.
- Expected Performance Improvement: The tool provides an estimate of the performance gains that can be achieved by applying the recommended optimizations.
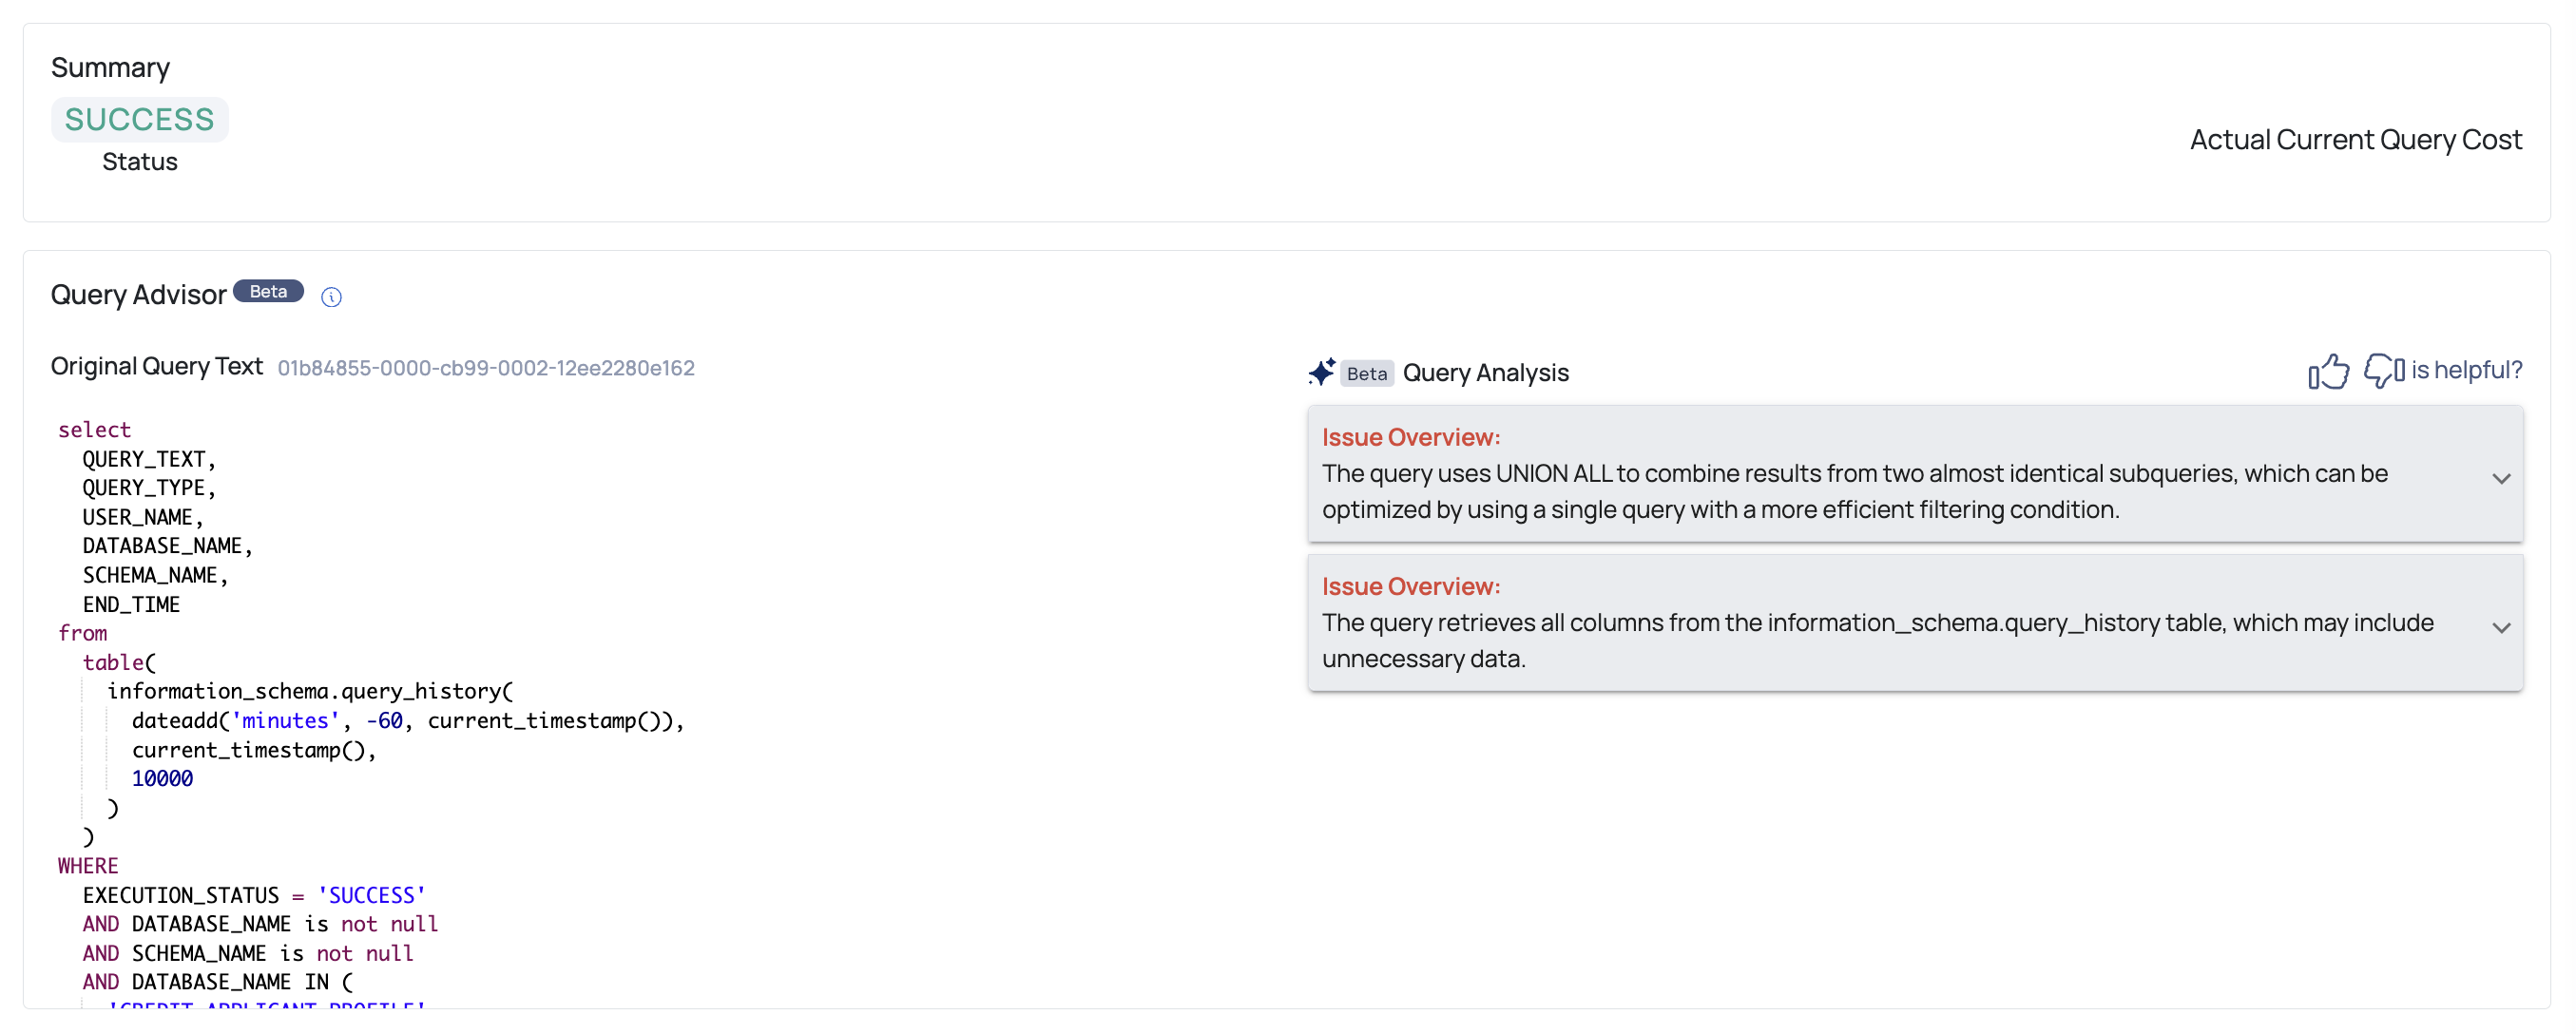
The Query Advisor includes a feedback option for you to evaluate the relevance of the analysis and recommendations provided. You can click on thumbs-up or thumbs-down icons to indicate whether the insights were helpful. Add your comments and click the Submit button.

