Snowflake Data Ingestion
The Data Ingestion section provides enhanced monitoring capabilities for Snowflake ingestion workflows using Snowpipe. This feature improves visibility by consolidating Snowpipe and data loading insights, offering admins an efficient way to monitor data loads, detect delays or failures, and optimize resource usage. With new widgets, dashboards, and a reorganization of existing ones, this update ensures that critical data pipelines are more reliable and easier to manage.
Why Data Ingestion Monitoring?
Data Ingestion monitoring is essential for maintaining the health and efficiency of Snowflake data pipelines. By centralizing and enhancing insights, platform admins can proactively address issues like delays or failures, optimize resource utilization, and ensure the overall reliability of ingestion workflows. This feature reduces the complexity of monitoring scattered data load information, providing a more streamlined and actionable view for better data management and performance.
Navigating to Data Ingestion
- Navigate to the Compute Section and select the Data Ingestion page.
- Choose a data source from the drop-down in the top-left corner to view its data ingestion details.
Data Ingestion
The Data Ingestion section offers a comprehensive view of the data load process, with a focus on Data Load and Cost Analytics. You can seamlessly navigate between various tabs to analyze cost breakdowns, identify inefficiencies, and track resource usage. The interactive design allows you to explore different metrics, such as load times and associated costs, offering valuable insights into optimization opportunities. Additional features, like filtering by time periods or specific datasets, empower you to refine your analysis and make informed decisions. This view is crafted to help you understand the cost dynamics within your data ingestion workflows effectively.
Data Load Tab

Data Load Tab
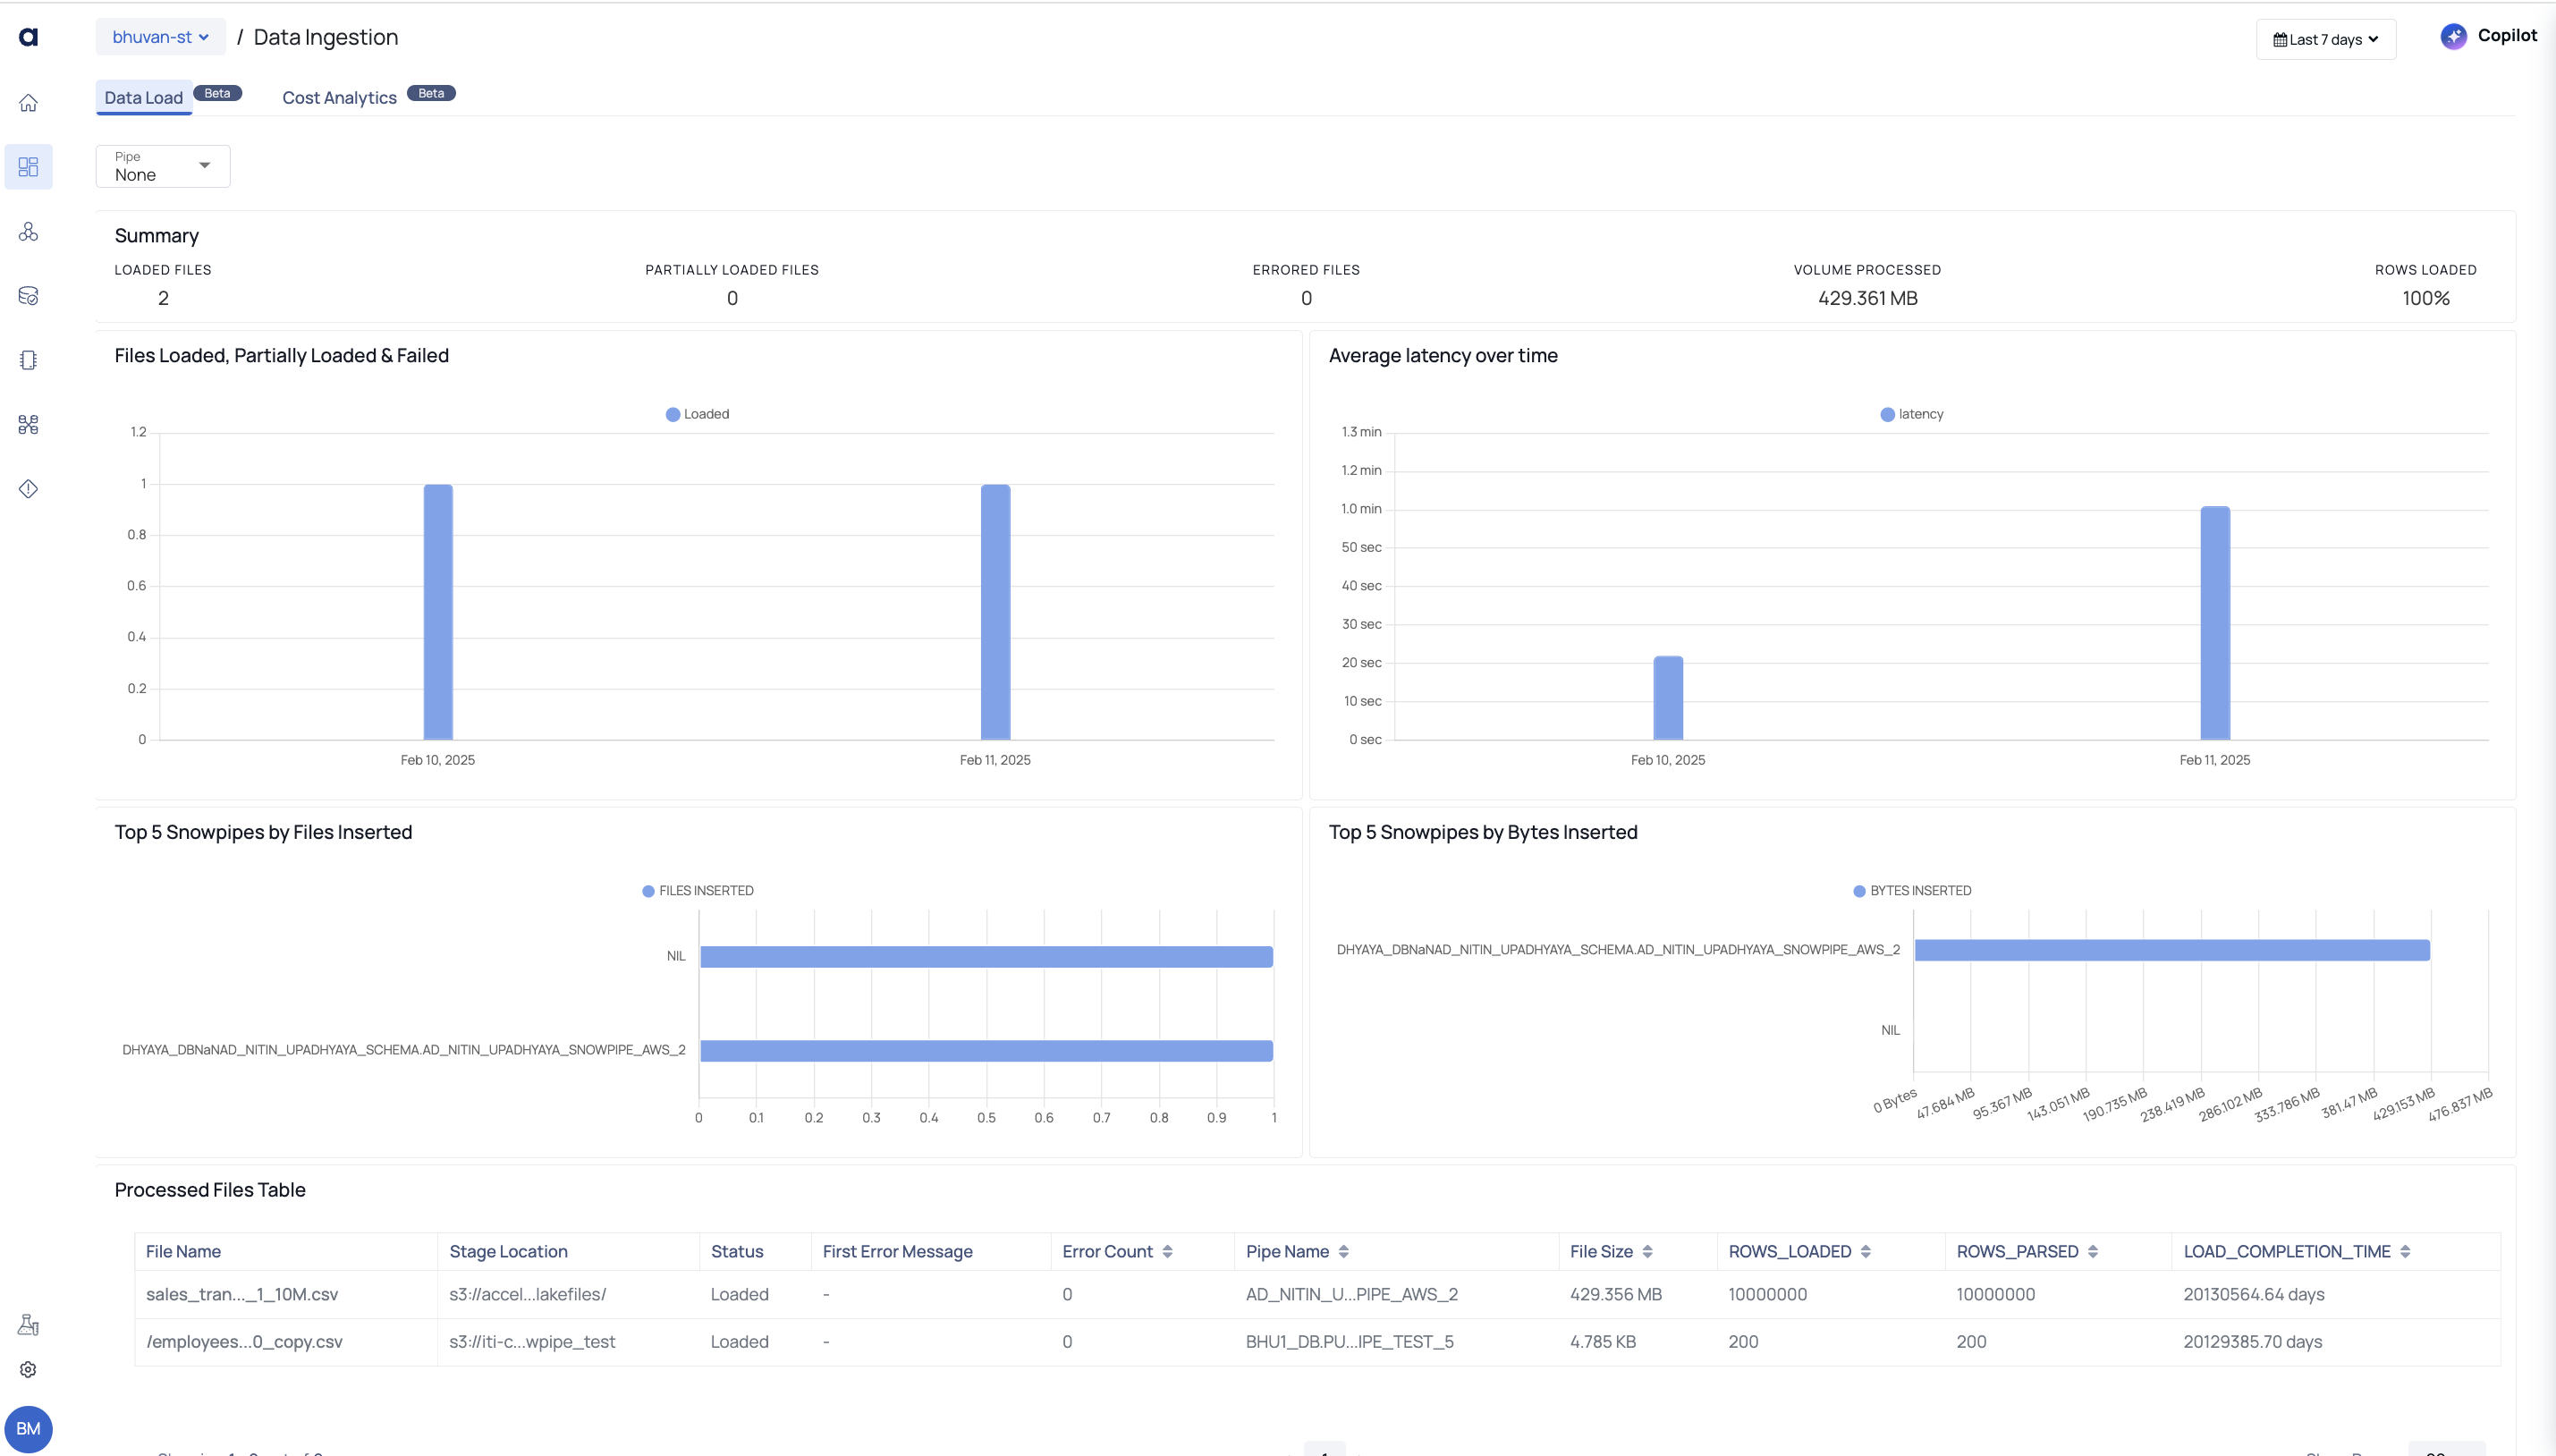
The Data Load tab provides insights into the data ingestion process, tracking file statuses, latency trends, and Snowpipe efficiency. It helps users monitor ingestion performance by displaying key metrics such as loaded, partially loaded, and failed files, along with processed data volume. Below is a breakdown of key components:
| Component | Description |
|---|---|
| Summary | Displays the total number of loaded files, partially loaded files, and errored files. Shows the volume processed and rows loaded percentage to provide a quick overview of ingestion performance. |
| Files Loaded, Partially Loaded & Failed | Tracks the number of successfully loaded, partially loaded, and failed files over time to monitor ingestion efficiency. |
| Average Latency Over Time | Displays the time taken for data ingestion(from snowpipe submission to data load completion), helping identify performance bottlenecks. |
| Top 5 Snowpipes by Files Inserted | Lists the most active Snowpipes based on the number of files inserted, indicating ingestion activity. |
| Top 5 Snowpipes by Bytes Inserted | Highlights Snowpipes that have processed the highest data volume, showing pipeline efficiency. |
| Processed Files Table | Provides details of ingested files, including stage location, size, error count, and processing status. |
Cost Analytics Tab
Cost Analytics Tab
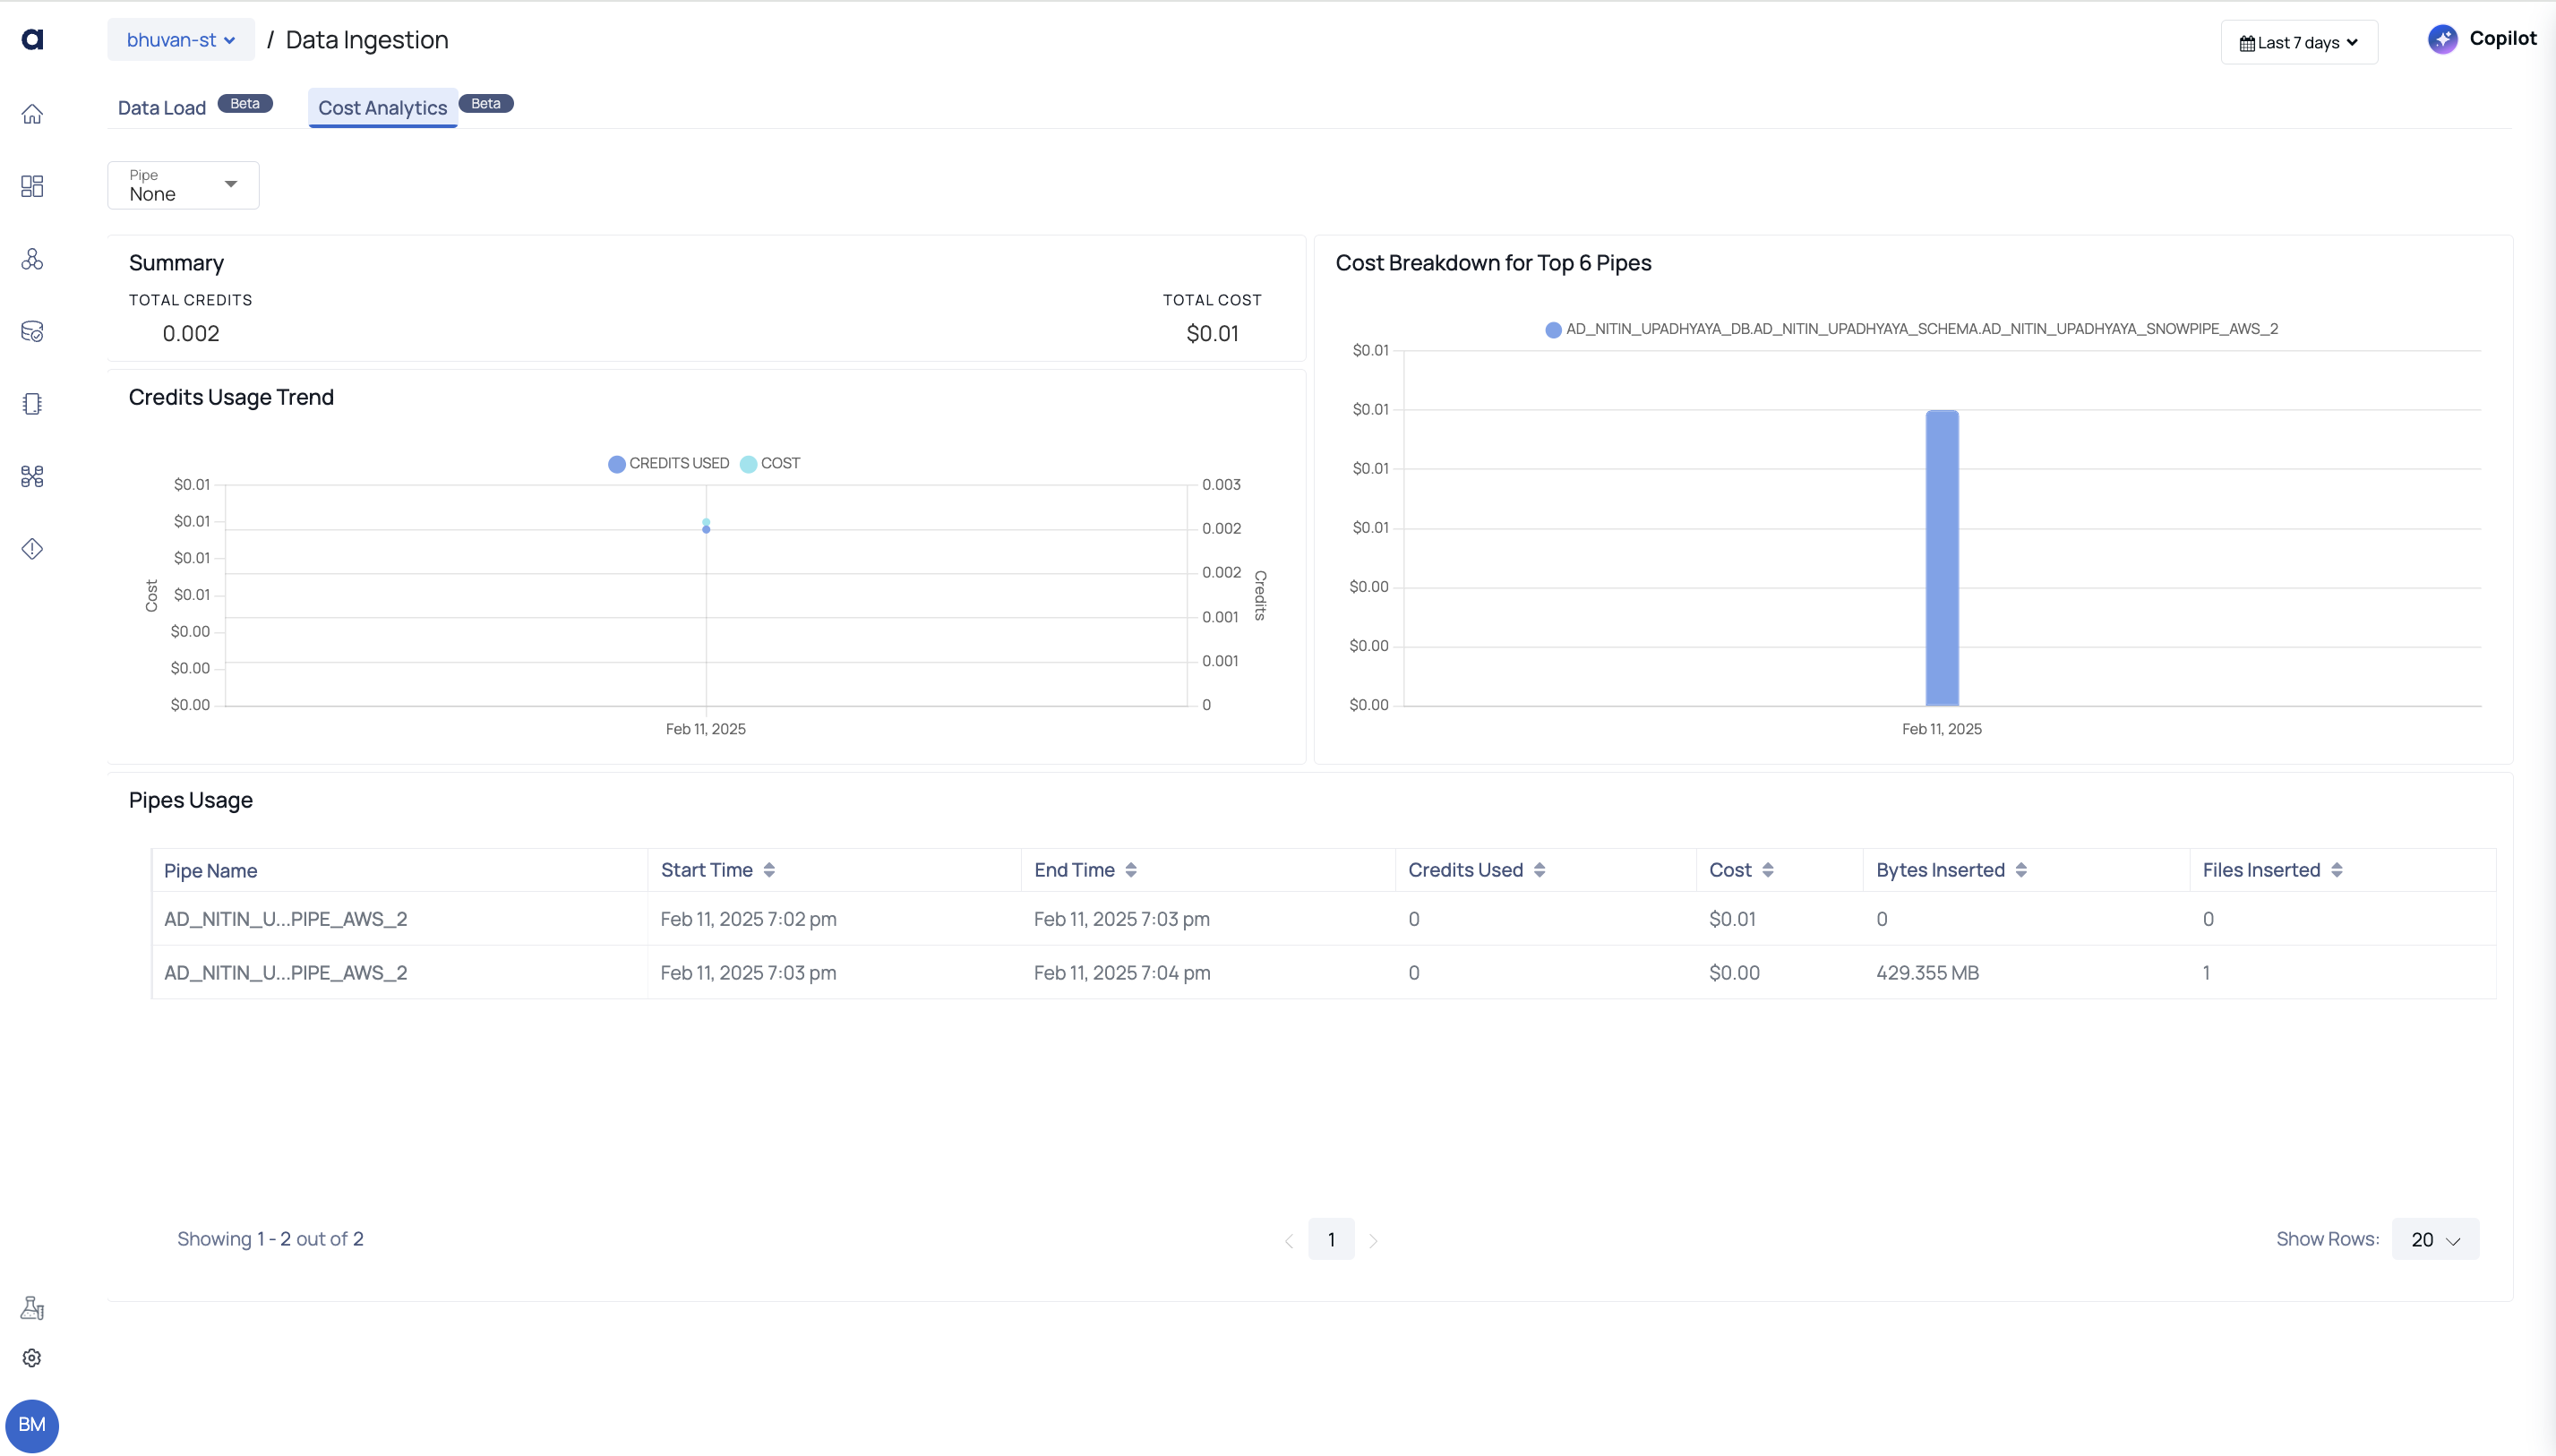
The Cost Analytics tab focuses on the financial impact of data ingestion, highlighting credit consumption, cost trends, and the most resource-intensive pipelines. Below is a breakdown of key components:
| Component Name | Description |
|---|---|
| Credits Usage Trend | Visualizes the consumption of credits over time, showing cost variations. |
| Cost Breakdown for Top 6 Pipes | Analyzes cost distribution among the most resource-intensive pipelines to aid in cost optimization. |
| Pipes Usage | Displays detailed usage metrics of individual pipelines, including start time, end time, and credit consumption. |