Kafka Brokers
The Brokers page displays summary of usage of brokers in a selected cluster.
Clusters
This tab displays the list of clusters currently connected. Broker metrics are displayed for each cluster. Click a cluster name to view the associated metrics.
Capacity Planning
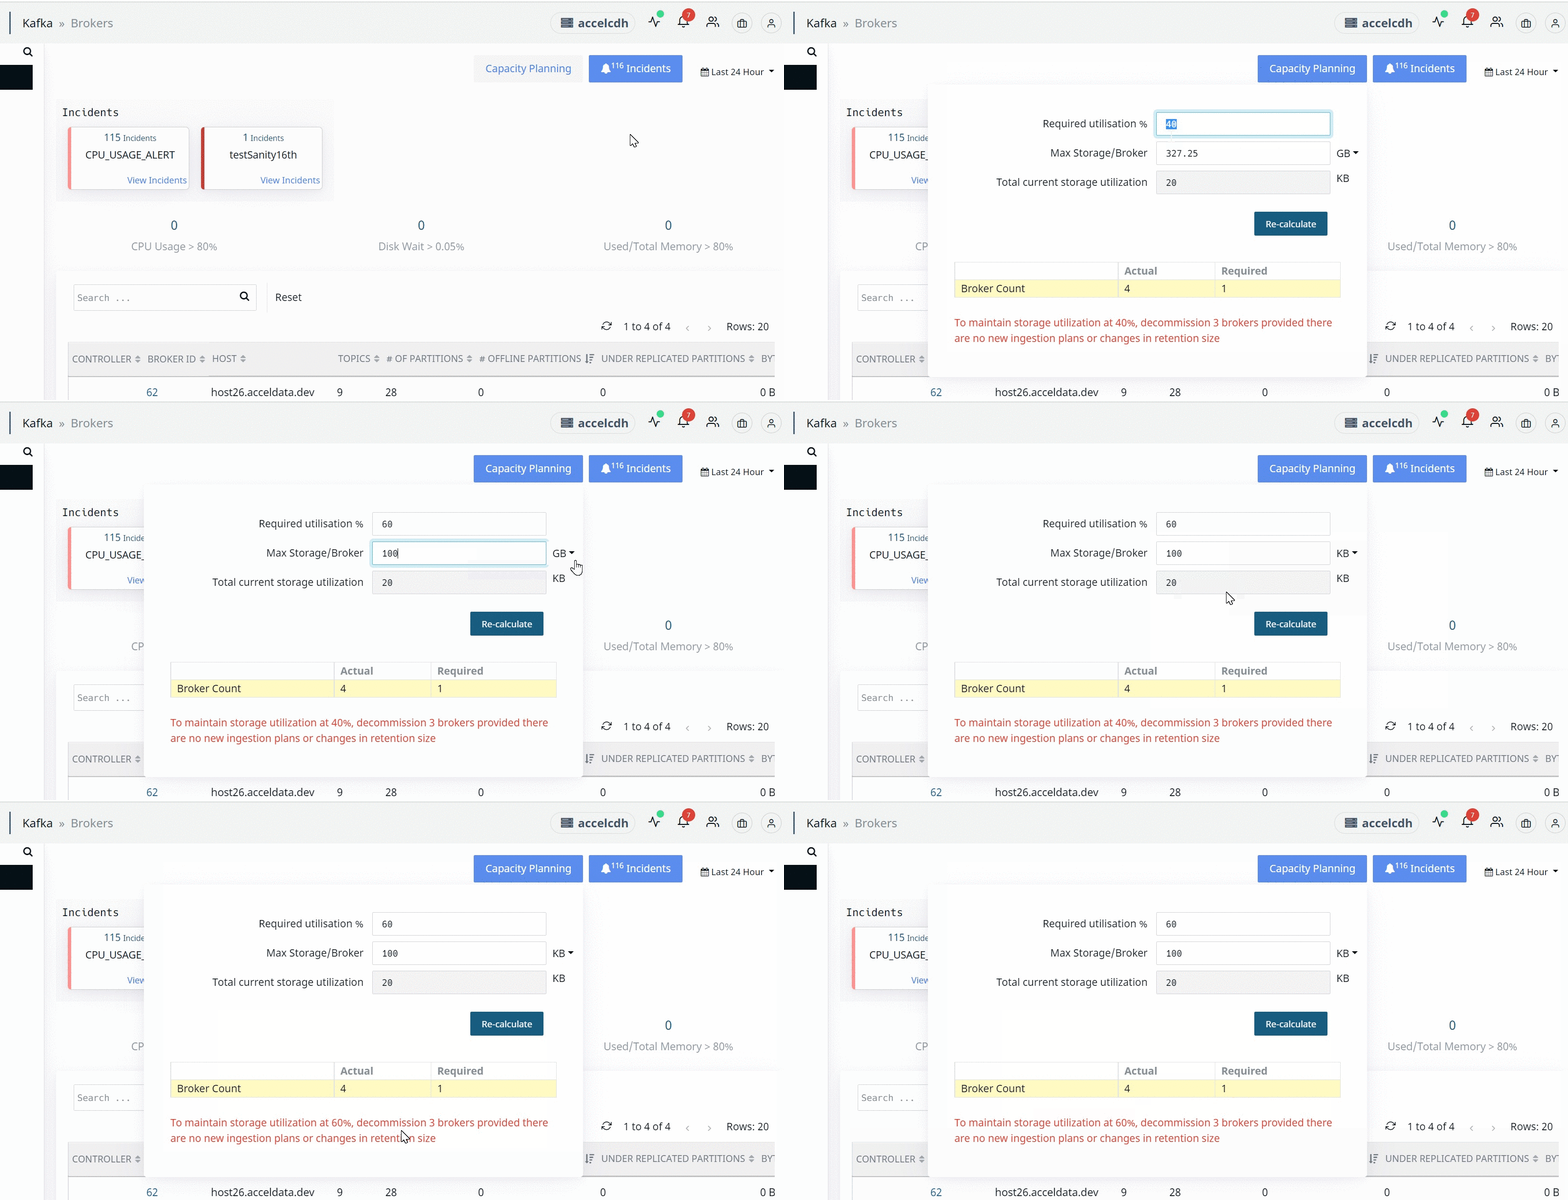
This panel suggests the number of Kafka brokers required to maintain the total memory usage at the required level. You can provide the following data to get the required number of brokers.
- Desired amount of memory to be utilized (in percentage), out of the total available memory.
- Maximum storage capacity of each broker.
Based on the above values, Pulse calculates the required number of brokers to maintain the memory utilization at the desired level, by the following method.
- Current live Brokers used - Denoted by N
- Total memory currently used - Denoted by T
- Max storage capacity of each Broker (to be provided by you) - Denoted by M
- Required memory to be utilized (to be provided by you, in percentage) - Denoted by X (by default, this value is 40%).
To calculate the required number of brokers (denoted by C), the formula is :
C = Ceiling{T *100 / (M*X)}
Based on the value of C, the following suggestions are made:
- If C > N, Pulse suggests you to add C-N brokers, to maintain the memory usage at X level.
- If C=N, Pulse suggests that you are need not add or remove any brokers to maintain the memory usage at X level.
- If C > N, Pulse suggests you to decommission N-C brokers to maintain the memory usage at X level.
Incidents
This panel displays the alerts related to:
- CPU
- Disk
- Network
- System
- Memory
- Kernel Log
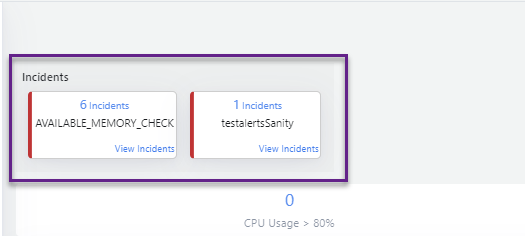
Follow the steps to view and act on the incidents:
- Click View Incidents on the incident card to view the details of the alert. The incident details are displayed.

- After verifying the incident, click Clear to remove it.
- To view the incident in detail, click the corresponding host URL to view the Details and Alerts tabs. These describe the incident in detail.
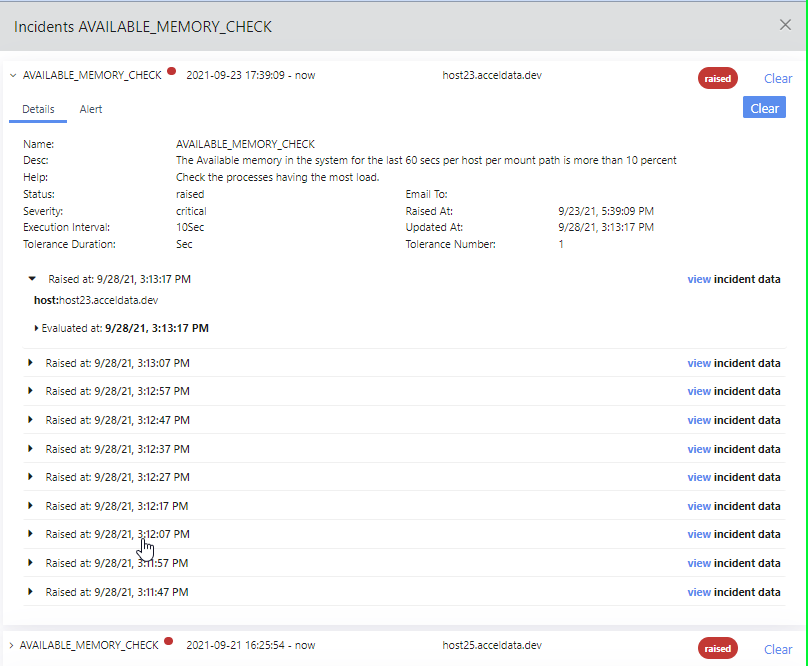
- Click
to close the alert information.
Summary Panel
This panel displays the following metrics depending upon the broker usage.
Click any metric to display the list of associated brokers.
| Metric | Description |
|---|---|
| CPU Usage > 80% | The list of brokers consuming more than 80% of CPU. |
| Disk Wait > 0.05% | The list of brokers leading the CPU wait more than 0.05% of the time for a thread to become available for disk read/write operations. |
| Used/Total Memory > 80% | The brokers whose associated nodes use more than 80% of the capacity. |
Charts in the Brokers Page
| Chart Name | Description |
|---|---|
| Leader Imbalance Ratio | This chart displays the leader imbalance ratio for each Kafka broker. The leader imbalance ratio for a broker is the ratio between the current number of partitions for which the broker is the current leader, and the number of partitions for which it is the preferred leader. |
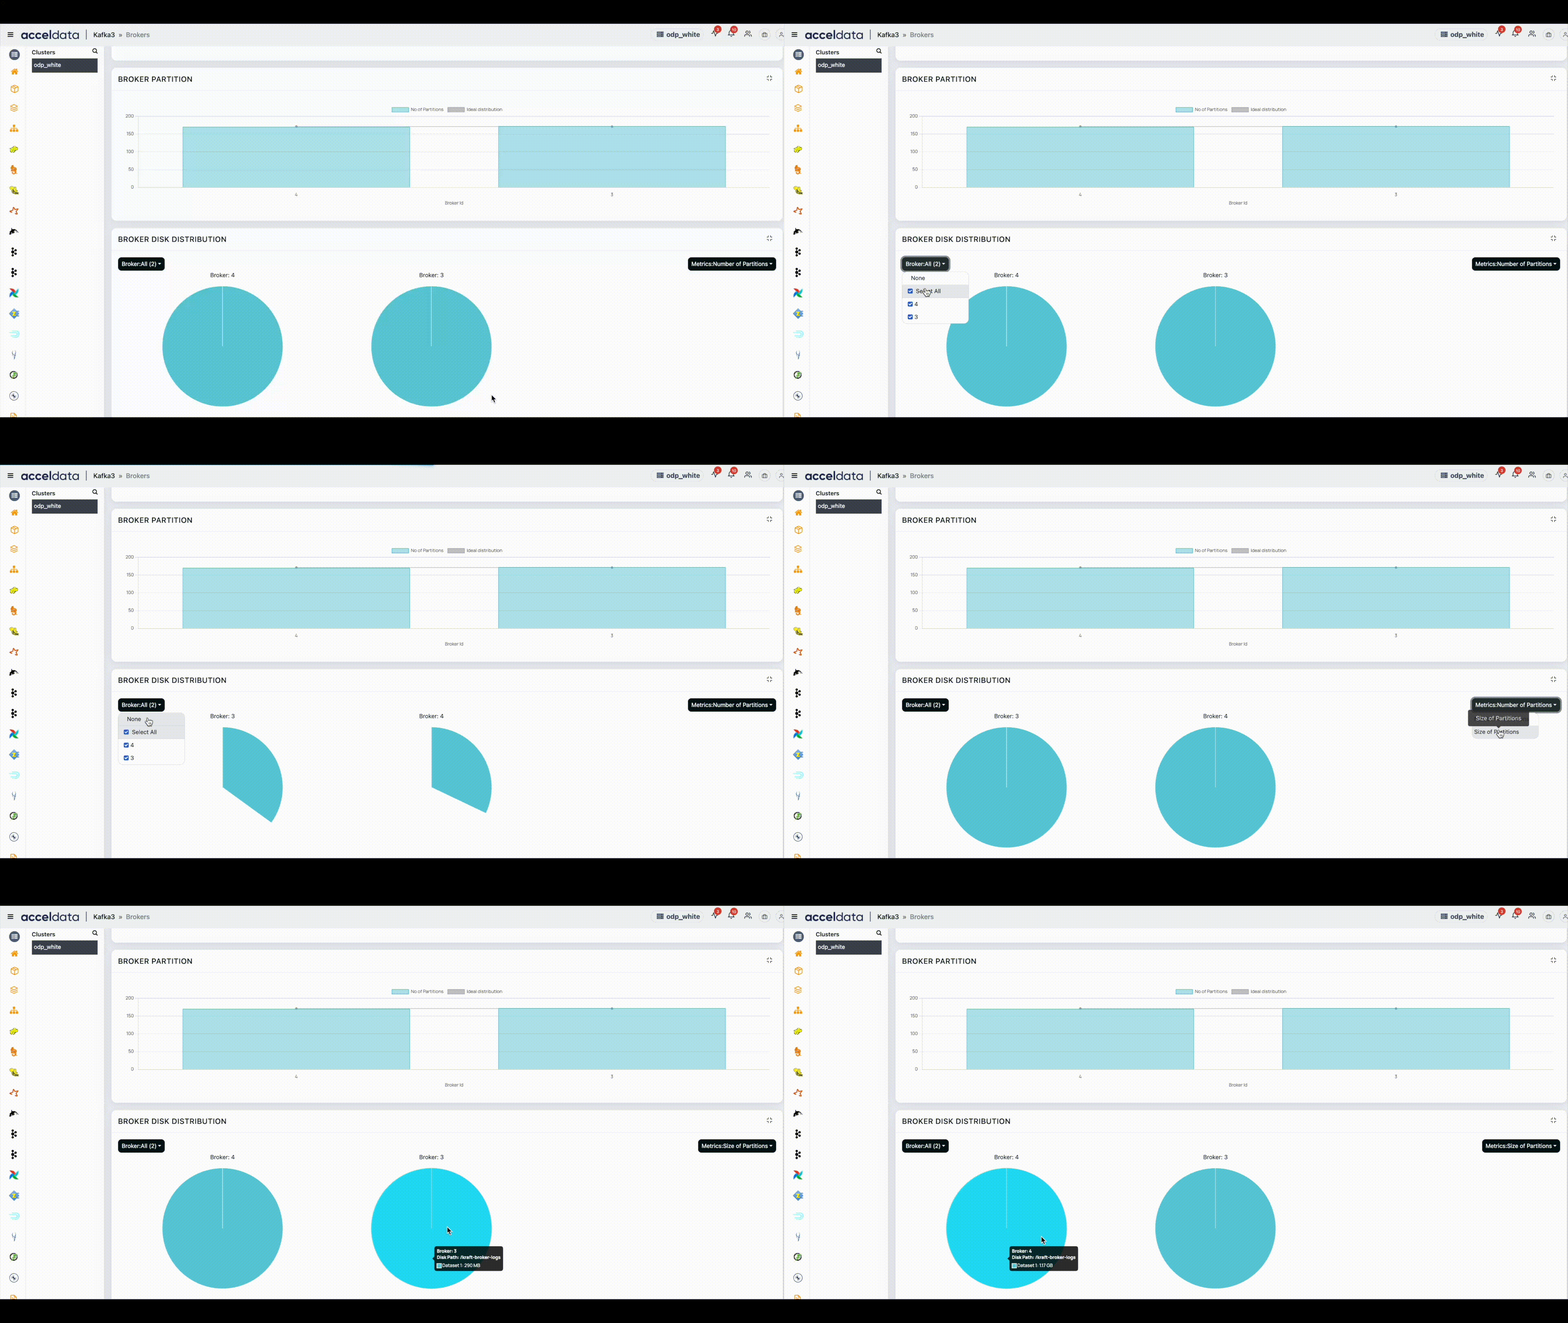
| Broker Partition | The bar chart displays the number of disk partitions for a particular broker ID. |
| Broker Disk Distribution | The pie chart displays the number of disks, number of partitions in the disk, and the size of the respective disk partition for a particular broker ID. |
Broker Metrics
The following metrics are displayed for each broker of the selected cluster.
Click any broker in the list to view more details about that broker.
| Metric | Description |
|---|---|
| Controller | The controller that is currently active in the kafka cluster. One broker is elected as the active controller within the brokers group. The active broker has a tick mark against the associated record. |
| Broker ID | The ID of the broker in the Kafka cluster. |
| Host | The name of the host in the cluster. |
| Topics | The number of topics in the broker. |
| # of Partitions | The number of partitions. |
| # of Leaders | The number of elected leaders in the partition. |
| Under Replicated Partitions | The number of under replicated partitions in the Kafka cluster. |
| Bytes In/Out | Amount of incoming and outgoing data. |
| Request Handler Idle Ratio | Ratio of time or fraction of time at which the request handler is idle. The values can be 0 or 1 or any value between 0 and 1. 0 represents that no resources are available to use and 1 represents that all resources are available. |
| Status | The state of the broker, whether active or inactive. 1: Click 2: Click OK_. _This deletes the broker. |
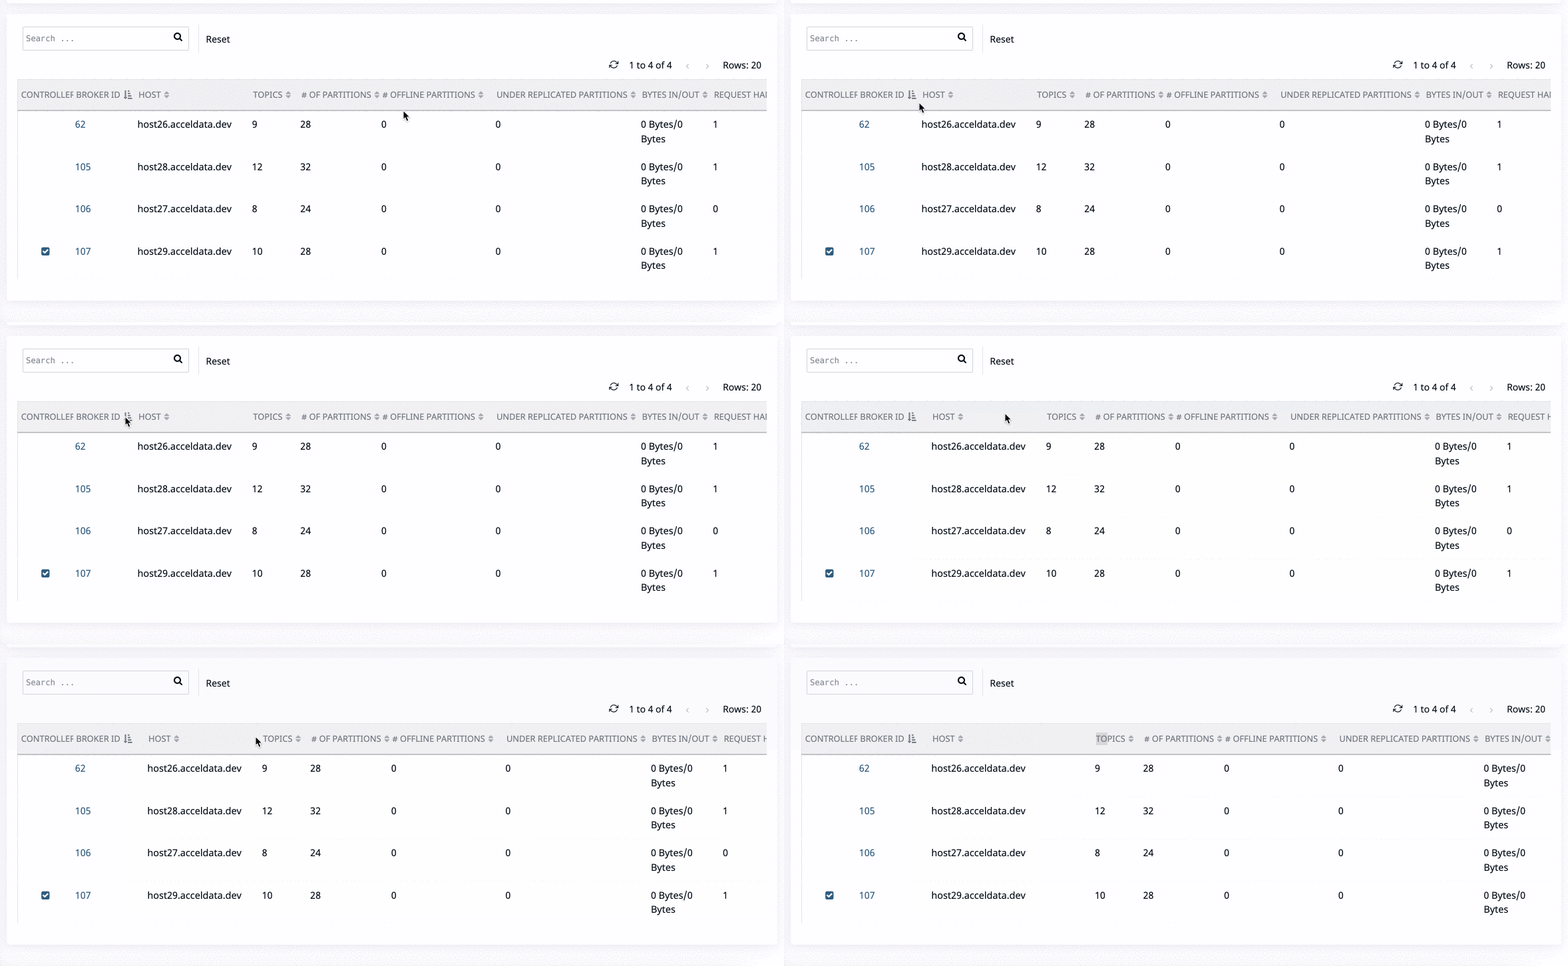
Following is a view of how to adjust the width of the column manually:
