Airflow
Apache Airflow is an open-source platform designed to author, schedule, and monitor workflows programmatically.
Acceldata Pulse provides the following observability capabilities on Airflow to enable efficient monitoring and management of Airflow workflows:
- Airflow StatsD Metrics: Real-time monitoring of Airflow performance through metrics.
- Scheduler Logs: Detailed logging of the scheduler's activities for easier debugging and analysis.
- Dag Runs and Events Listing: Comprehensive tracking of DAG runs and related events.
For details about setting up the Airflow component, see Airflow.
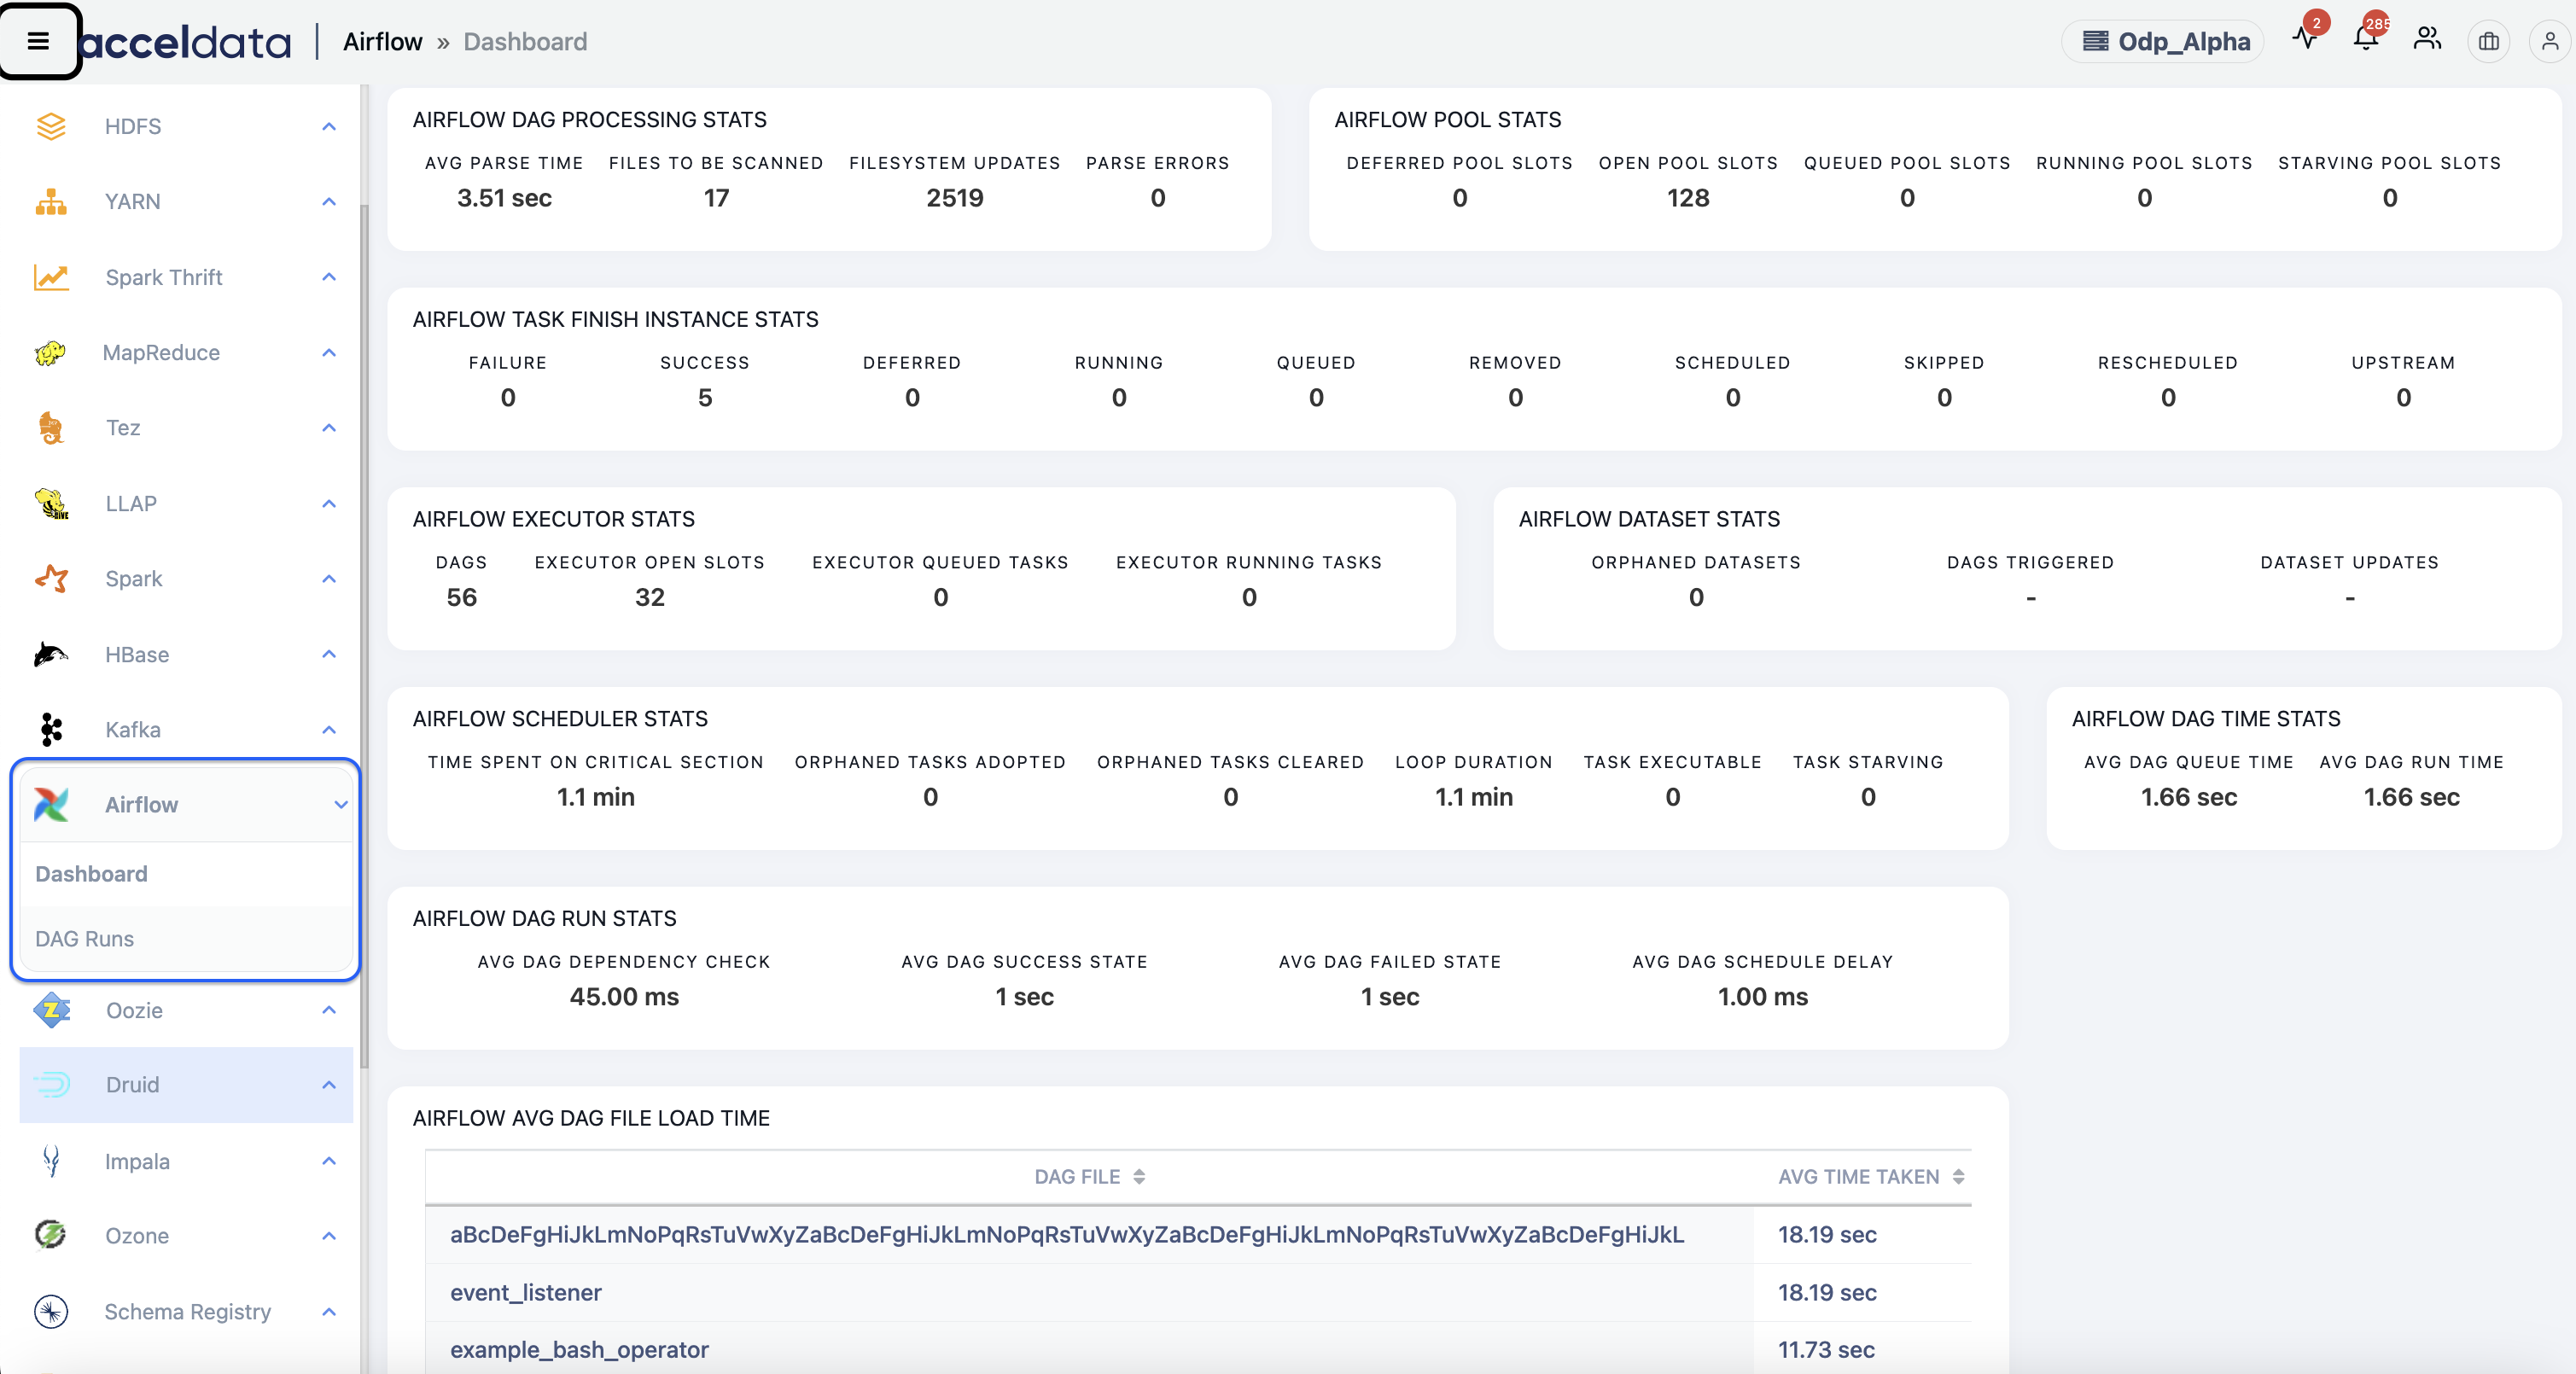
Airflow on the Pulse UI
To access the Airflow Dashboard and DagRuns pages, log on to the Pulse UI and navigate to the top left Menu > Airflow:
Monitoring the Airflow Logs and Service details
You can check the Airflow Logs and Service details by navigating to the respective UI pages.
The Logs page provides details such as information, errors, and warnings. This helps you to debug Airflow when there are any issues.
The Nodes page provides details such as the number of hosts where Airflow is deployed, application status, CPU Usage in %, Disk Usage in %, etc.
- To check the logs of Airflow, navigate to Menu > Logs. On the Logs page, select airflow_dags under Services. The Information, Warning, and Error logs are shown to monitor the health of Airflow, and these details help you in debugging. For more details, see Logs.
- To check the current status and the other details of the Airflow service, navigate to Menu > Nodes. On the Nodes page, select Airflow Scheduler and AirflowWebServer under Services. The service or application metrics, such as status, load, CPU and Disk usage, etc., are displayed on the Nodes page. For more details, see Nodes.
Monitoring the Airflow Alerts
You can enable the following Airflow alert on the Alerts page. This helps you debug and fix any failures encountered in the pipeline.
Pulse observes the health of Airflow and sends an Alert when any of them fail to perform as expected.
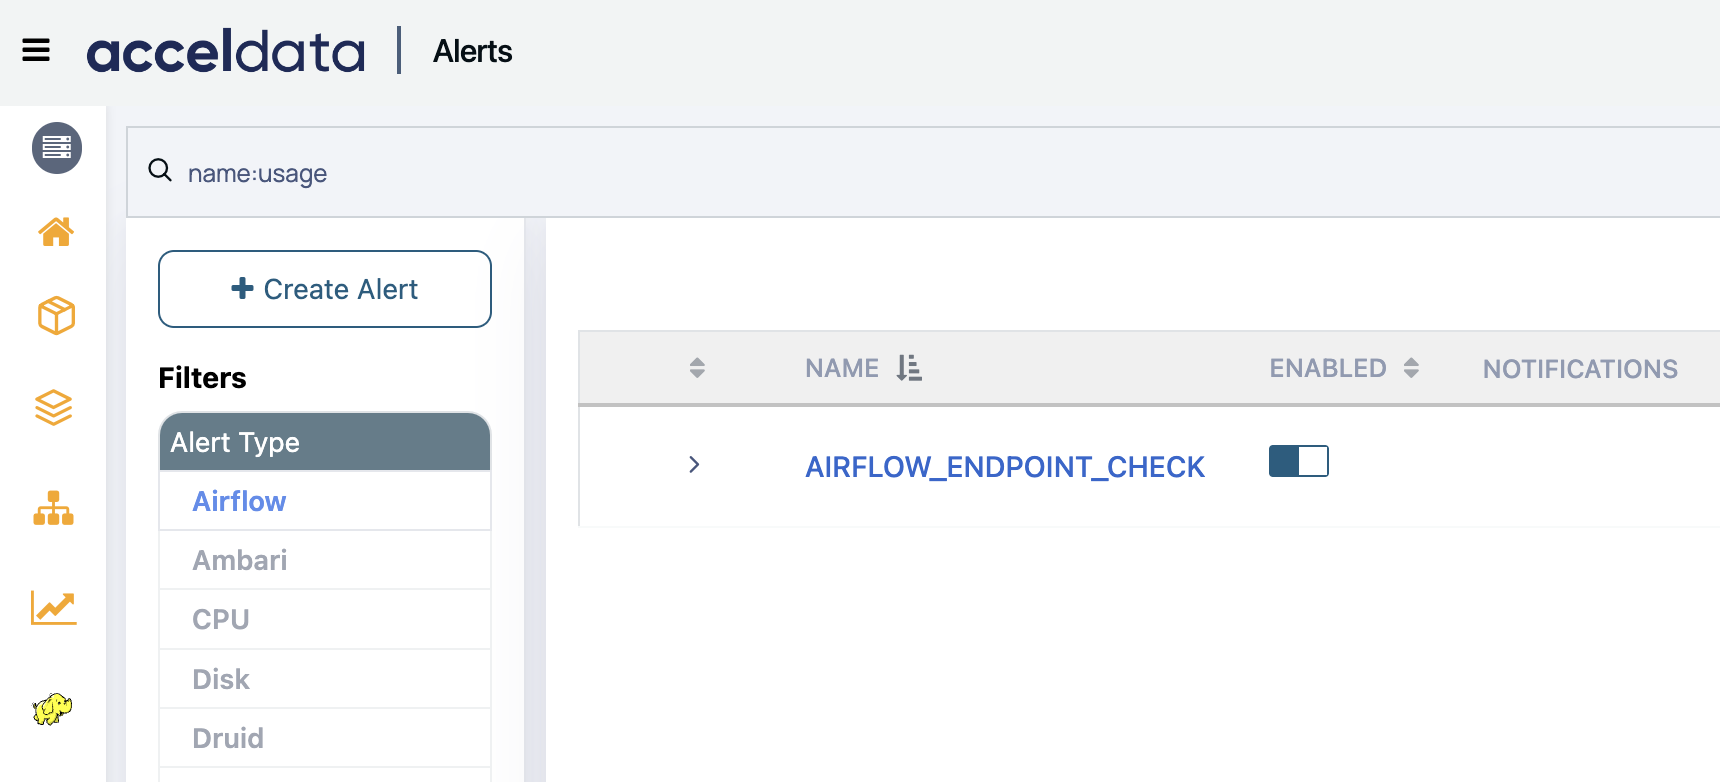
To access the Alerts page, log on to the Pulse UI and navigate to the top left Menu > Alerts. On the Alerts page, select the Airflow service from the filter list. The airflow alert appears on the screen.
| Alert | Description | Config |
|---|---|---|
Airflow Endpoint Check | This alert checks whether the system hosting Airflow is active or not. | Severity: "Critical", Execution Interval: "60" |
For the complete list of stock and predefined alerts, see Stock and Predefined Alerts.
For details about customizing and creating alerts, see Creating Alerts.