Kafka Cruise Control
Kafka Cruise Control service is designed to automate Apache Kafka clusters' management, monitoring, and optimization. When handling a large amount of data, issues such as resource exhaustion, longer rebalance times, increased latency, overloaded brokers, etc., might occur.
To efficiently address these challenges, Pulse offers the following capabilities:
- Provides comprehensive observability of Cruise Control by monitoring key performance metrics to ensure optimal operation and resource utilization.
- Tracks CPU usage to identify resource constraints, while JVM memory monitoring helps detect potential memory leaks or inefficiencies in memory allocation.
- Additionally, Pulse captures latency and throughput metrics during Cruise Control’s data fetching processes from Kafka, offering insights into data processing efficiency and potential bottlenecks.
- Provides a holistic view of Cruise Control’s performance and aids in proactive issue detection and maintaining smooth operations, contributing to system reliability and scalability in managing Kafka clusters.
These capabilities allow for quick corrective actions to resolve issues in the data pipeline.
For details about setting up the Kafka Cruise Control, see Cruise Control.
Kafka Cruise Control on the Pulse UI
You can navigate to the Pulse Menu option on the top left pane and select Kafka > Cruise Control to access its UI page. The Pulse Kafka Cruise Control page provides the following Summary Panel and Charts with details.
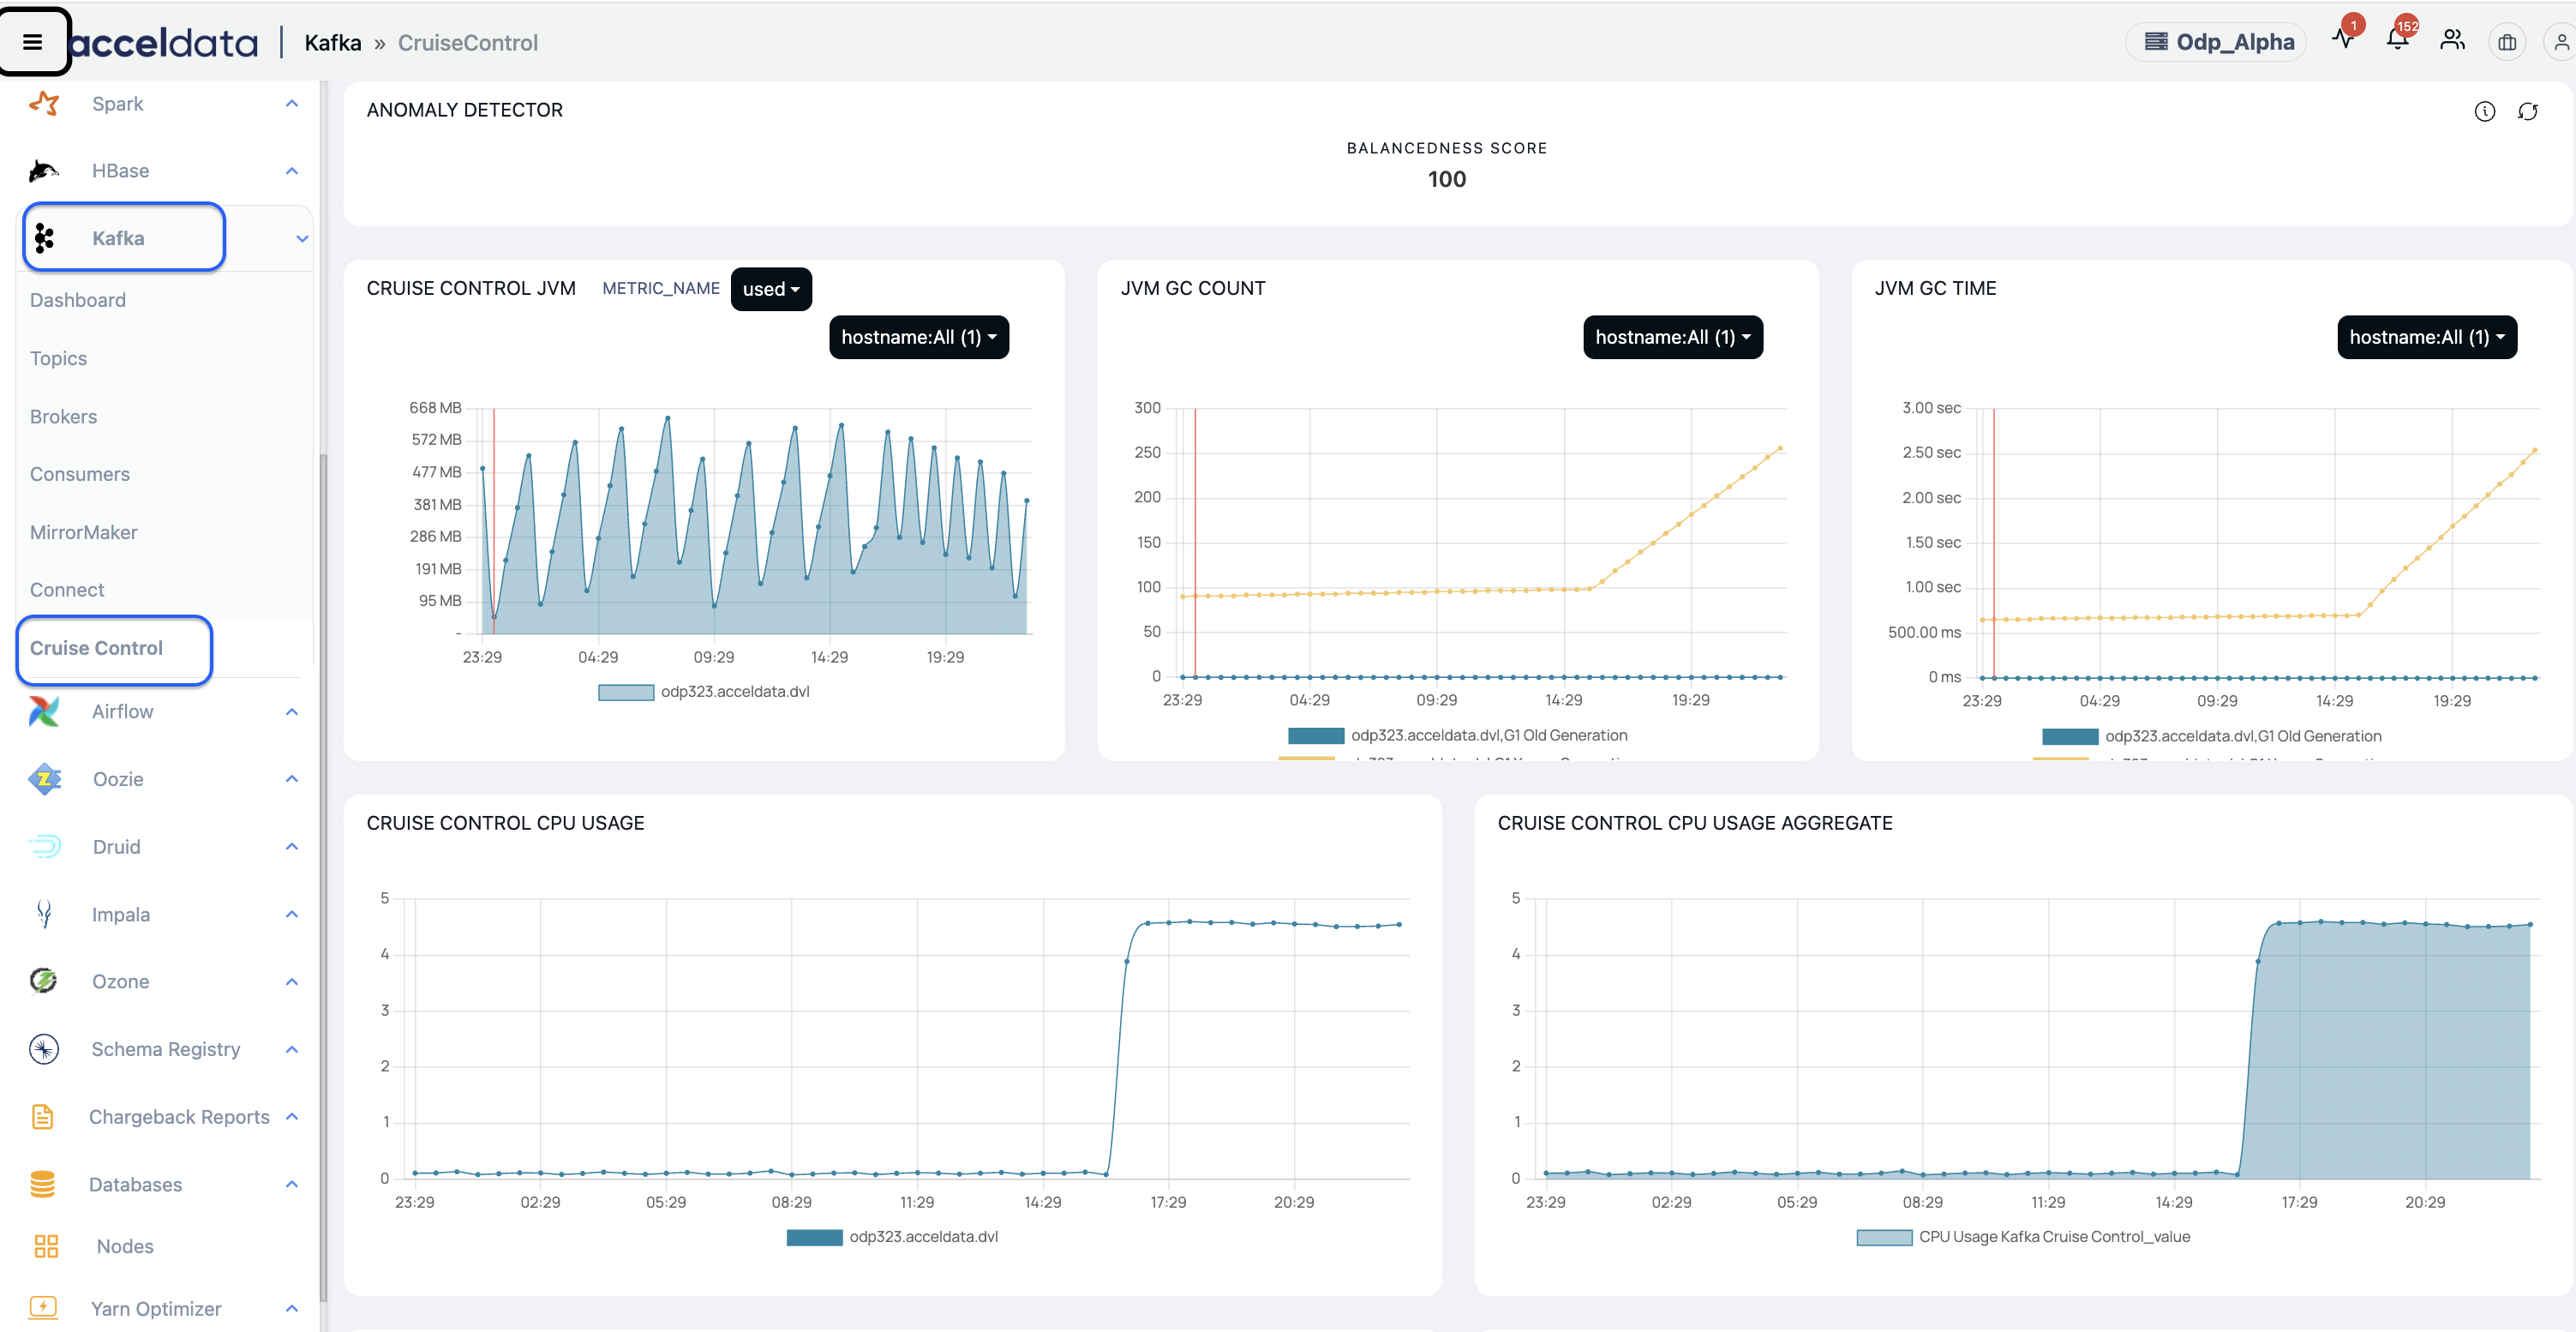
Summary Panel
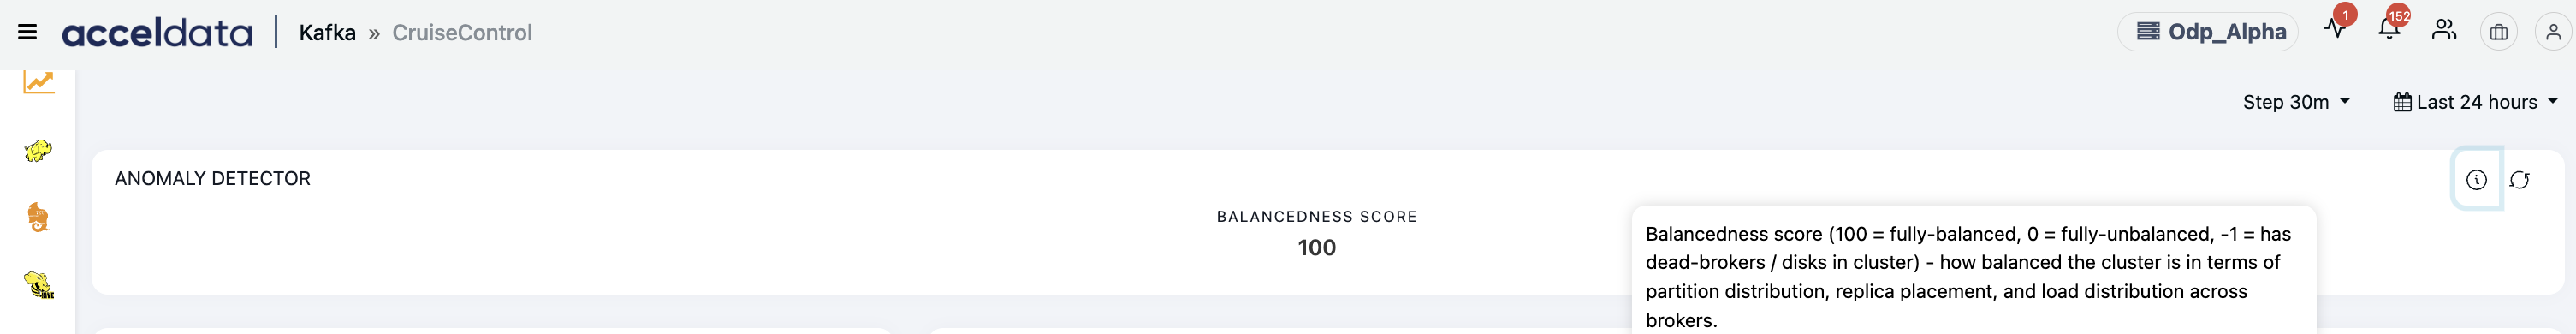
In the Anomaly Detector section, the Balancedness Score denotes how balanced the cluster is in terms of partition distribution, replica placement, and load distribution across brokers.
- A score of 100 is considered as fully balanced
- A score of 0 is fully unbalanced
- A score of -1 has dead-brokers / disks in cluster
Charts
Charts
The Kafka Cruise Control charts provide the following details.
On any chart, you can perform the following activities.
- Refresh a chart
- Enlarge a chart
- Download a chart
| Chart | Description |
|---|---|
| Cruise Control JVM | The amount of memory being used by the Java Virtual Machine (JVM) running Kafka Cruise Control. |
| JVM GC Count | The number of garbage collection events in the JVM. |
| JVM GC Time | The total time spent on garbage collection by the JVM. |
| Cruise Control CPU Usage | The CPU consumed by Cruise Control for managing and balancing Kafka clusters. |
| Cruise Control CPU Usage Aggregate | The total CPU usage by Cruise Control across all processes or nodes in a distributed environment. |
| Metric Fetcher Manager Partition Samples Fetcher Latency | The 50th percentile and 99 percentile latency values in fetching the partition level metrics from the Kafka topic. |
| Metric Fetcher Manager Partition Samples Fetcher Throughput | The rate at which samples are fetched by the Metric Fetcher Manager. |
| UserTaskManager Active Sessions Count | The number of active sessions currently managed by the UserTaskManager. |
| UserTaskManager Active User Tasks | The number of active user tasks being handled by the UserTaskManager. |
Monitoring the Cruise Control Alerts
You can enable the following Kafka Cruise Control alerts on the Alerts page. This helps you debug and fix any failures encountered in the pipeline.
Pulse observes the health of Kafka Cruise Control and sends an Alert when it fails to perform as expected.
To access the Alerts page, log on to the Pulse UI and navigate to the top left Menu > Alerts. On the Alerts page, select the Kafka service from the filter list. The list of alerts appear on the screen.
| Alert | Description | Configuration |
|---|---|---|
KAFKA_CRUISE CONTROL_ENDPOINT CHECK | The alert checks whether the Kafka Cruise Control node is active or not. | Severity: "Critical", Execution Interval: "60" |
KAFKA_CRUISE_CONTROL_FETCH_METRIC_FAILURE | This alert checks failures in fetching of partition level metrics from Kafka topic by Kafka Cruise Control's MetricFetcherManager Partition Samples Fetcher. | Severity: "Medium", Execution Interval: "60" |
KAFKA_CRUISE_CONTROL_NO_DATA_ALERT | This alert gets triggered when the Kafka Cruise control data is not pushed. | Severity: "Medium", Execution Interval: "120" |
For the complete list of stock and predefined alerts, see Stock and Predefined Alerts.
For details about customizing and creating alerts, see Creating Alerts.
Monitoring the Kafka Connect Cruise Logs and Service details
You can check the Kafka Cruise Control Logs and Service details by navigating to the respective UI pages.
The Logs page provides details such as information, errors, and warnings. This helps you to debug Kafka Cruise Control when there are any issues.
The Nodes page provides details such as the number of hosts where Kafka Cruise Control is deployed, application status, CPU Usage in %, Disk Usage in %, etc.
- To check the Logs of the Kafka Cruise Control, navigate to Menu > Logs. On the Logs page, select kafka_cruise_control under Services. The Information, Warning, and Error logs are shown to monitor the health of the Cruise Control, and these details help you in debugging. For more details, see Logs.
- To check the current status and the other details of the Kafka Cruise Control service, navigate to Menu > Nodes. On the Nodes page, select KafkaConnectCruise under Services. The service or application metrics, such as status, load, CPU and Disk usage, etc., are displayed on the Nodes page. For more details, see Nodes.