Pulse supports anomaly detection only for time-series metrics displayed on dashboards that use line or area charts created with the Dashplots template.
Pulse dashboards are designed to help you monitor the health and performance of Hadoop services. By default, you need to manually identify the unusual trends required. This process is time-consuming and prone to error.
With the Anomaly Detection capability, Pulse automatically identifies and highlights deviations or irregular patterns in data trends, helping you quickly detect performance issues.
Dashboards built using Dashplots follow a standardized visualization structure, which enables Pulse to accurately detect anomalies in metric trends over time.
The dashboards that use custom chart implementations do not have the anomaly detection option.
For example:
- HDFS, Kudu, YARN, etc. dashboards — These dashboards use line and area charts generated through the Dashplots template, and therefore support the anomaly detection option.
- Flink, MapReduce, Tez, etc. dashboards — These dashboards use custom chart implementations that are not based on Dashplots, so the anomaly detection feature is not available on their charts.
How It Works
The Anomaly Detection module in Pulse uses Prophet time-series forecasting to identify unusual patterns in metrics.
It learns from historical data, accounting for daily and weekly trends, and predicts expected metric values within confidence intervals.
If the actual metric value, such as heap memory usage, falls outside these predicted bounds, Pulse flags it as an anomaly and visually highlights it on the chart.
Historical Analysis
- Pulse analyzes the past 30 days of data with a step of 5 minutes by default. These values are configurable.
- It calculates the upper threshold and lower threshold for each metric.
Anomaly Detection Logic
- When a metric value goes above its upper threshold or below its lower threshold, Pulse flags that data point as an anomaly.
- These anomalies are visually highlighted on the chart upon hovering and selecting the option Anomaly Detection on charts.
Configurable Parameters
- The analysis period and threshold sensitivity can be configured in the ad-anomaly.yml file.
- Adjusting sensitivity determines how easily anomalies are triggered.
- Looser thresholds reduce false positives.
- Tighter thresholds increase detection sensitivity.
Model Training
To adjust anomaly detection settings, edit the ad-anomaly.yml configuration file on the Pulse node. For more information, see Configure Anomaly Detection Model Training.
Example: Threshold and Anomaly Detection
The threshold defines how much deviation from the upper and lower bounds is acceptable.
xxxxxxxxxxTHRESHOLD = 5LOWER_BOUND = 95UPPER_BOUND = 105 # An anomaly is detected if the value is < 90 or the value is > 110ACTUAL_VALUE = 92 # → Not an anomaly (92 > 90)ACTUAL_VALUE = 107 # → Not an anomaly (107 < 110)ACTUAL_VALUE = 89 # → Anomaly (89 < 90)ACTUAL_VALUE = 111 # → Anomaly (111 > 110)- With a threshold of 5, the acceptable range is extended by ±5 units from the lower and upper bounds (95–105).
- Any value outside this adjusted range (below 90 or above 110) is identified as an anomaly.
View Anomalies on Charts
- Open any time-series chart within a service dashboard and select Anomaly Detection from the chart options.
- Pulse highlights anomalous data points with highlighted markers on the chart, showing where metric values exceeded normal thresholds.
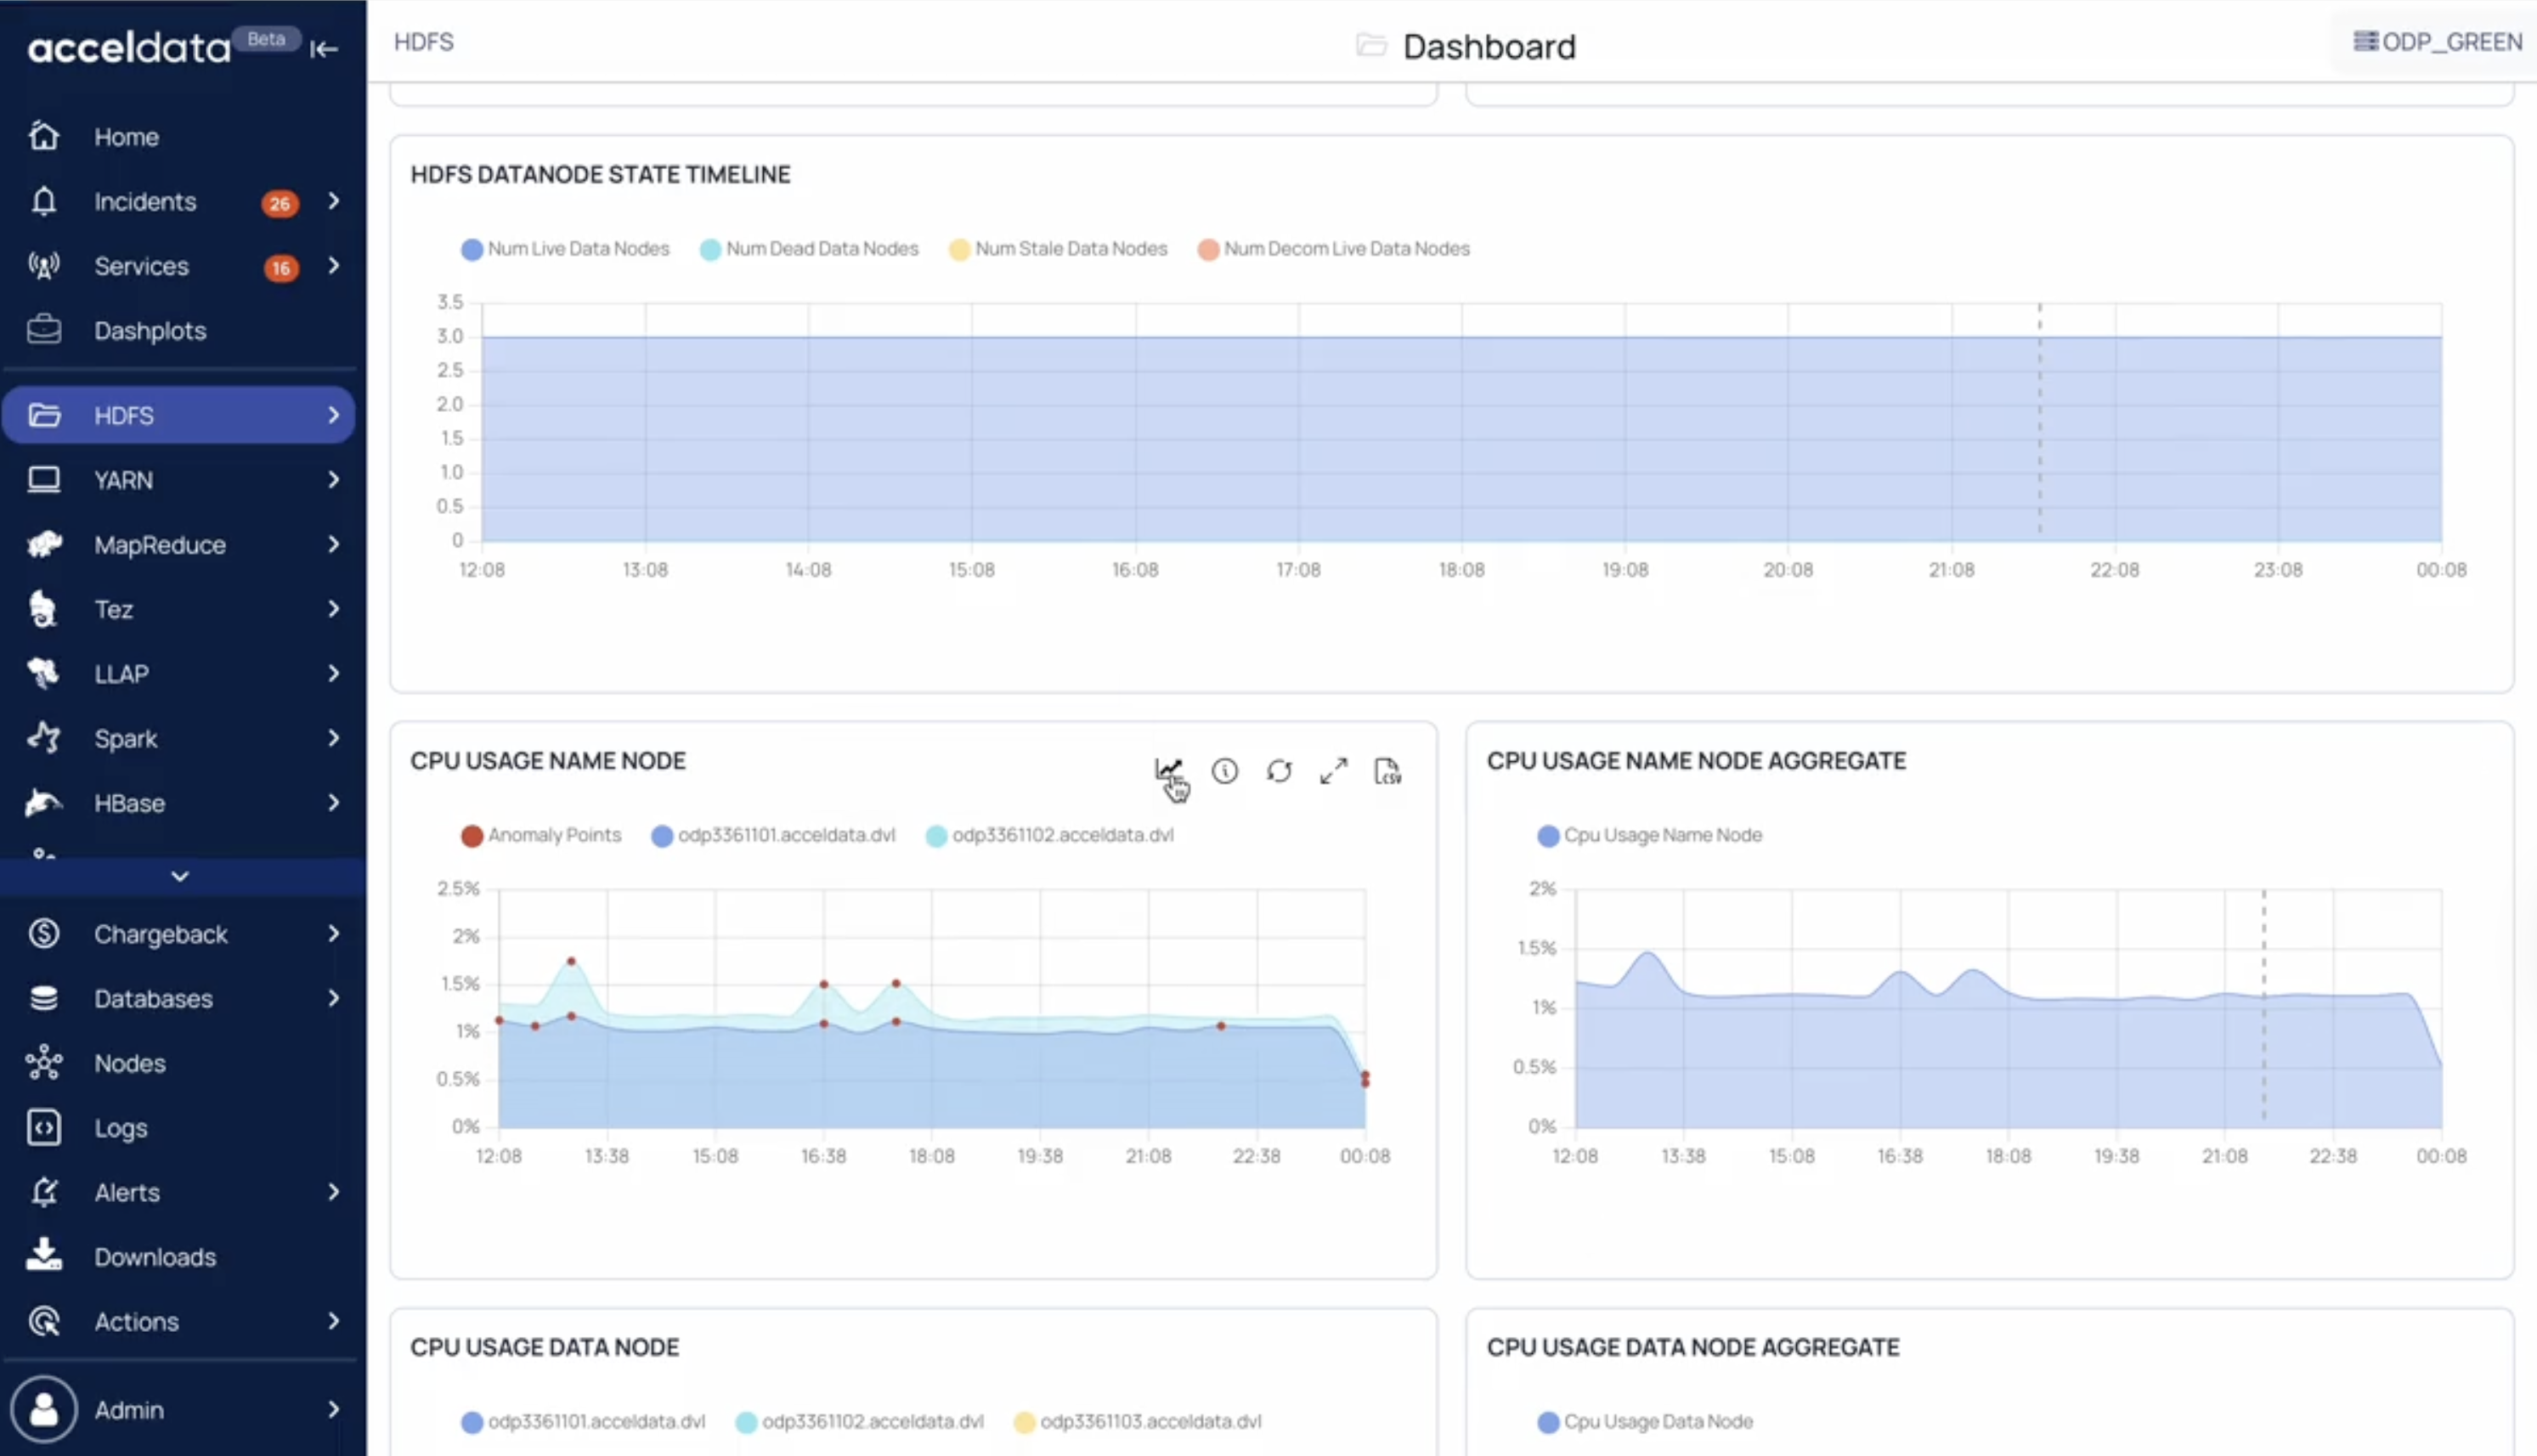
This visualization enables rapid identification of performance issues. For example, sudden spikes in heap memory, CPU load, GC collection count, etc., occur without manually reviewing all data.