Generate chargeback reports to analyze resource consumption costs across Spark and Trino workloads. Chargeback reporting helps organizations understand resource utilization patterns, identify cost-driving workloads, and allocate infrastructure expenses accurately.
Chargeback reports provide visibility into:
Who is consuming resources.
Where resources are being consumed.
The cost associated with resource consumption.
Which workloads contribute most to infrastructure expenses.
The calculated costs are based on user-defined compute and memory rates.
Before You Begin
Configure the following cost parameters before generating chargeback reports:
Compute Cost/Hour: Cost associated with compute resource usage per hour.
Memory Cost/Hour: Cost associated with memory resource usage per hour.
These values are used to calculate the total cost displayed in the chargeback reports.
Navigation
In the xObserve UI, navigate to Chargeback Reports.
Select the desired compute cluster from the cluster selector in the upper-right corner.
Select one of the supported applications:
Spark
Trino
Select the reporting time range.
Create a new report or select an existing report.
Supported Applications
Chargeback reporting currently supports the following applications.
Spark
For Spark workloads, you can generate reports grouped by:
User
Application Status
The application status includes values such as Succeeded, Running, Failed, Killed, and Other Spark application states.
For Spark reports, both compute and memory cost are calculated.
Use Spark chargeback reports to identify:
Resource consumption by individual users.
Cost associated with application execution states.
High-cost Spark workloads.
Trino
For Trino workloads, you can generate reports grouped by:
Query State
Query Type
User
For Trino reports, only compute cost is calculated.
Use Trino chargeback reports to identify:
Resource consumption by query execution state.
Cost associated with different query types.
Compute utilization by individual users.
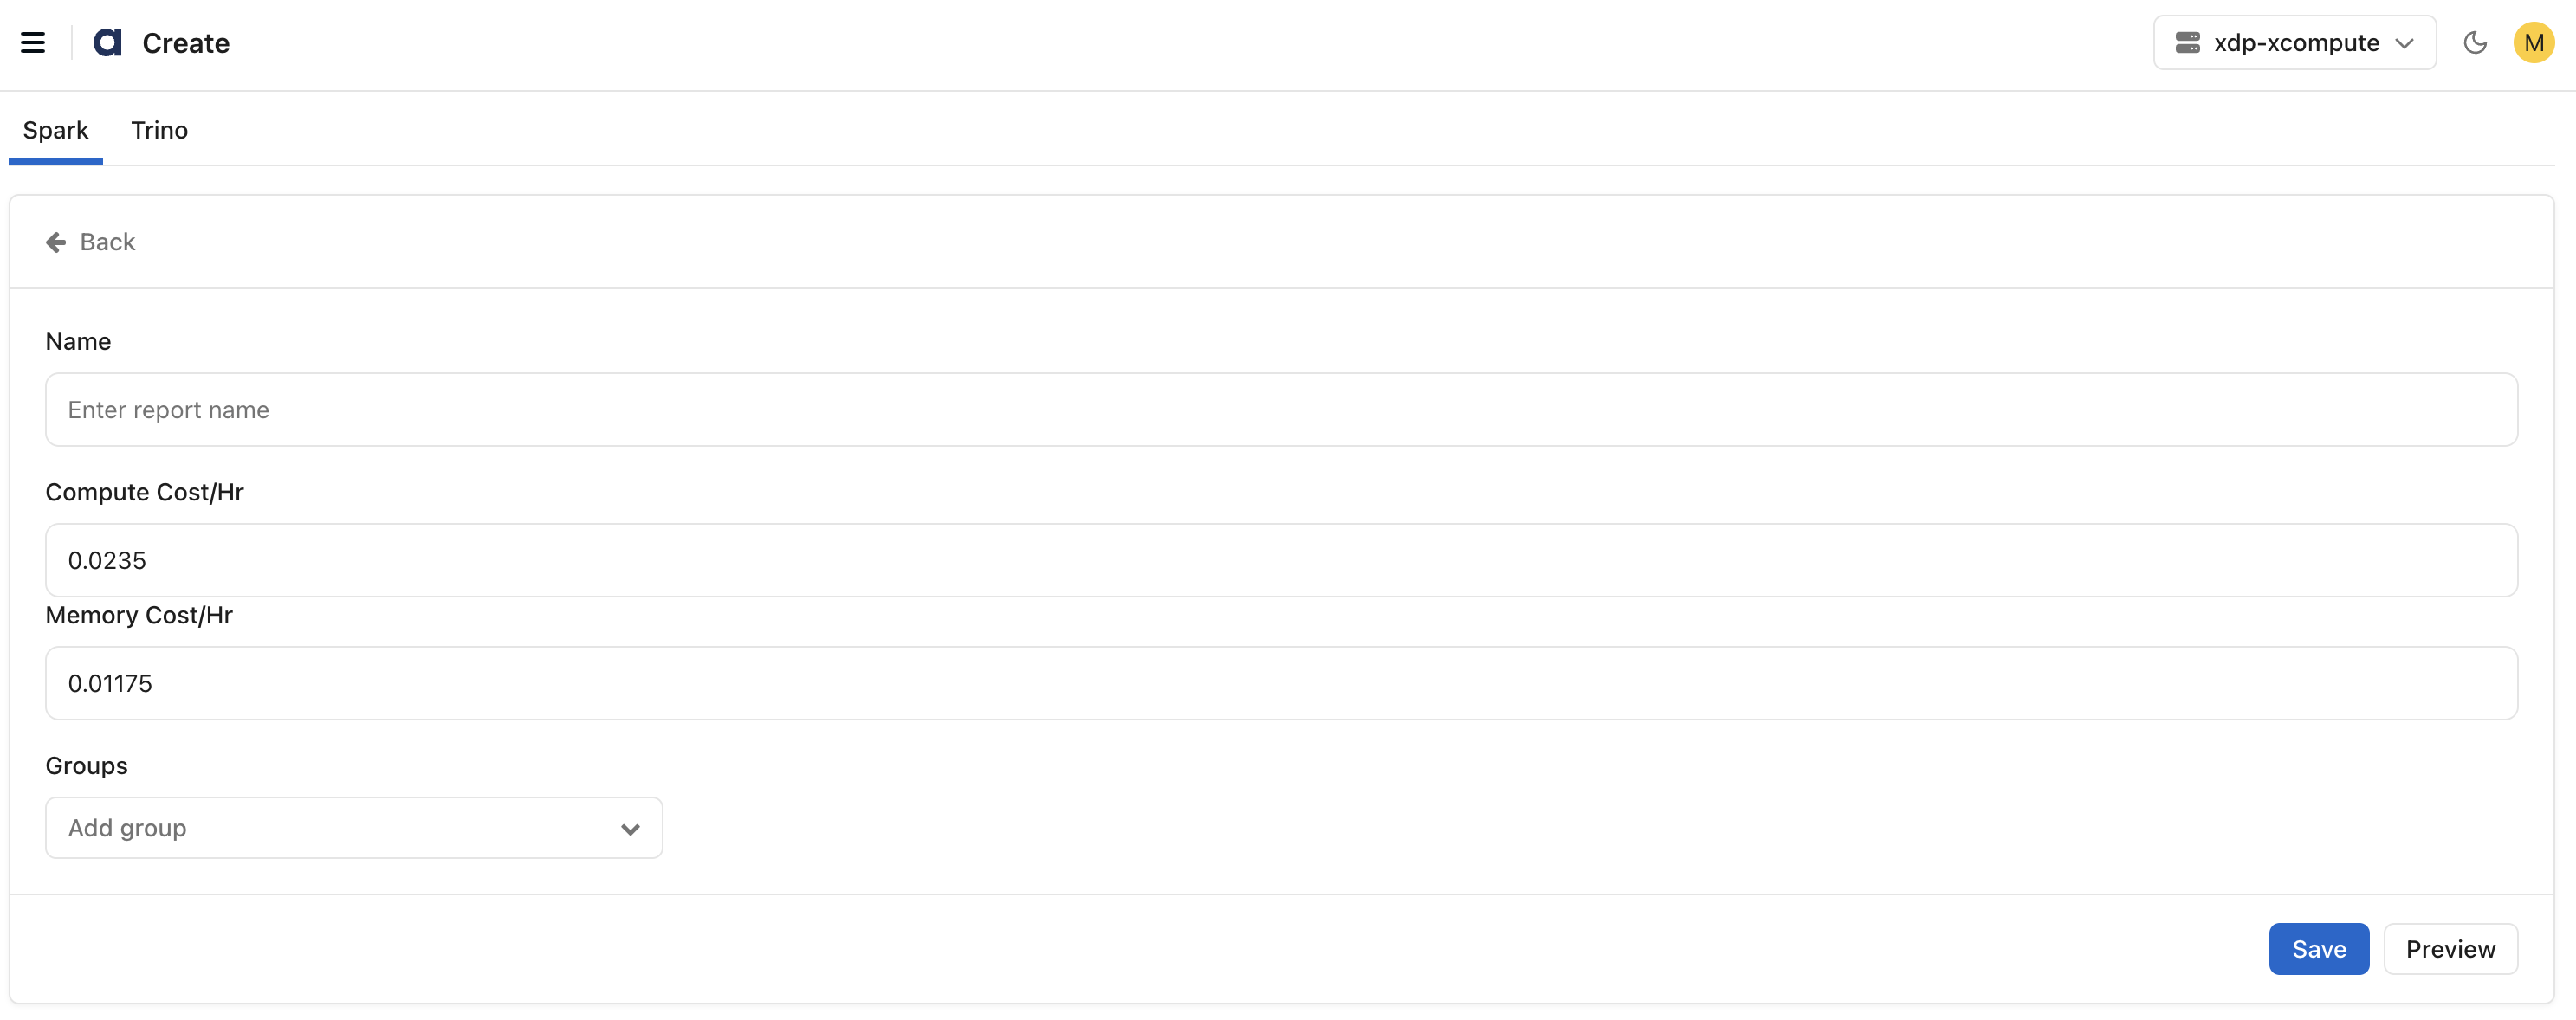
Create a Chargeback Report
Select either the Spark or Trino tab.
Click Create Report.
Enter a report name.
Specify the Compute Cost/Hour and Memory Cost/Hour values.
For Spark reports, both compute and memory cost are calculated.
For Trino reports, only compute cost is calculated.
Select one or more grouping dimensions.
Click Preview to review the report output.
Click Save to save the report.
The report is generated using the selected grouping criteria and configured cost parameters.
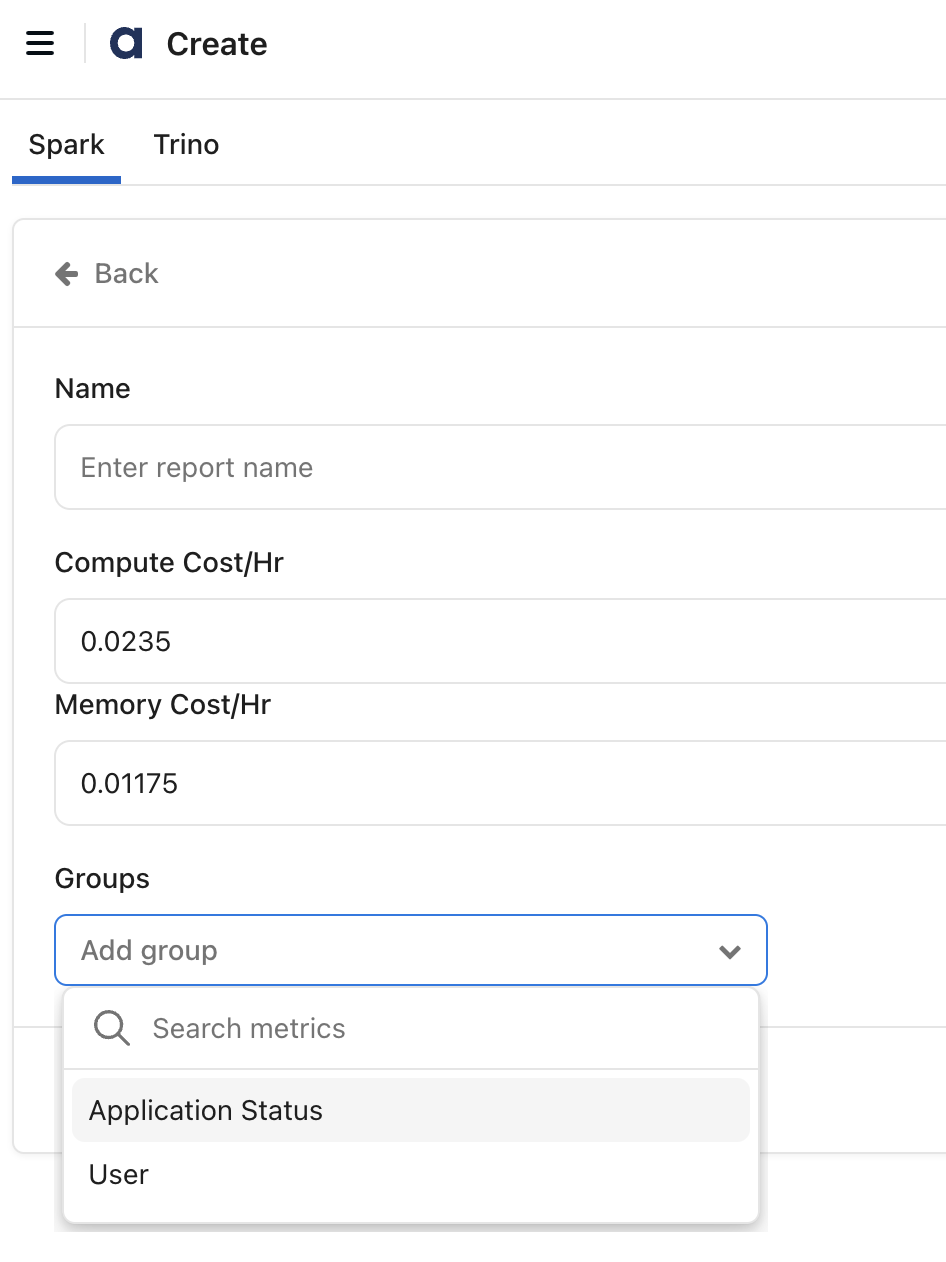
Configure Report Groups
You can organize report data using one or more grouping dimensions.
Spark Groups
Available grouping options include:
User
Application Status
Example group combinations:
User
Application Status
User → Application Status
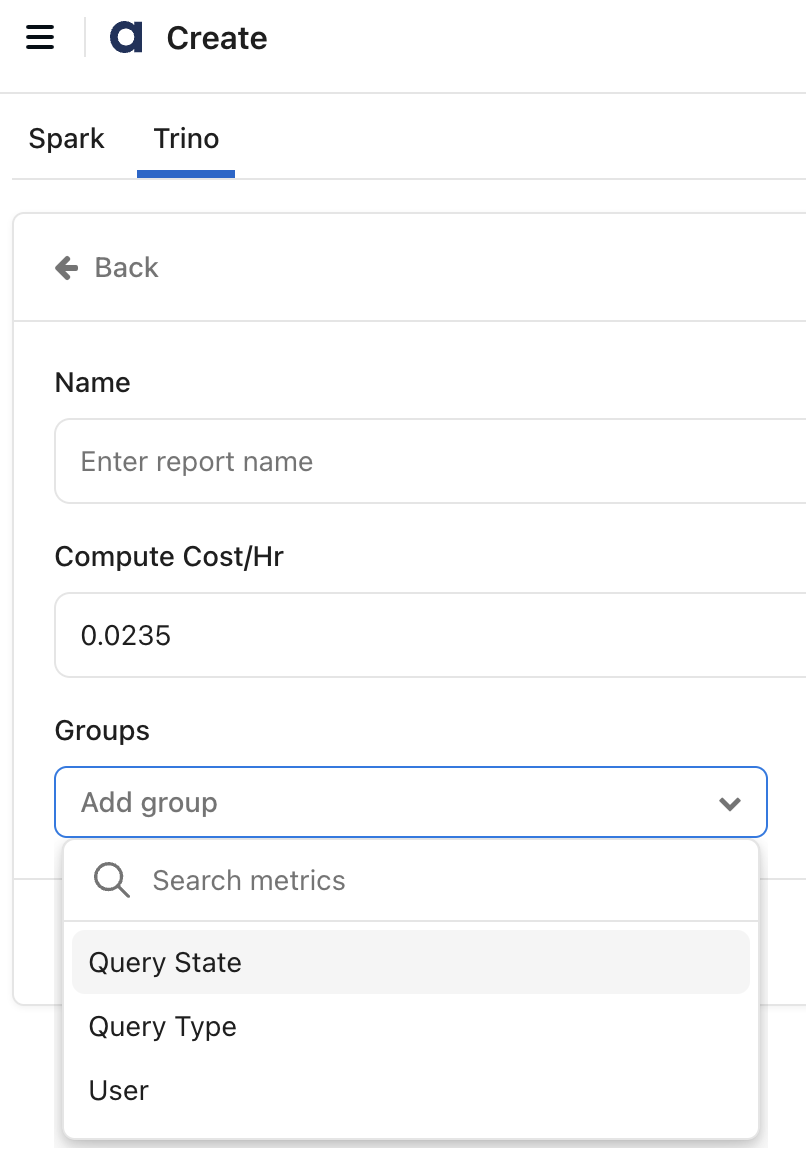
Trino Groups
Available grouping options include:
Query State
Query Type
User
Example group combinations:
Query State
Query Type
User
Query State → Query Type
Query State → Query Type → User
Multiple grouping levels enable detailed cost breakdown analysis.
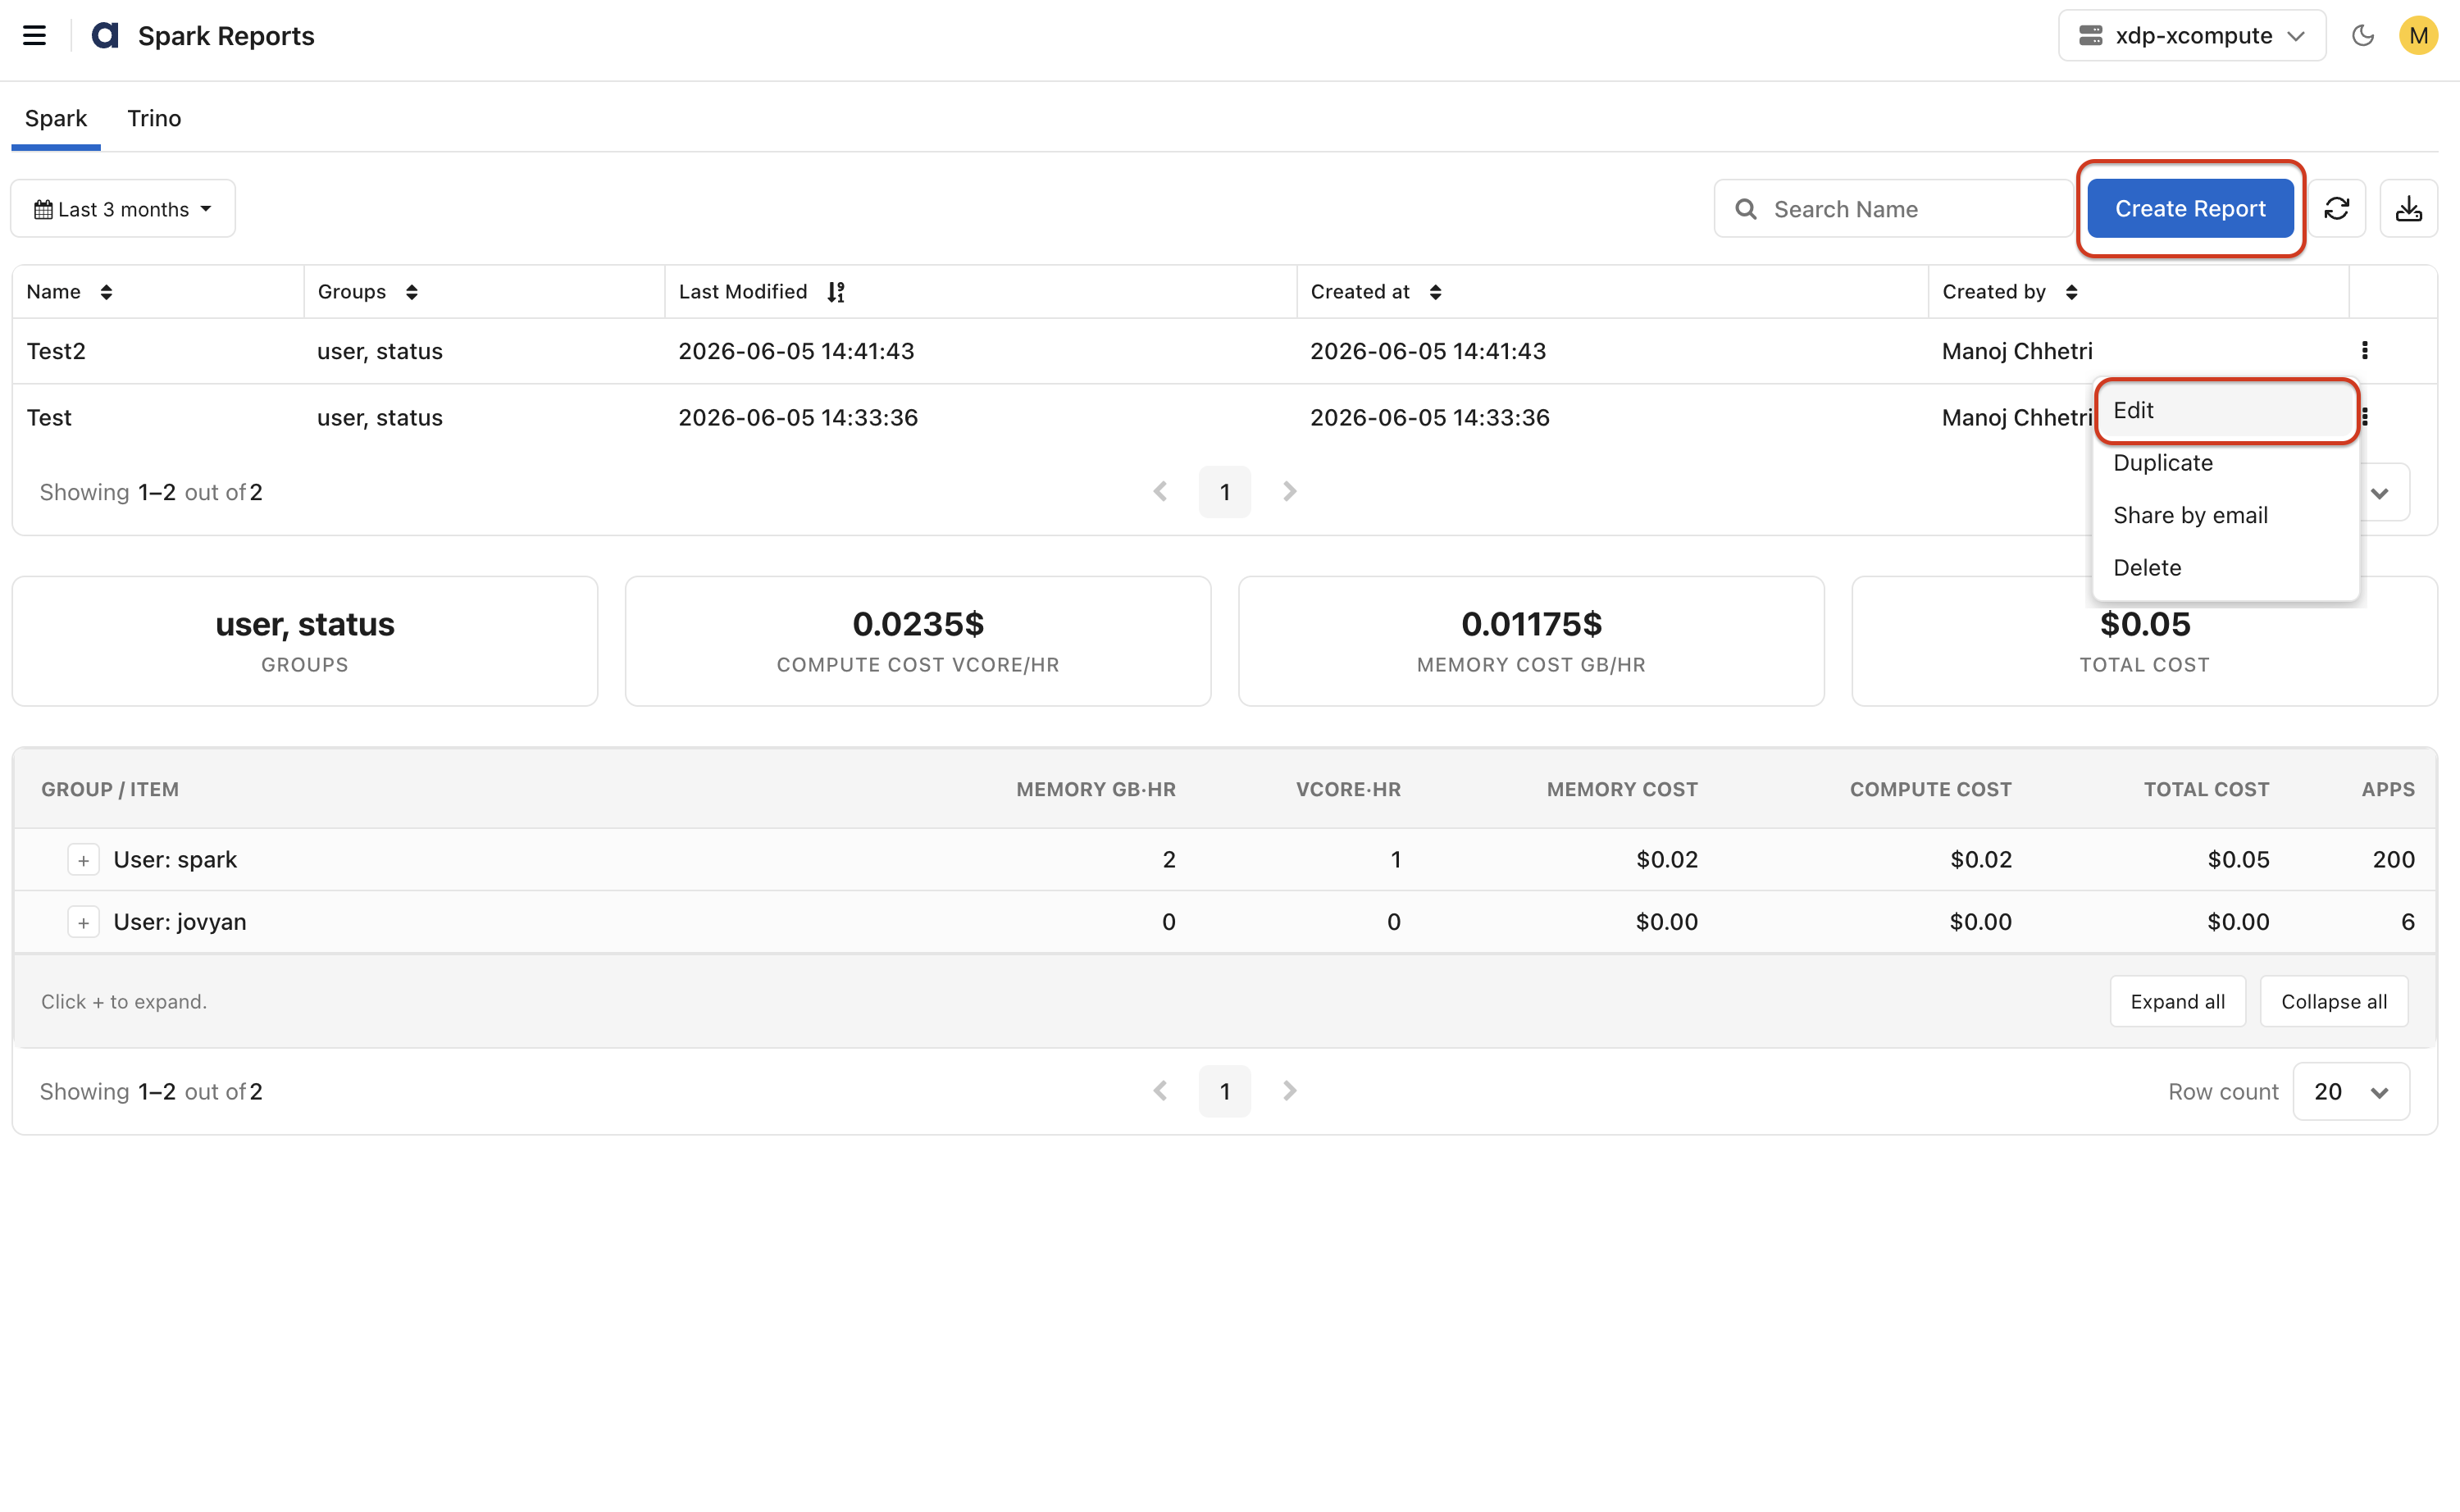
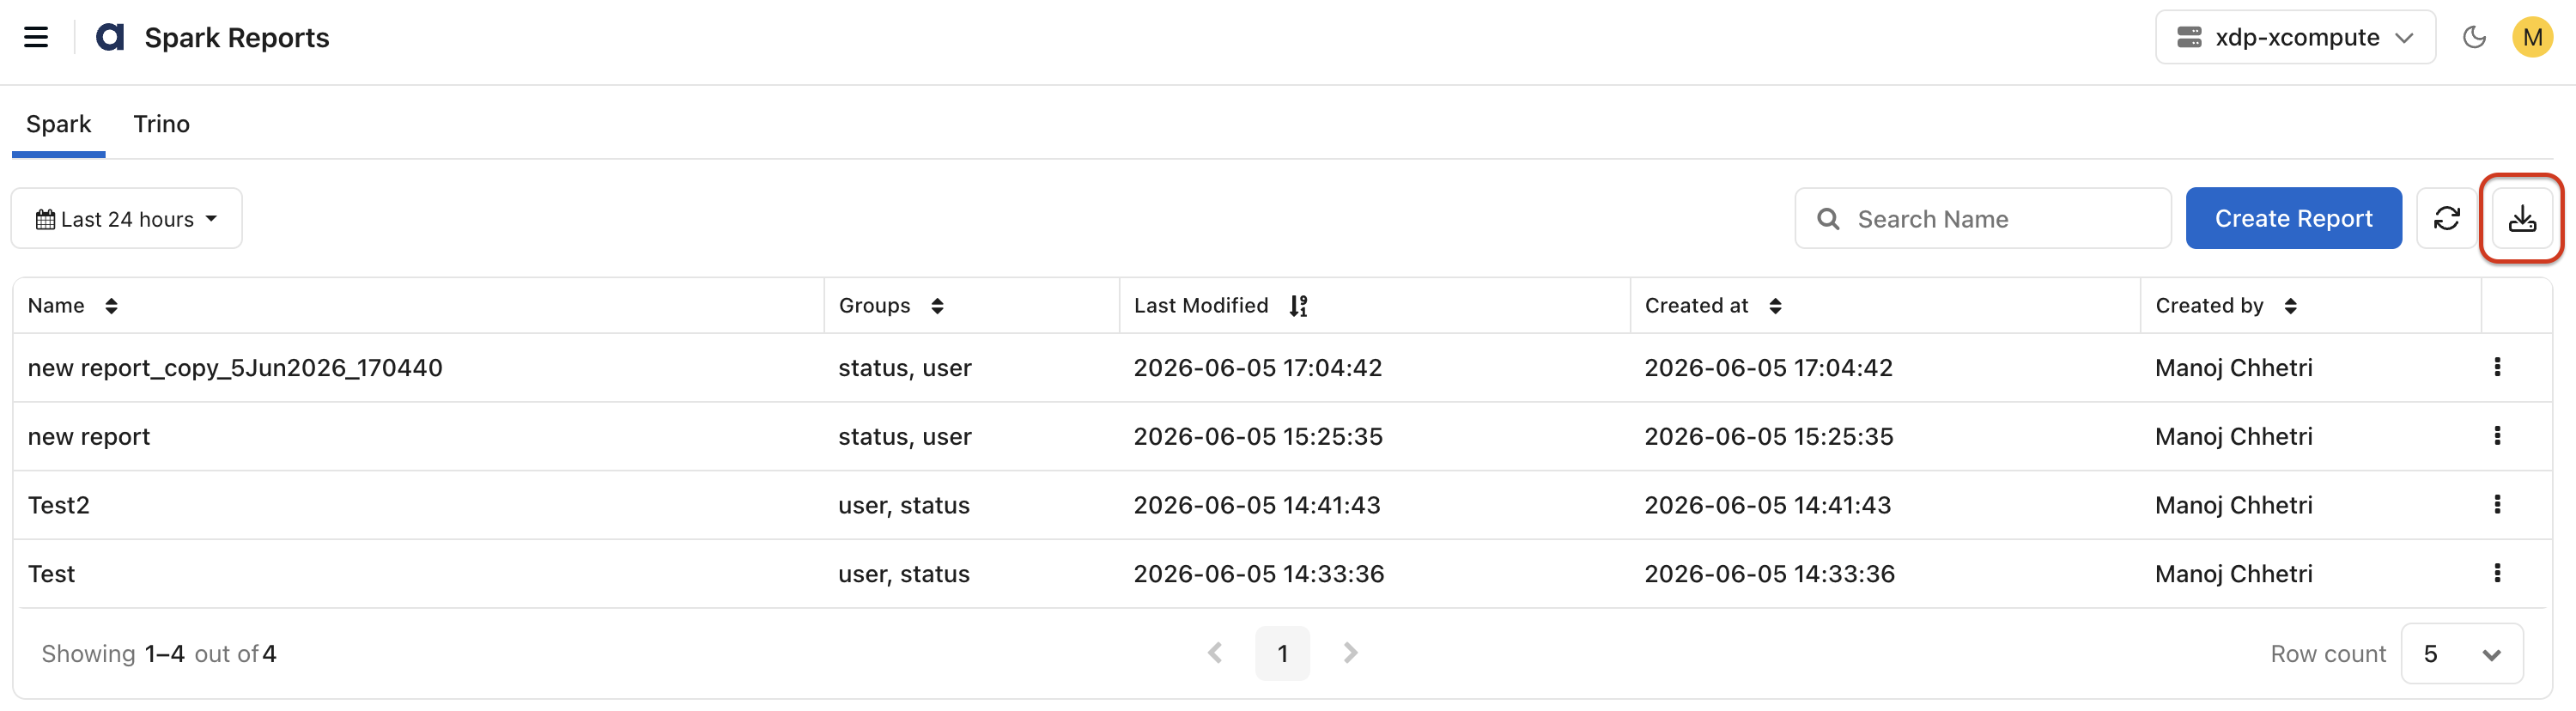
View Saved Reports
Saved reports are displayed in the report list.
The report list includes:
Name: Report name.
Groups: Configured grouping dimensions.
Last Modified: Date and time of the most recent modification.
Created At: Date and time the report was created.
Created By: User who created the report.
Use the search field to locate specific reports.
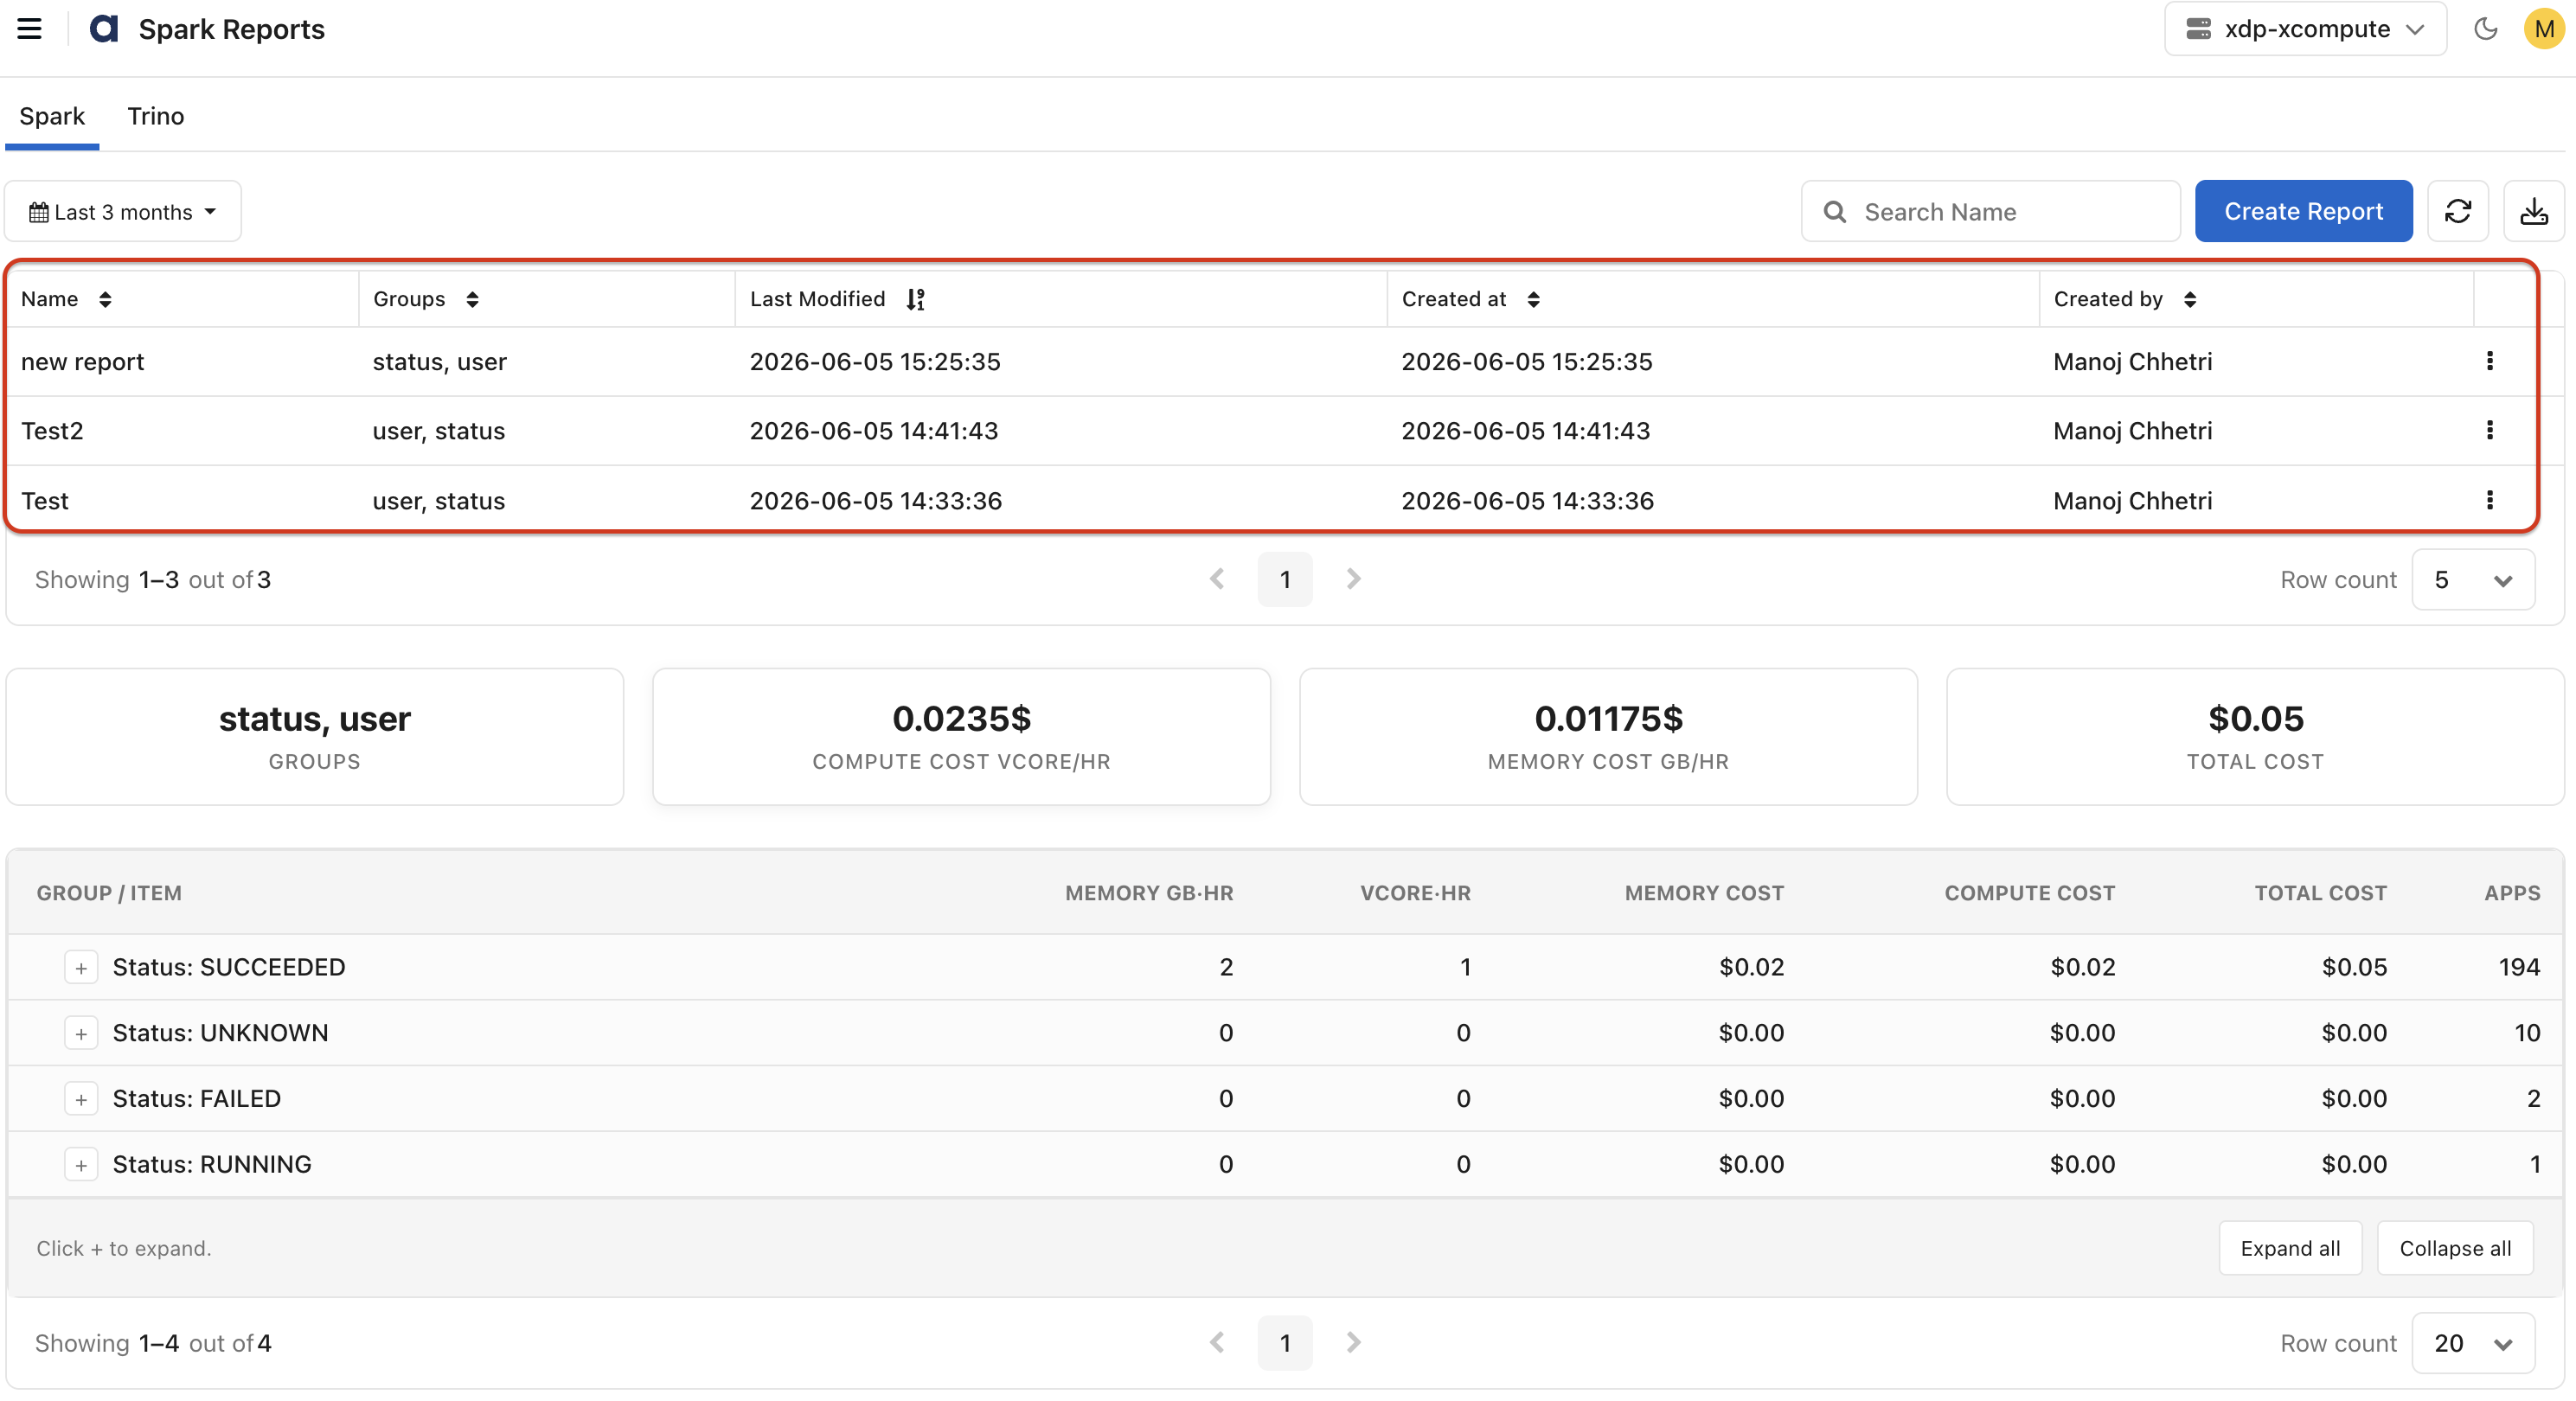
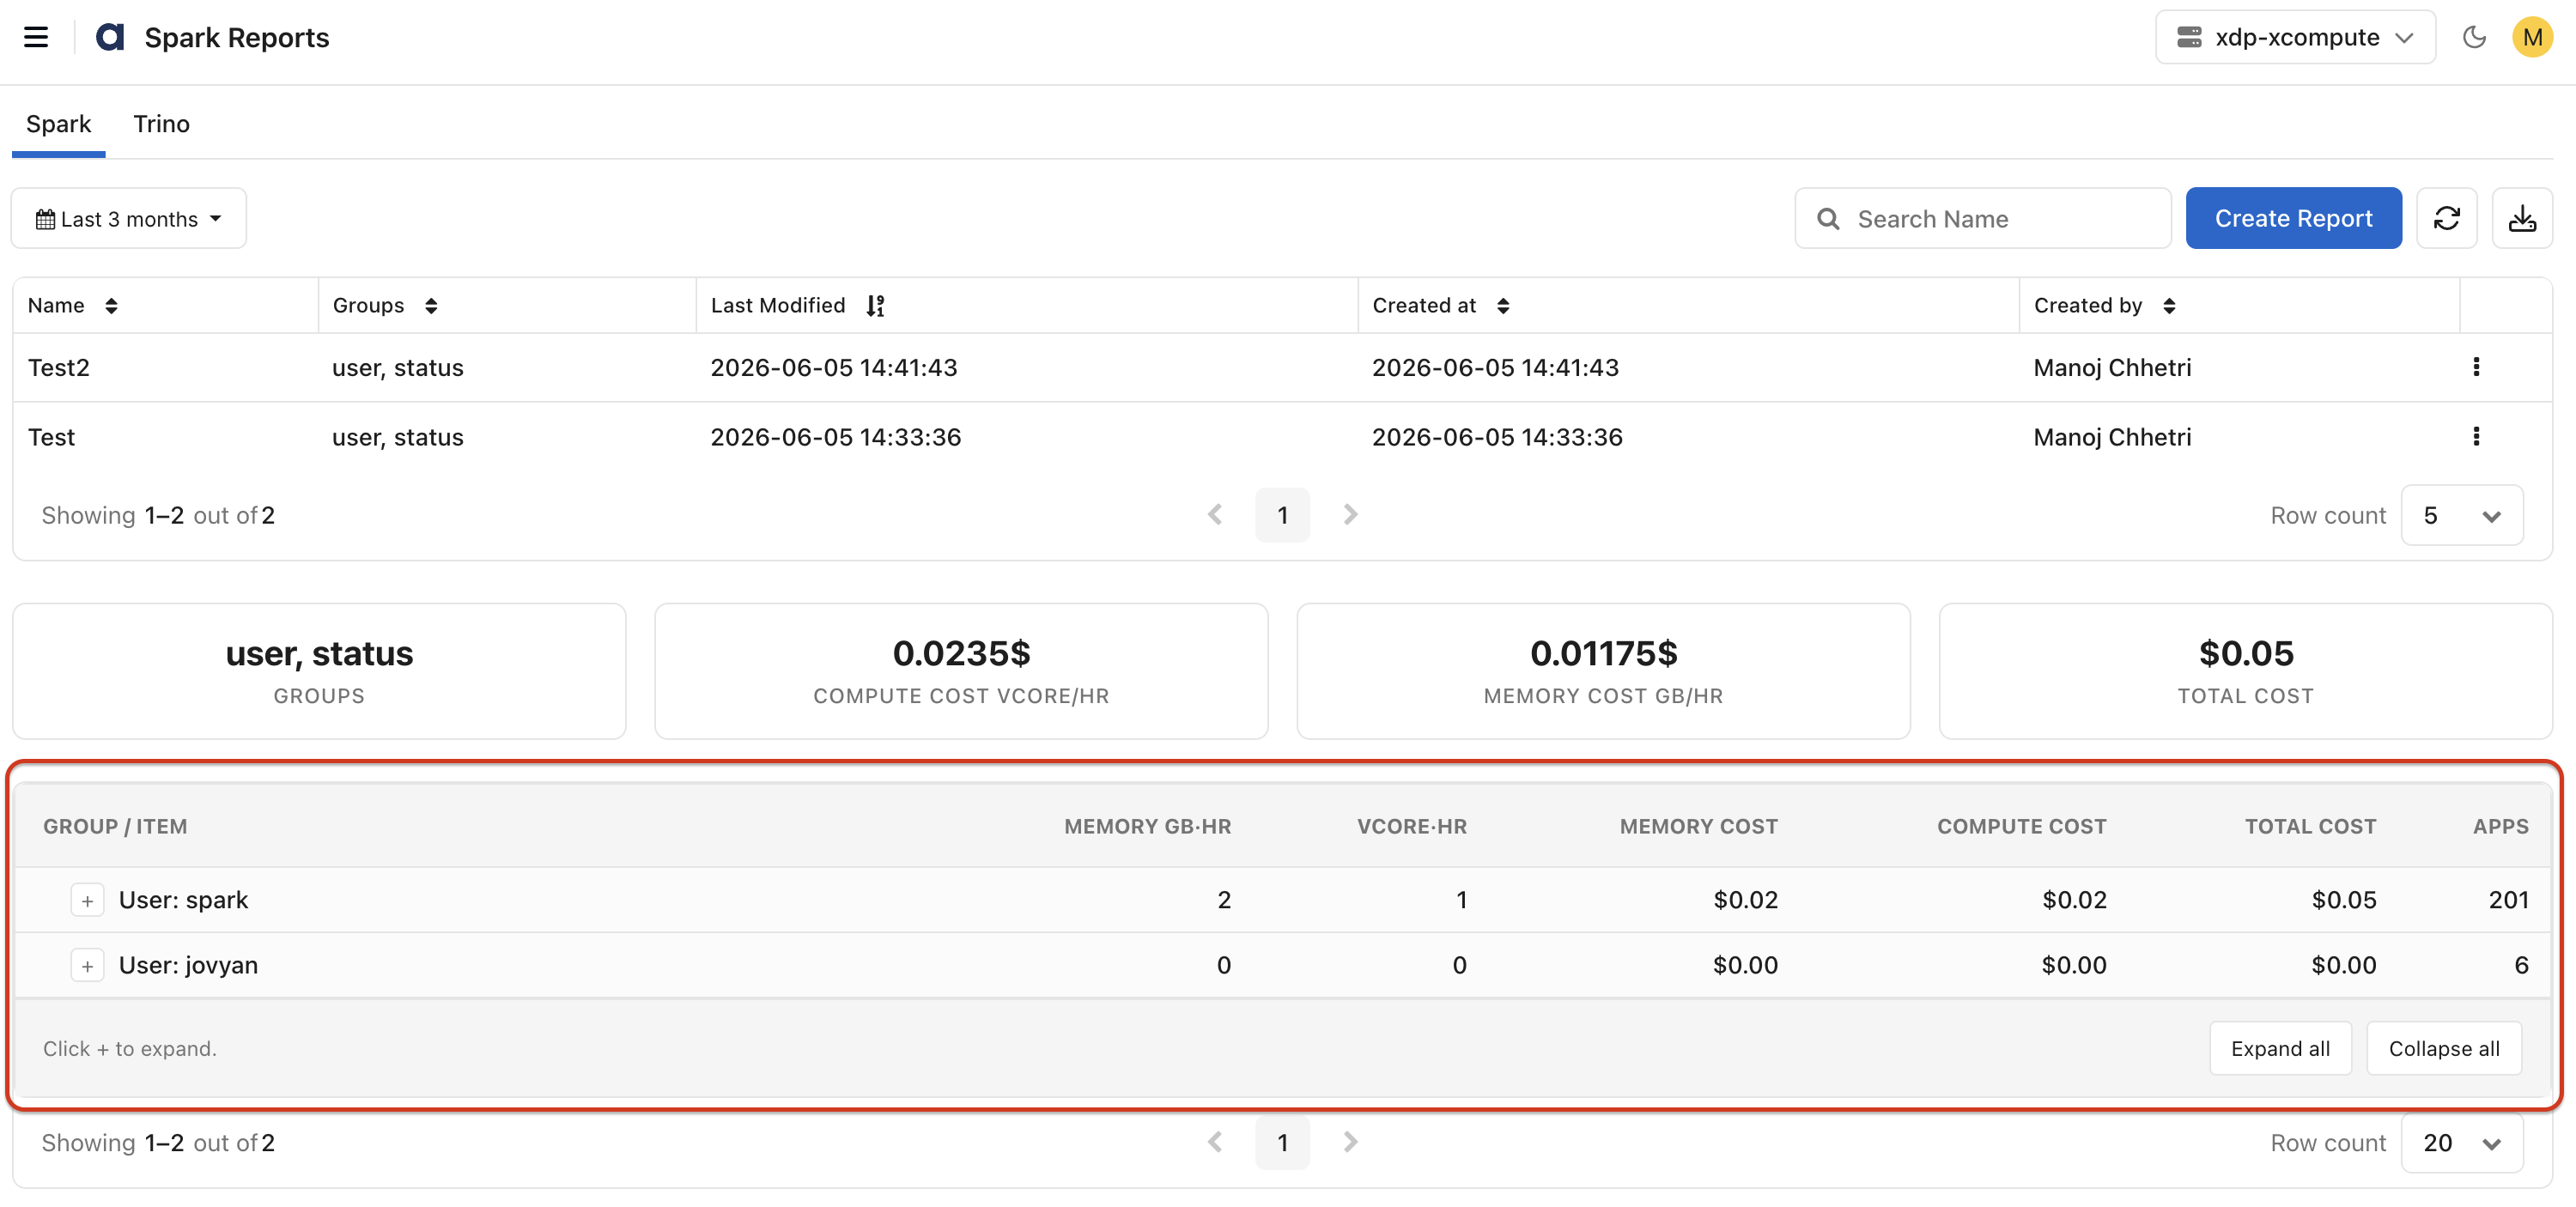
Report Data
This section displays a chargeback calculations report.
For Spark, the report includes:
Group / Item: Resource grouping hierarchy.
Duration: Total execution duration.
Applications: Number of applications or queries.
Memory Usage: Memory consumption metrics.
vCore Usage: Compute utilization metrics.
Memory Cost: Calculated memory cost.
Compute Cost: Calculated compute cost.
Total Cost: Combined compute and memory cost.
For Trino, the report includes:
Group / Item: Displays the selected grouping hierarchy.
Duration: Displays the total query execution duration.
Applications: Displays the number of queries.
Compute Cost: Displays the calculated compute cost.
Total Cost: Displays the total computed cost.
Use the expand and collapse controls to navigate hierarchical report data.
Manage Reports
For each saved report, click the three dots (:) icon, you can perform the following actions.
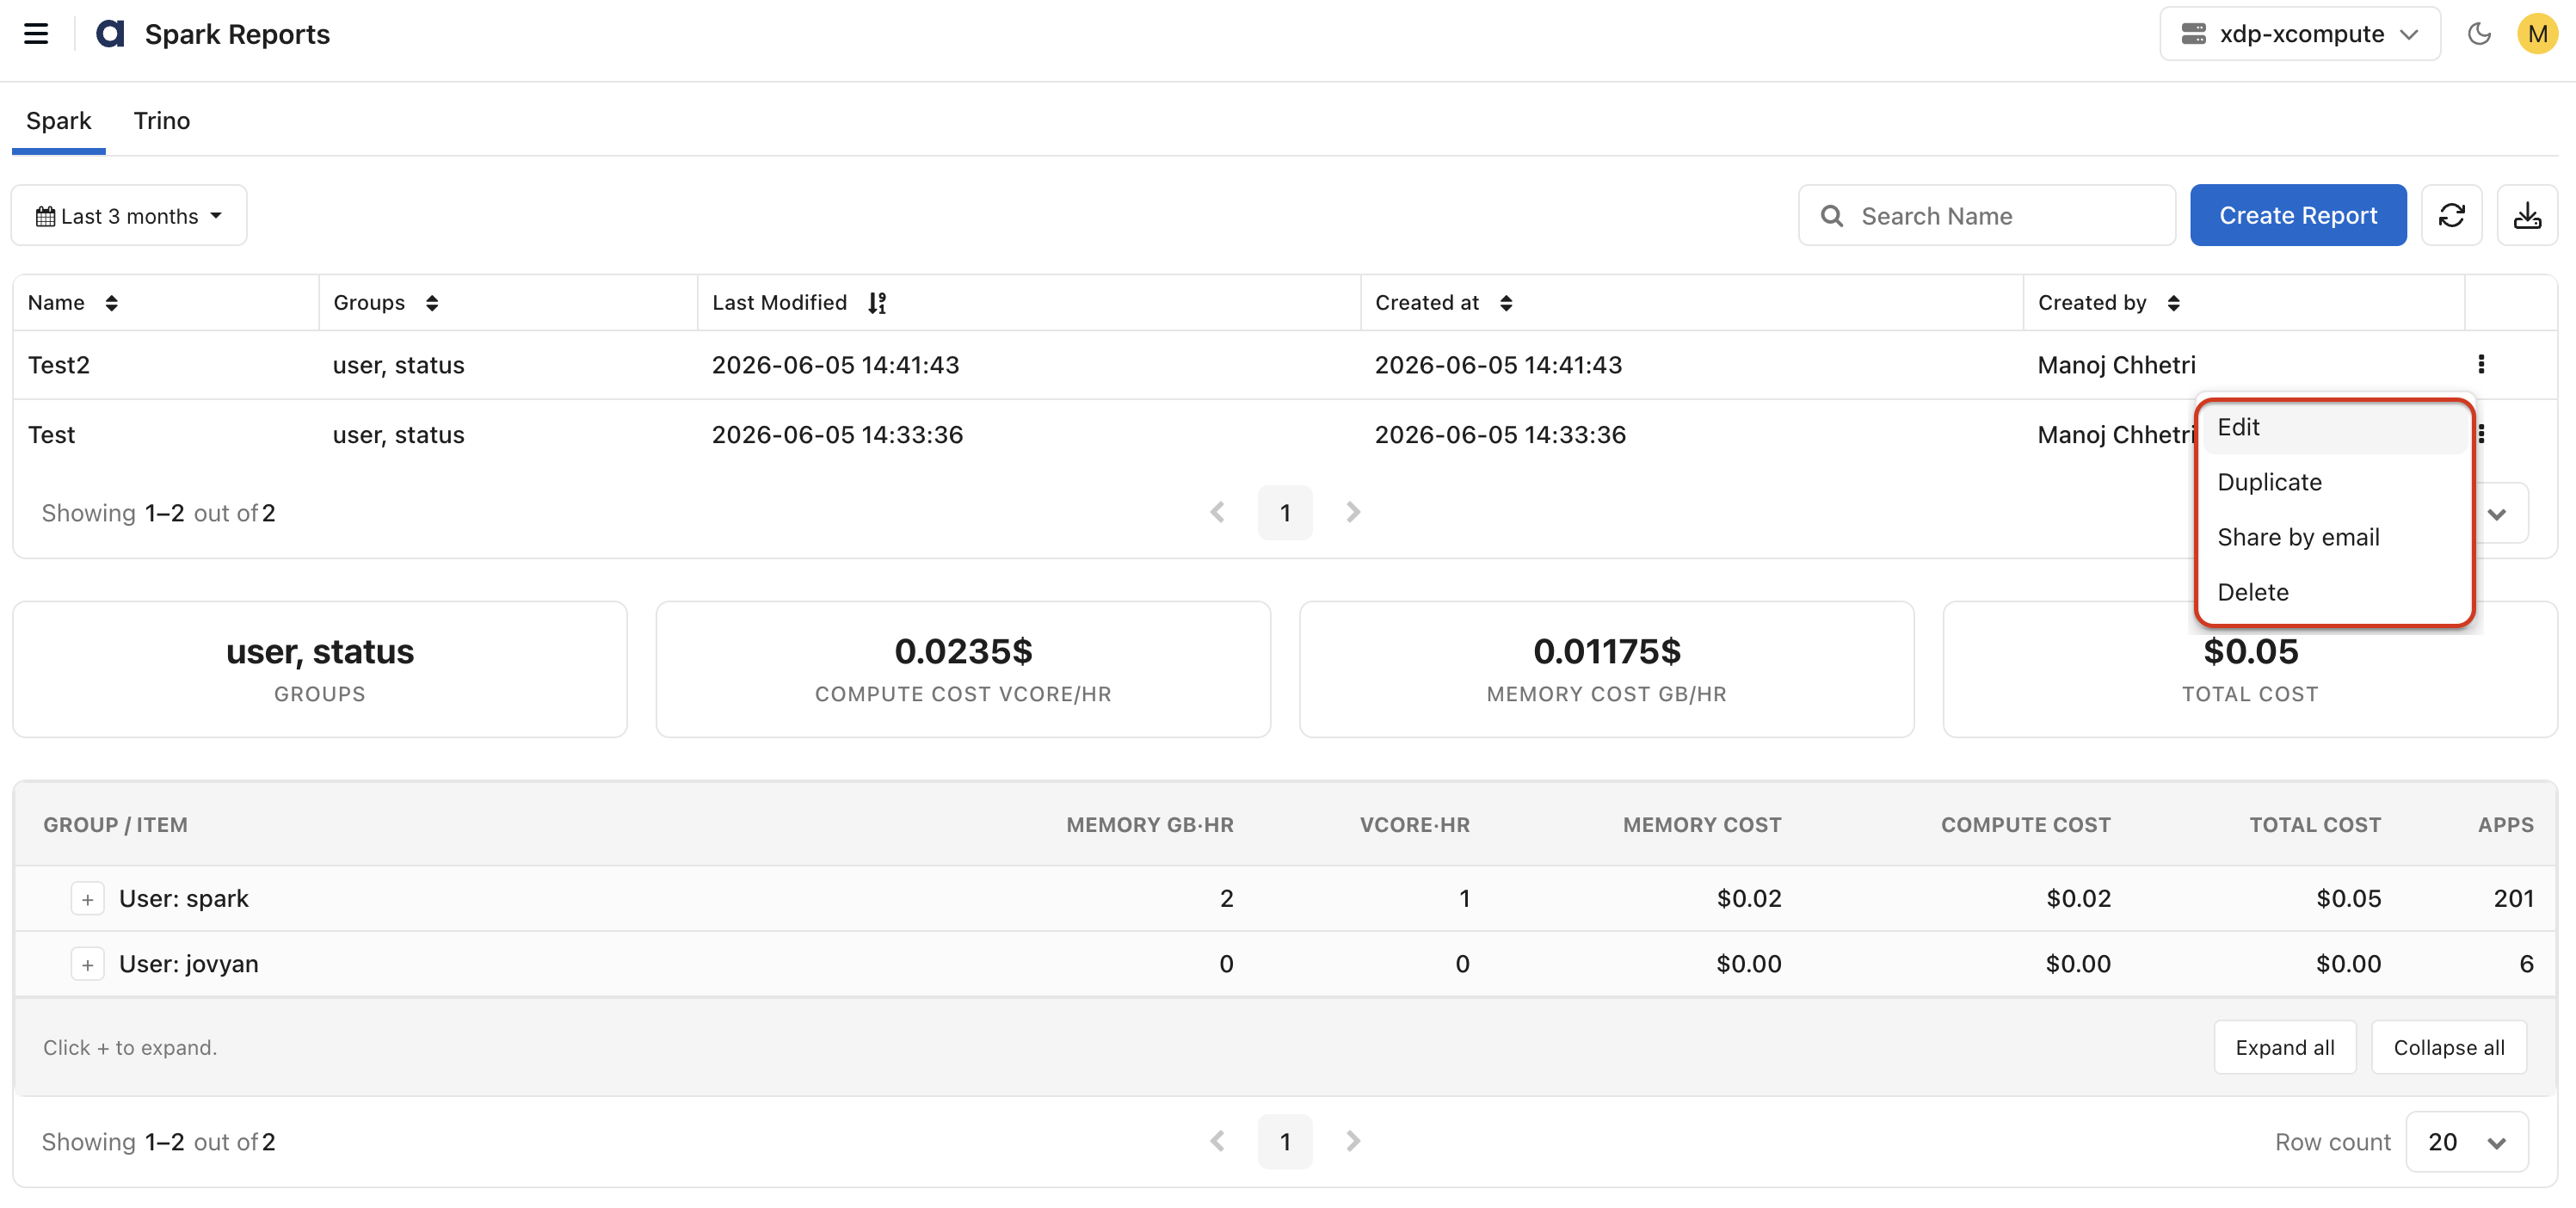
Edit: Modify the report configuration, grouping dimensions, or cost settings.
Duplicate: Create a copy of an existing report and use it as a template for a new report.
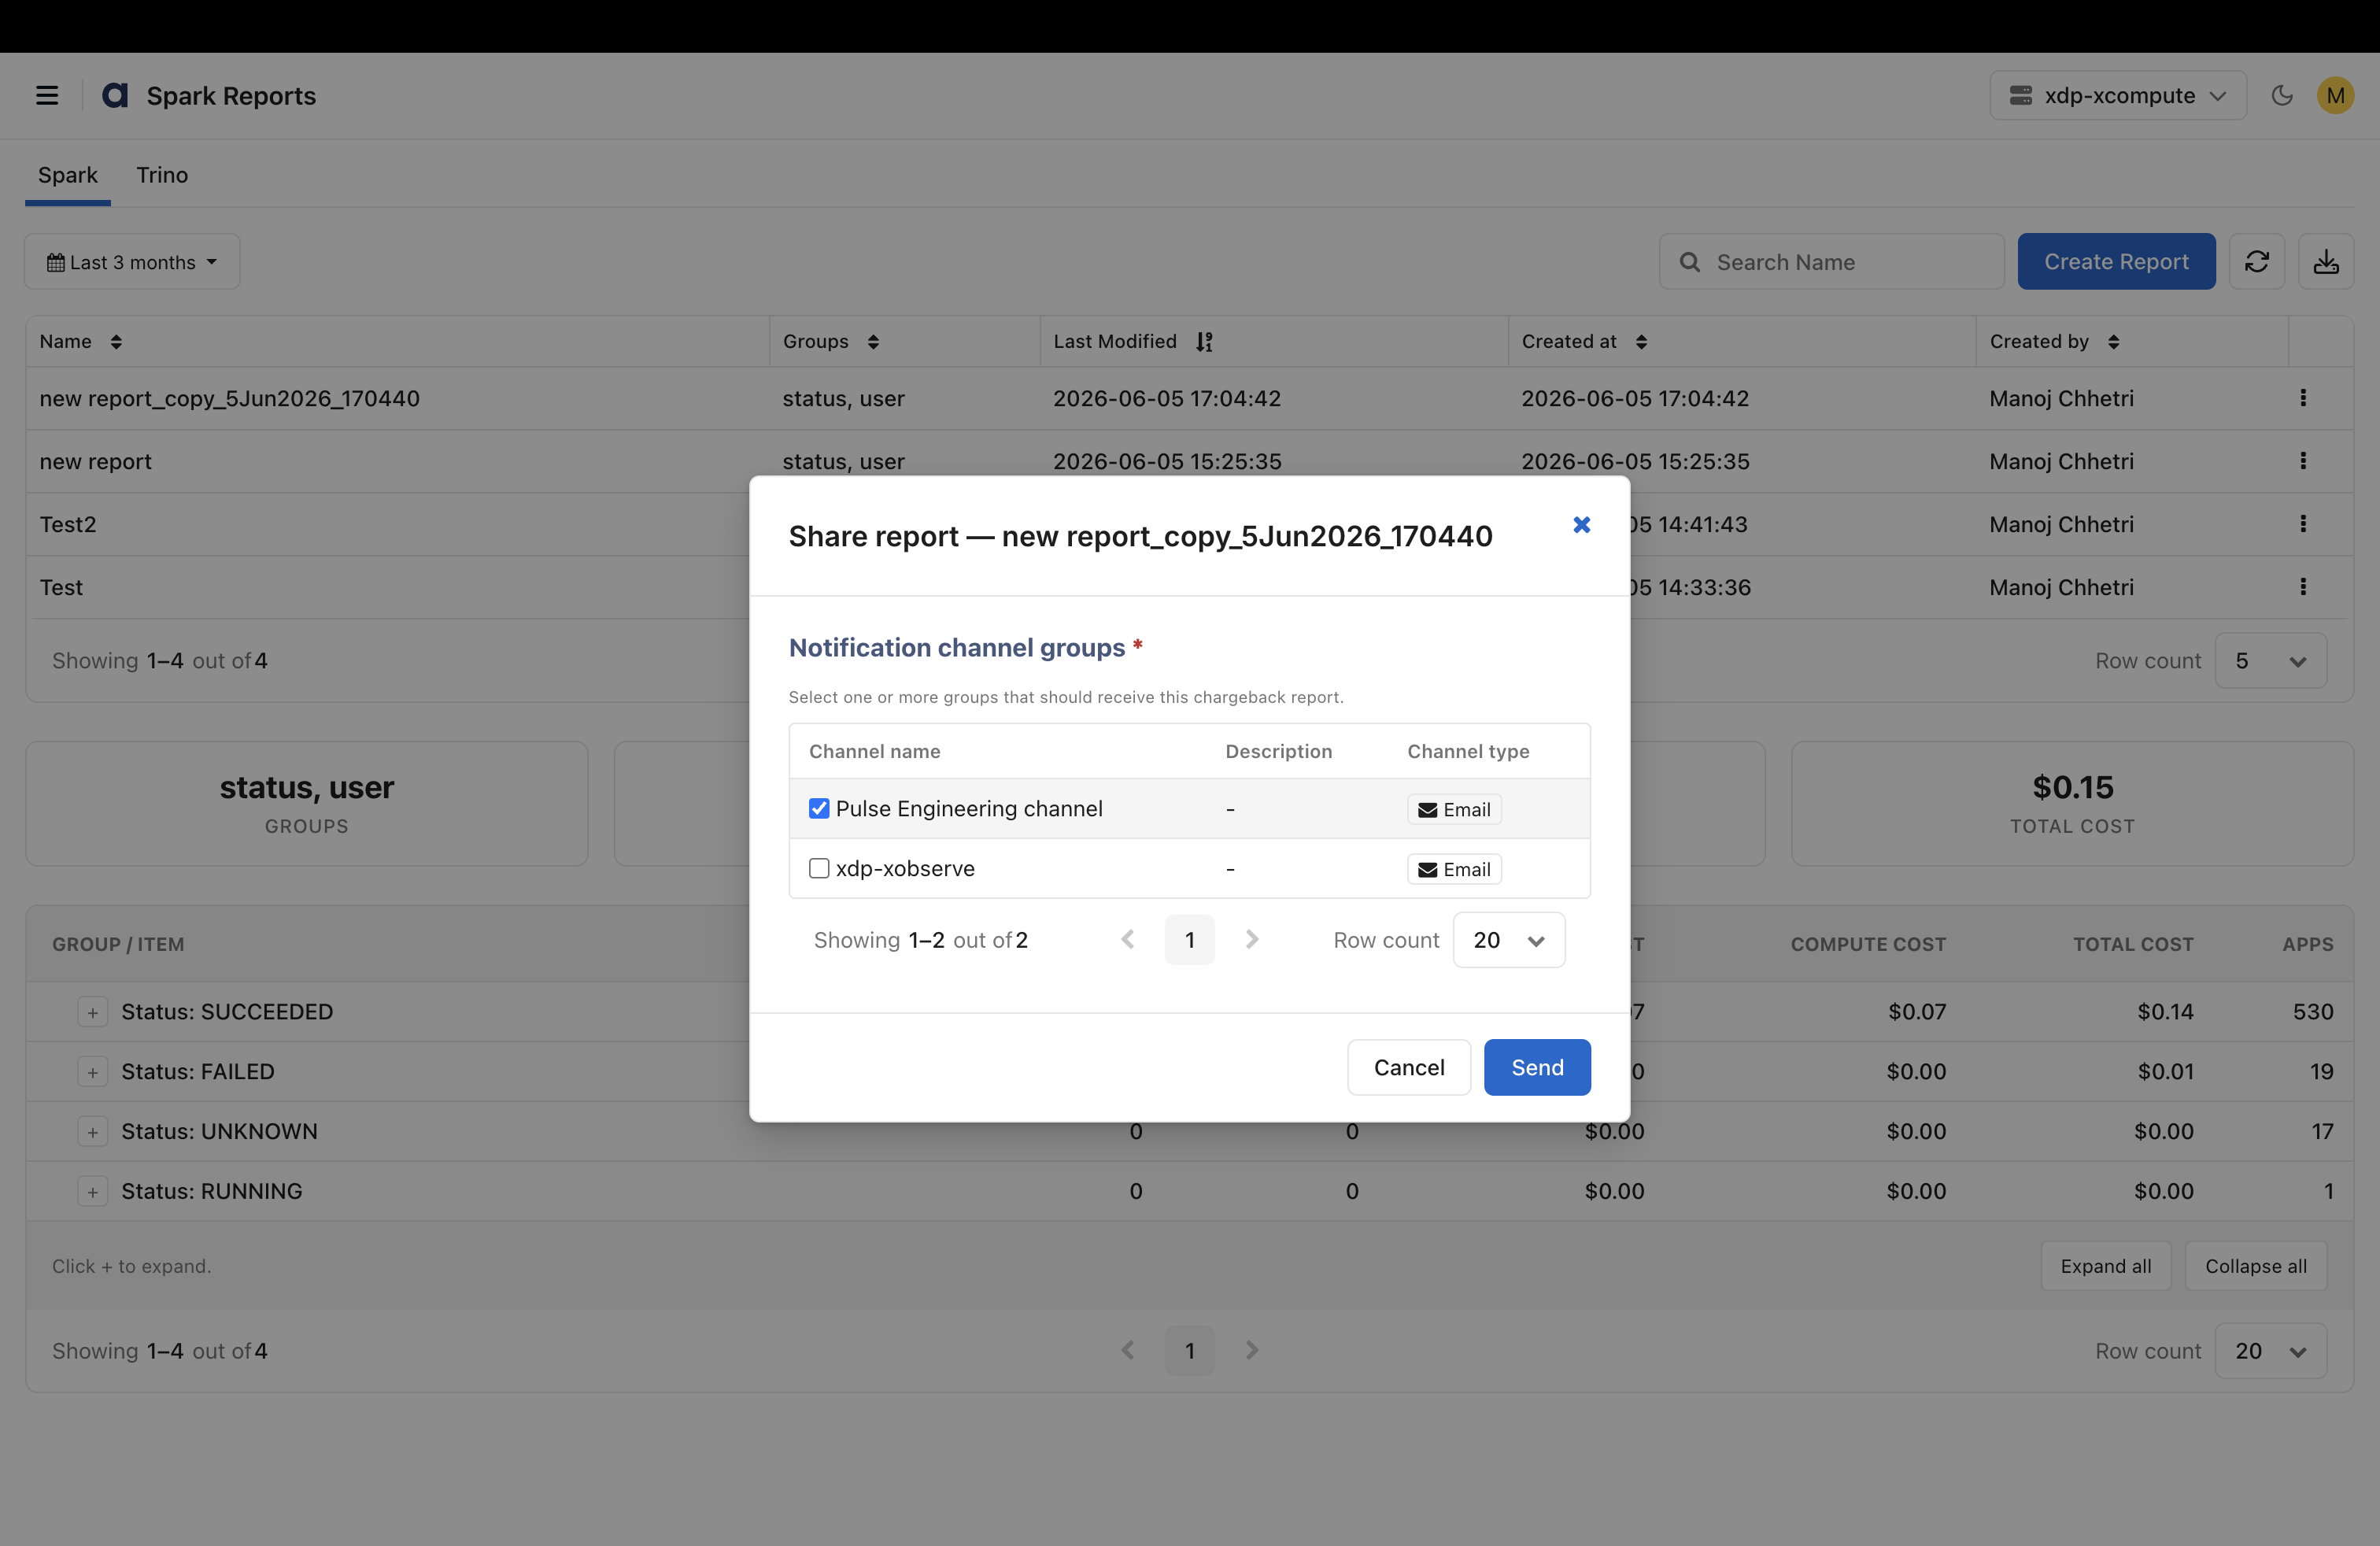
Share by Email: Send the report as an Excel file to one or more recipients.
When sharing a report, specify the notification channel groups.
For details about creating a channel group:
Go to the xDP UI and select Alerts in the left pane.
Click Alerts > Channel Groups.
Click New Channel Group.
Add the details. Once the channels are created in the xDP UI, they get listed here in the xObserve UI.
Delete: Remove the report from the system.
Export Data
Export reports for offline analysis and reporting.
To export data:
Click Download.
Select the export format.
Choose CSV and click Download. Currently, only the CSV format is supported.
Benefits of Chargeback Reporting
Provides visibility into infrastructure spending.
Enables accurate cost allocation across users and workloads.
Helps identify resource-intensive applications and queries.
Supports budgeting and capacity planning.
Improves accountability for resource consumption.
Helps optimize compute and memory utilization across the platform.