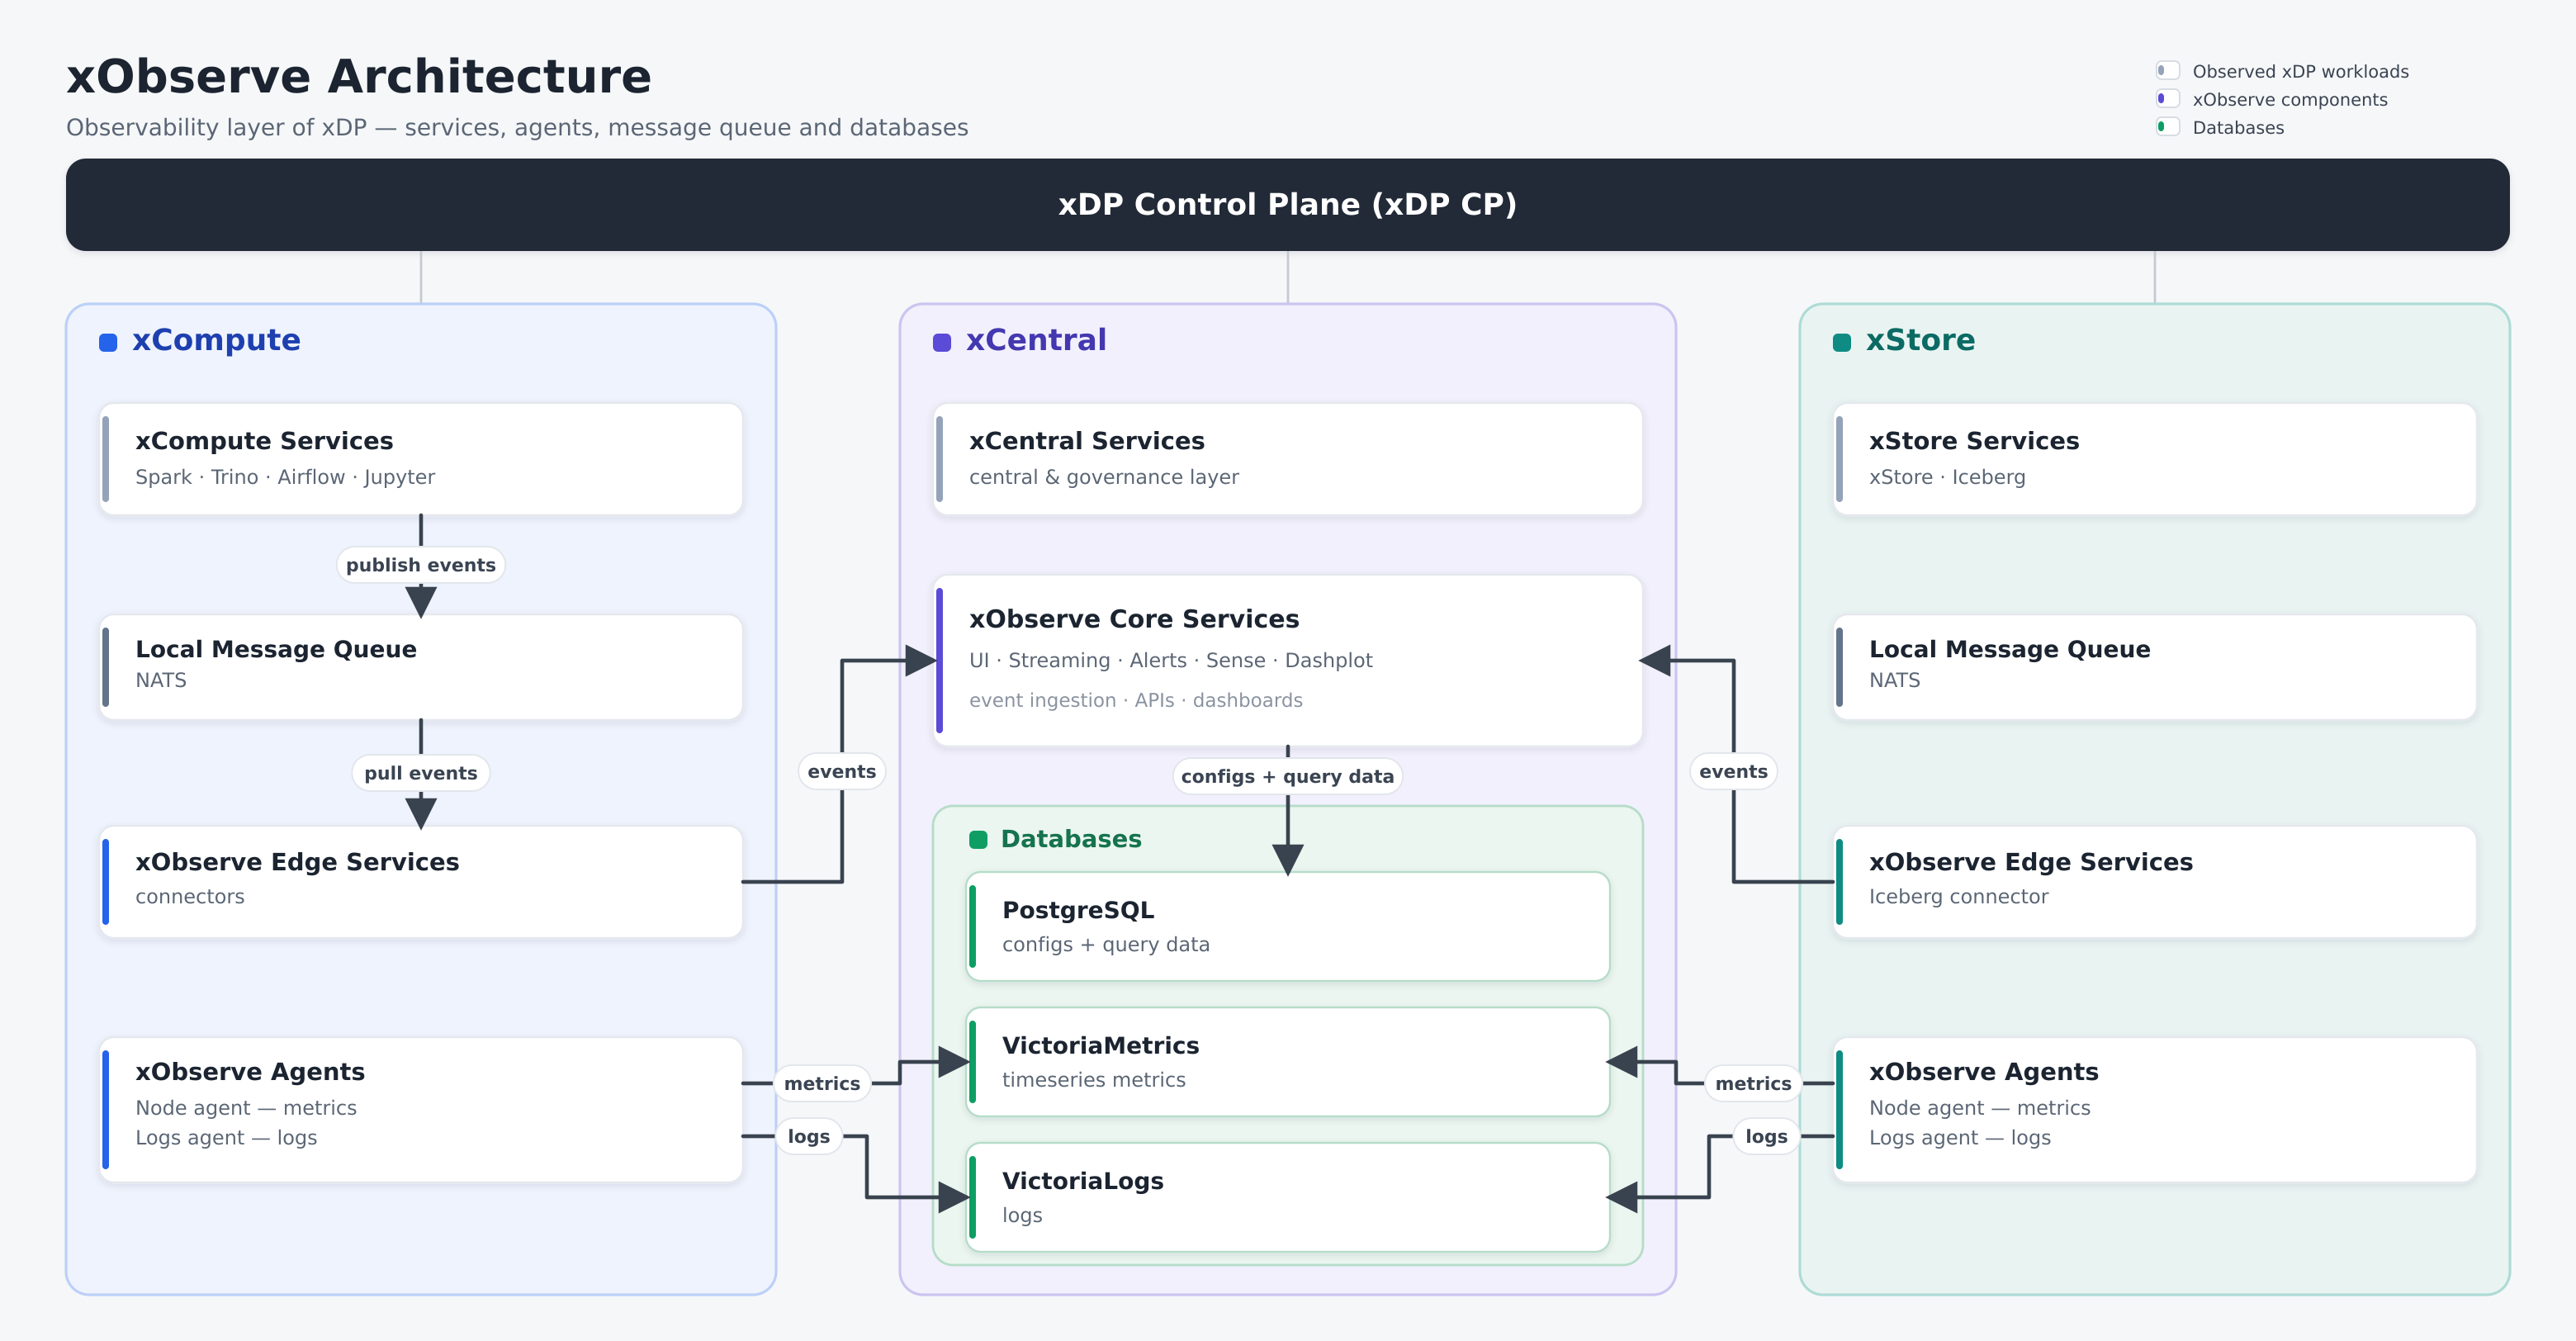
xObserve is the observability layer of xDP (Acceldata Cross Data Platform). It provides a unified view of the platform by collecting and analyzing metrics, logs, and operational events generated across xDP services.
xDP consists of three logical layers:
xCompute – The compute layer that runs workloads such as Spark, Trino, Airflow, Jupyter, etc.
xStore – The storage layer that includes xStore and Iceberg.
xCentral – The central management and governance layer that hosts xObserve core services and databases.
The xDP Control Plane (xDP CP) deploys and manages all platform components. xObserve runs alongside the workloads it monitors in each layer, while xCentral serves as the central hub for data ingestion, storage, and visualization.
Architecture Components
xCompute
The xCompute layer hosts compute workloads and observability components that monitor those workloads.
Components:
xCompute Services (Spark, Trino, Airflow, Jupyter, etc.)
Local Message Queue (NATS)
xObserve Edge Services (connectors)
xObserve Agents
xStore
The xStore layer hosts storage services and observability components for storage monitoring.
Components:
xStore Services (xStore, Iceberg)
Local Message Queue (NATS)
xObserve Edge Services (Iceberg connector)
xObserve Agents
xCentral
The xCentral layer acts as the central observability and governance hub.
Components:
xCentral Services
xObserve Core Services
Databases
Core Building Blocks
xObserve Core Services
xObserve Core Services run in xCentral and form the heart of the observability platform.
Core Services are responsible for:
Event ingestion
API services
User interface
Dashboards
Alerting
Streaming and data processing
All observability data ultimately flows through Core Services before being stored or presented to users.
xObserve Edge Services
Edge Services are deployed within each monitored layer and act as connectors between local workloads and xObserve Core Services.
Examples include:
Compute connectors in xCompute
Iceberg connector in xStore
Edge Services collect operational events from local services and forward them to xCentral.
xObserve Agents
Agents are deployed on each data plane and collect infrastructure telemetry.
Two agent types are used:
Node Agent – Collects metrics
Logs Agent – Collects logs
Message Queue (NATS)
Each data plane includes a local NATS message queue.
The queue:
Buffers events from workloads
Decouples producers from consumers
Provides reliable event delivery to Edge Services
Databases
xObserve stores different types of observability data in dedicated databases hosted in xCentral.
PostgreSQL stores configuration and query data.
VictoriaMetrics stores time-series metrics collected from monitored workloads and infrastructure.
VictoriaLogs stores logs collected by xObserve agents.
These databases enable xObserve to centrally store, query, and analyze observability data collected across xDP.
Telemetry Flow
xObserve processes three types of telemetry across the platform.
Events Flow
Operational events generated by platform services are collected and forwarded to xCentral.
xCompute
xCompute services publish events.
Events are written to the local NATS queue.
xObserve Edge Services consume events from NATS.
Edge Services forward events to xObserve Core Services.
Core Services persist configuration and query data in PostgreSQL.
xStore
xStore services generate storage-related events.
The Iceberg connector collects the events.
Events are forwarded to xObserve Core Services.
Core Services store the data in PostgreSQL.
Metrics Flow
Node Agents collect infrastructure and platform metrics.
Metrics are sent directly to VictoriaMetrics in xCentral.
Core Services query VictoriaMetrics to power dashboards, analytics, and alerting.
Logs Flow
Logs Agents collect logs from workloads and infrastructure.
Logs are sent directly to VictoriaLogs in xCentral.
Core Services query VictoriaLogs for log analysis and troubleshooting.
End-to-End Observability
By combining:
Events from workloads and services
Metrics from infrastructure and applications
Logs from platform components
xObserve provides a single observability platform for monitoring the health, performance, and operational state of xDP.