Nodes
Nodes Dashboard
The Nodes dashboard provides detailed information about processes and services installed in one or multiple nodes. The following image displays the dashboard options.

Dashboard
Overall
The Overall tab displays the following information of connected nodes.
- Services
- Utilization
Services
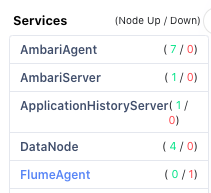
The Services tile displays the list of services in the node and the count of nodes that are currently active. As an example, in the following screenshot, AmbariAgent service is up on all 7 nodes and FlumeAgent is down on one node.

Hover over the node count to view the nodes that are up or down.
Utilization
The Utilization tile displays the heatmap of all connected nodes for the last one hour by default at a time interval of two minutes as shown in the following image.

Heatmap
To view statistics from a custom date range, click the calendar icon and select a time frame and timezone of your choice.
For every node, you can view the heatmap for the following metrics: To change the metric, click the drop-down next to the Metric label and click a metric of your choice.
| Metric | Description |
|---|---|
| CPU Usage | The amount of CPU utilized (in %). |
| Load | The average of the number of tasks waiting in a kernel run queue over a period of time. |
| Mem Usage | The amount of memory utilized (in %). |
| Container Count | The number of YARN containers running on a node. |
Search Option
To search a record in the Nodes, perform the following
- Click the search bar located in the top of the Utilization Chart.
- Select the required parameters from the drop down menu for the value you are searching for. For example, if you are searching for host hdp1002, select 'Host" from the drop-down, then =, followed by the name from the drop-down menu in the search bar.
- Press enter or click Search.

Search Option
For String Data type fields, you can use the =~ operator. This operator allows you to search strings by entering partial string. You can also use regular expressions to search a required value.
Sort By
You can sort the Utilization heatmap by the following preferences:
- Host
- Min Utilization
- Max Utilization
Filtering
You can apply filter to the name of the Host and Node Label. To apply filter, perform the following:
- Click on the Host or Node Label for which you want to apply the filter. A drop-down list is displayed with the list.
- Select the option from the list. The details for the selected option are displayed.
- (Optional) You can search by using the search box in the drop-down list.
- (Optional) Select All to clear the applied filter (or) click Reset to clear the applied filter.
Searching
You can use the search box to search for a job. To know more on how to search a job using search box, see Searching in Pulse.
Utilization Table
The Utilization table displays the following metrics for nodes:
| Metric | Description |
|---|---|
| Checkbox | Click the checkbox to select or deselect host. |
| Host | The host name. Click on the host name to view details of the host in the Node Details page. |
| Application Status | The status of the application, either connected or disconnected. Click the icon to view the list of applications. |
| Type | The type of node, either Compute Node or Data Node. |
| Load | The average of the number of tasks waiting in a kernel run queue over a period of time. |
| CPU Usage % | The amount of CPU utilized (in %). |
| Disk Usage $ | The amount of disk utilized (in %). |
| Read Time | The time taken to perform read operations in the node. |
| Write Time | The time taken to perform write operations in the node. |
| Mem Usage % | The amount of memory utilized (in %). |
| # of Container | The number of YARN containers running on a node. |
| Logs | The log file of the node. Click the log icon to display the Logs. |
Following is a view of how to adjust the width of the column manually:

Click the
Viewing Summary
To view aggregated summary details of two or more nodes, select any two more nodes from the Utilization table and click View Summary button. The aggregated details for the selected host are displayed in the Node Aggregated Details page.
Acceldata Utilization
The Acceldata Utilization tile displays the usage of the following Acceldata metrics on your cluster.
| Metric | |
|---|---|
| Data In Out Per Sec | The amount of incoming and outgoing data. This data is tracked in the form of Received Bytes and Transfer Bytes. |
| Acceldata CPU Usage | The amount of CPU utilized. You can monitor the following CPU metrics: - filebeat - Telegraf |
| Acceldata Memory Usage | The amount of memory utilized. You can monitor the following memory-related metrics: - filebeat - Telegraf |
For CPU usage and Memory usage charts, you can view the utilization by host. Click the drop-down in the top right corner of the chart and select a host.
Why is there no data being displayed for JVM GC Count and JVM GC Time on the Node Details page for Spark Master and Spark Worker Nodes ?
These charts are not supported for Spark in the current release. In a future release, this will be supported.