Creating Alerts
This article describes the process of creating alerts. Acceldata recommends you to view the Alerts document and then proceed with this doc.
You can create an alert by two methods:
- Using the Alert Wizard: This method has five stages. You must configure each stage to create an alert.
- Using JSON: You must import a JSON file and edit the code to create an alert or switch to JSON mode and type the code.
You can switch between Wizard and JSON methods as displayed in the following image.
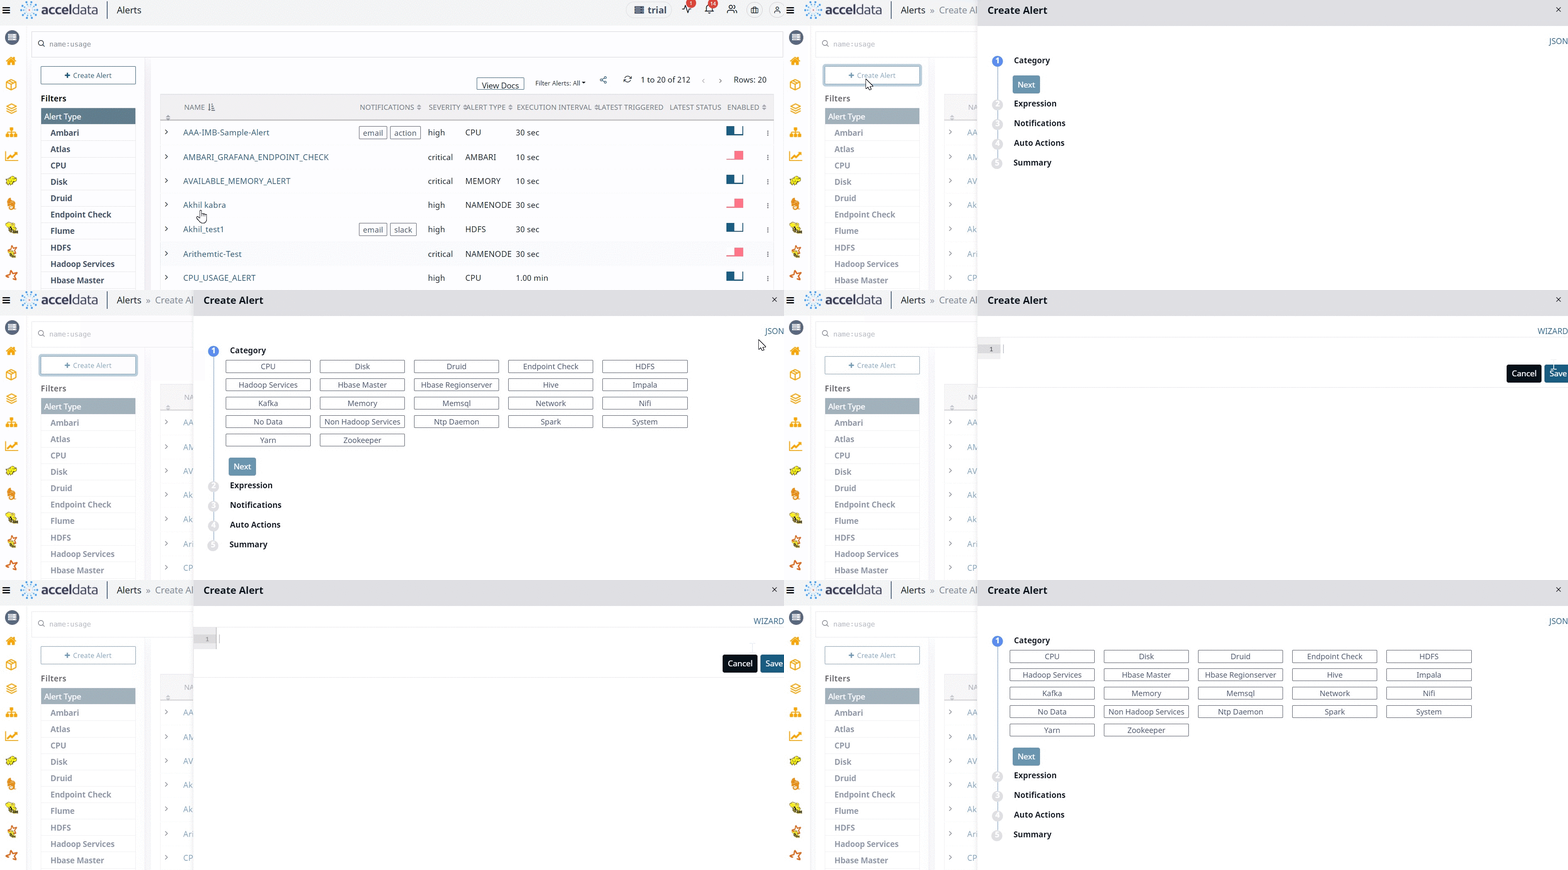
When you configure an alert from the alert Wizard, the corresponding JSON code is automatically provided by Pulse. Similarly, when you create an alert using the JSON method, either by importing a JSON file or by typing the code from scratch, the corresponding changes are automatically done in Wizard, by Pulse.
To create an alert from the JSON method, you must have prior knowledge of JSON coding. Explaining JSON code to create alerts is beyond the scope of this document. The following section describes each component of the alert Wizard and the procedure to create alerts.
Create Alerts with the Alert Wizard
The alert Wizard has five stages. You must configure the alert settings at each stage to create an alert. The five stages are described as follows.
Category
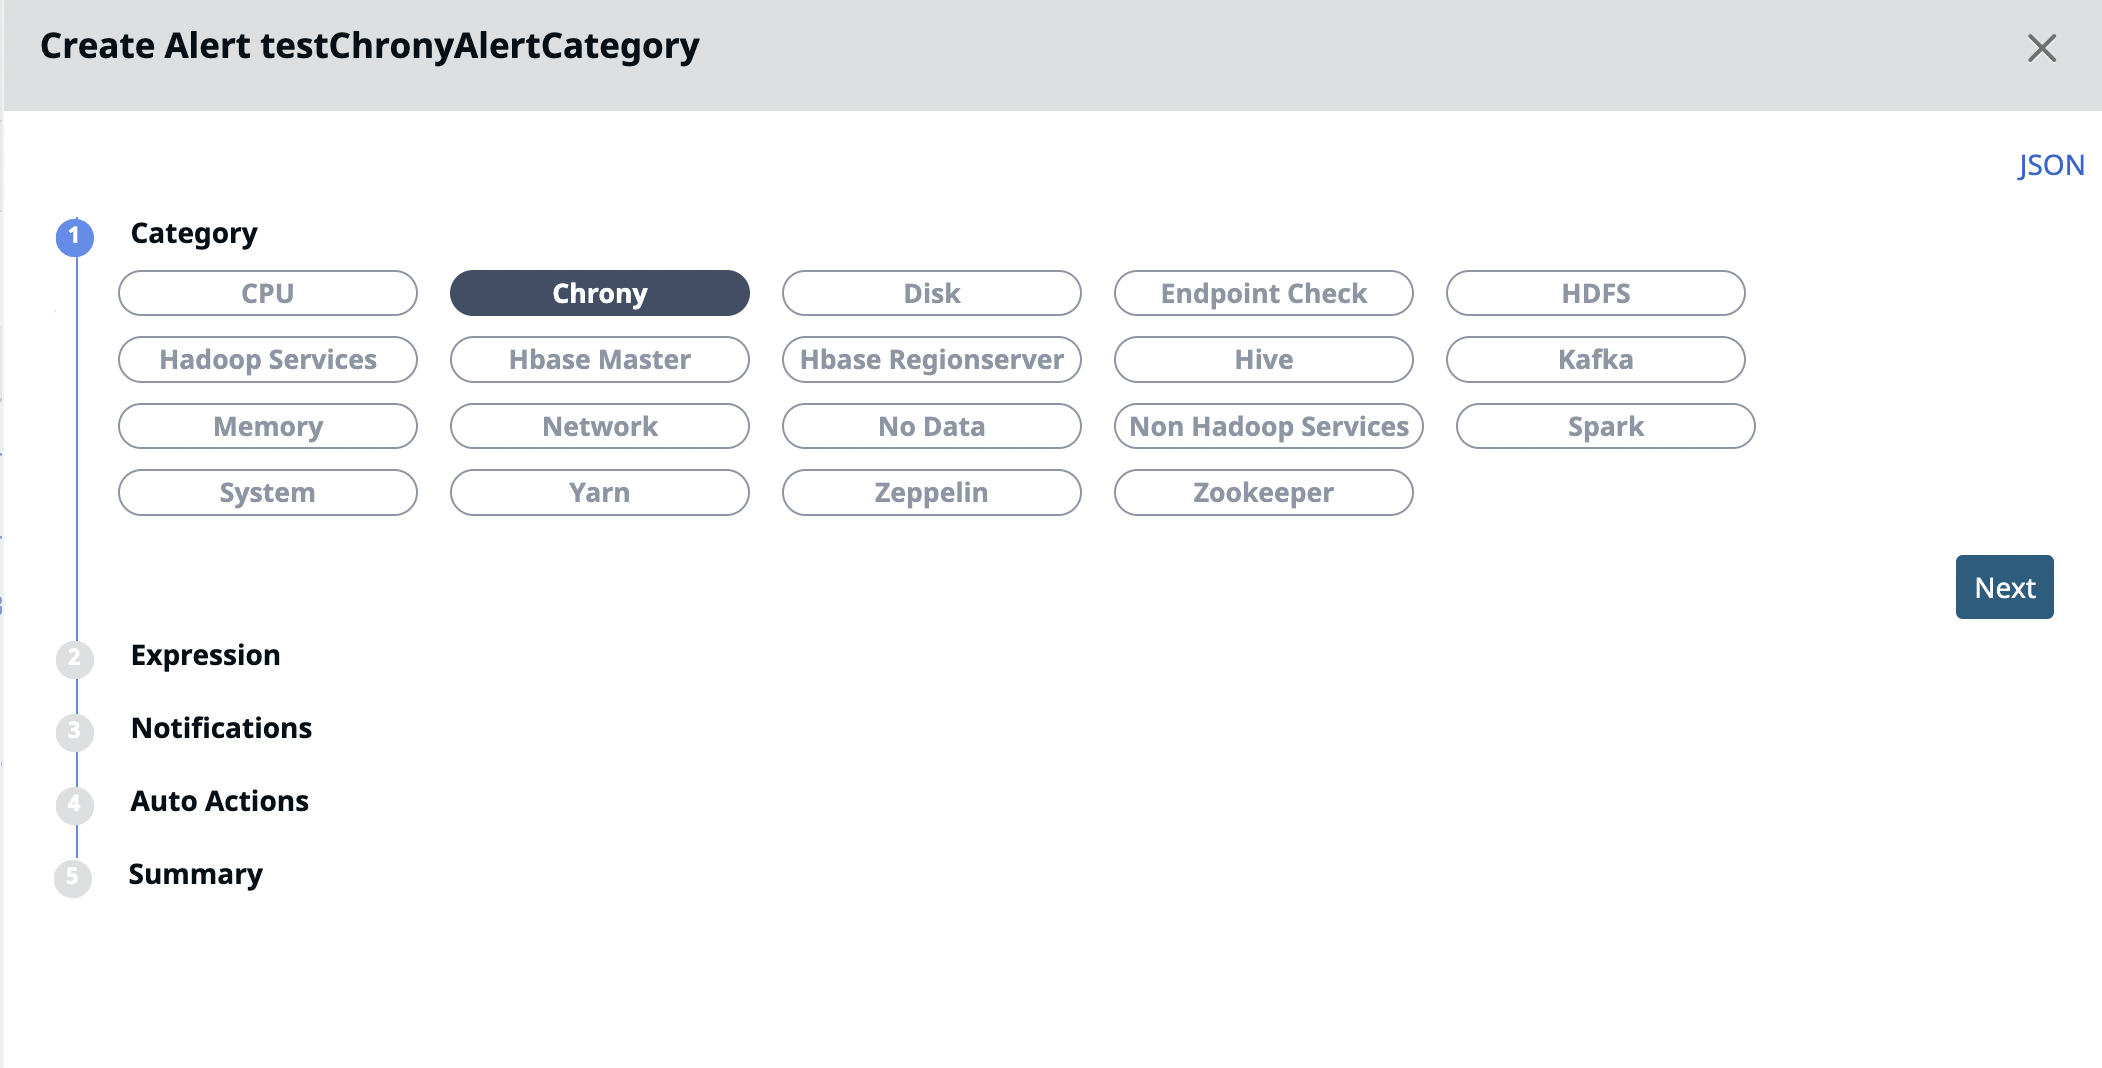
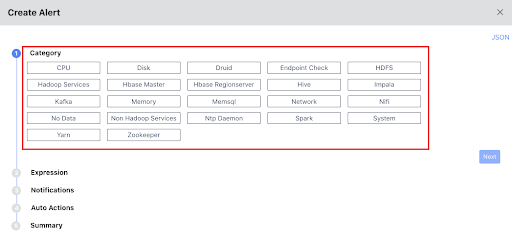
All the alert metrics are grouped into various Categories. In this stage, you must select a Category for which you want to create an alert. Once you select a Category, you must configure the metrics related to the selected Category, in the subsequent stages. Pulse provides you 23 categories for which you can create alerts. The 23 categories are listed in the following image.
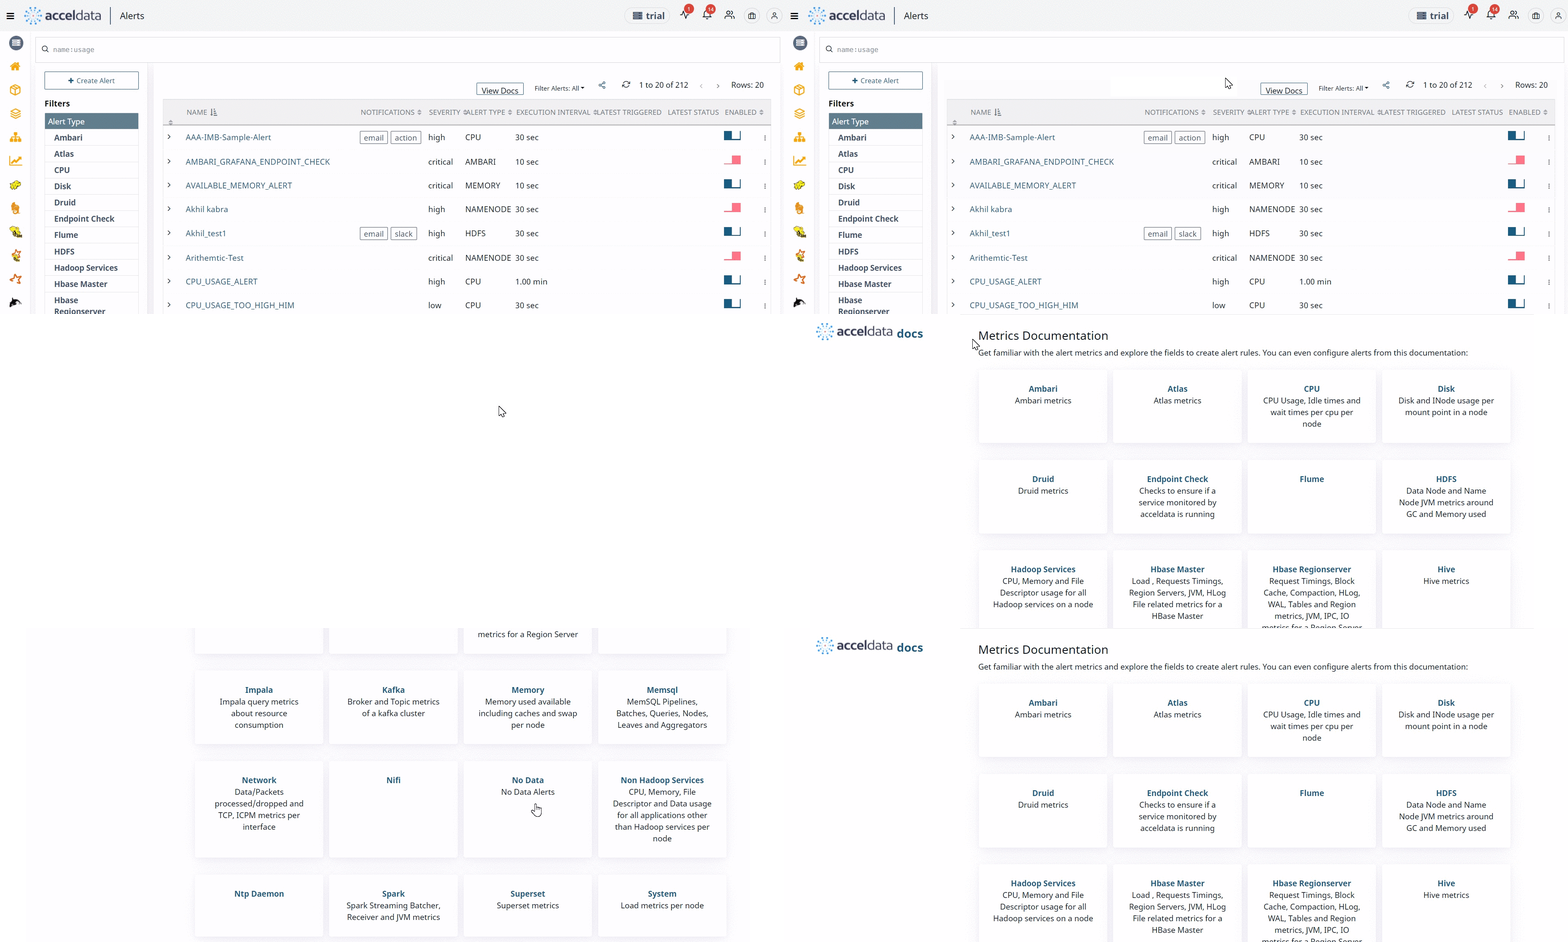
For more information about each Category, click the View Docs link. This link opens the Category documentation in a new tab.
Expression
In this stage, you must select a metric and set filter conditions on the selected metric. The metrics displayed are based on the selected Category and vary for each Category.
If you select a Category, other than Endpoint Check and No Data, you must configure the following sub stages, irrespective of the metric selected.
Define Alert Conditions
You must configure this sub stage only after you select a metric. In this sub stage, you must configure a filter for your metric. These filters are the alert conditions. If the conditions are matched during an alert evaluation, the alert triggers notifications and performs actions, as configured by you.
If you want to set an alert when the CPU usage time for interrupt requests (IRQs) exceeds a certain limit, you must select CPU as the Category, CPU metrics as the metric, and set the filter condition on the cpu_usage_irq option.
The following image sets an alert condition if the sum of IRQ usage time of the CPU on all hosts and servers is more than 10000 seconds.
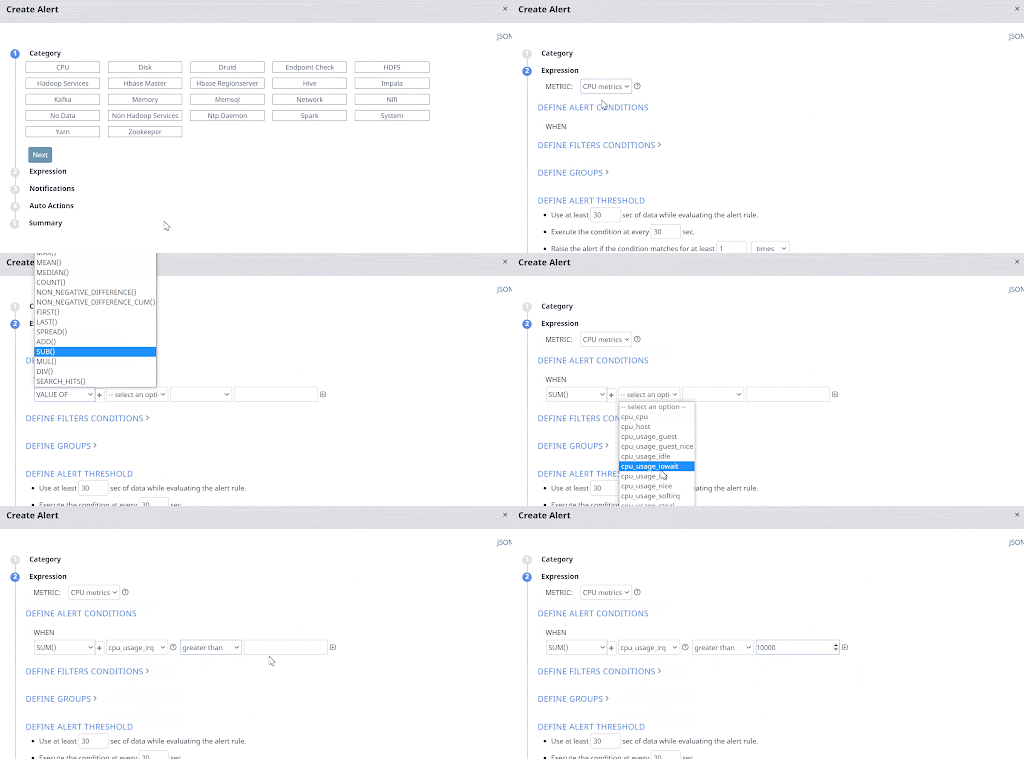
You must add multiple filter conditions to make your alert more robust. You must configure either the AND or OR logic between conditions, if you set multiple conditions.
Note:
- If you configure the AND logic, the alert is raised only when all the conditions are matched. If you configure the OR logic, the alert is raised even if a single condition is matched.
- Some of the alert fields have tooltips associated with them to help you understand the field better.
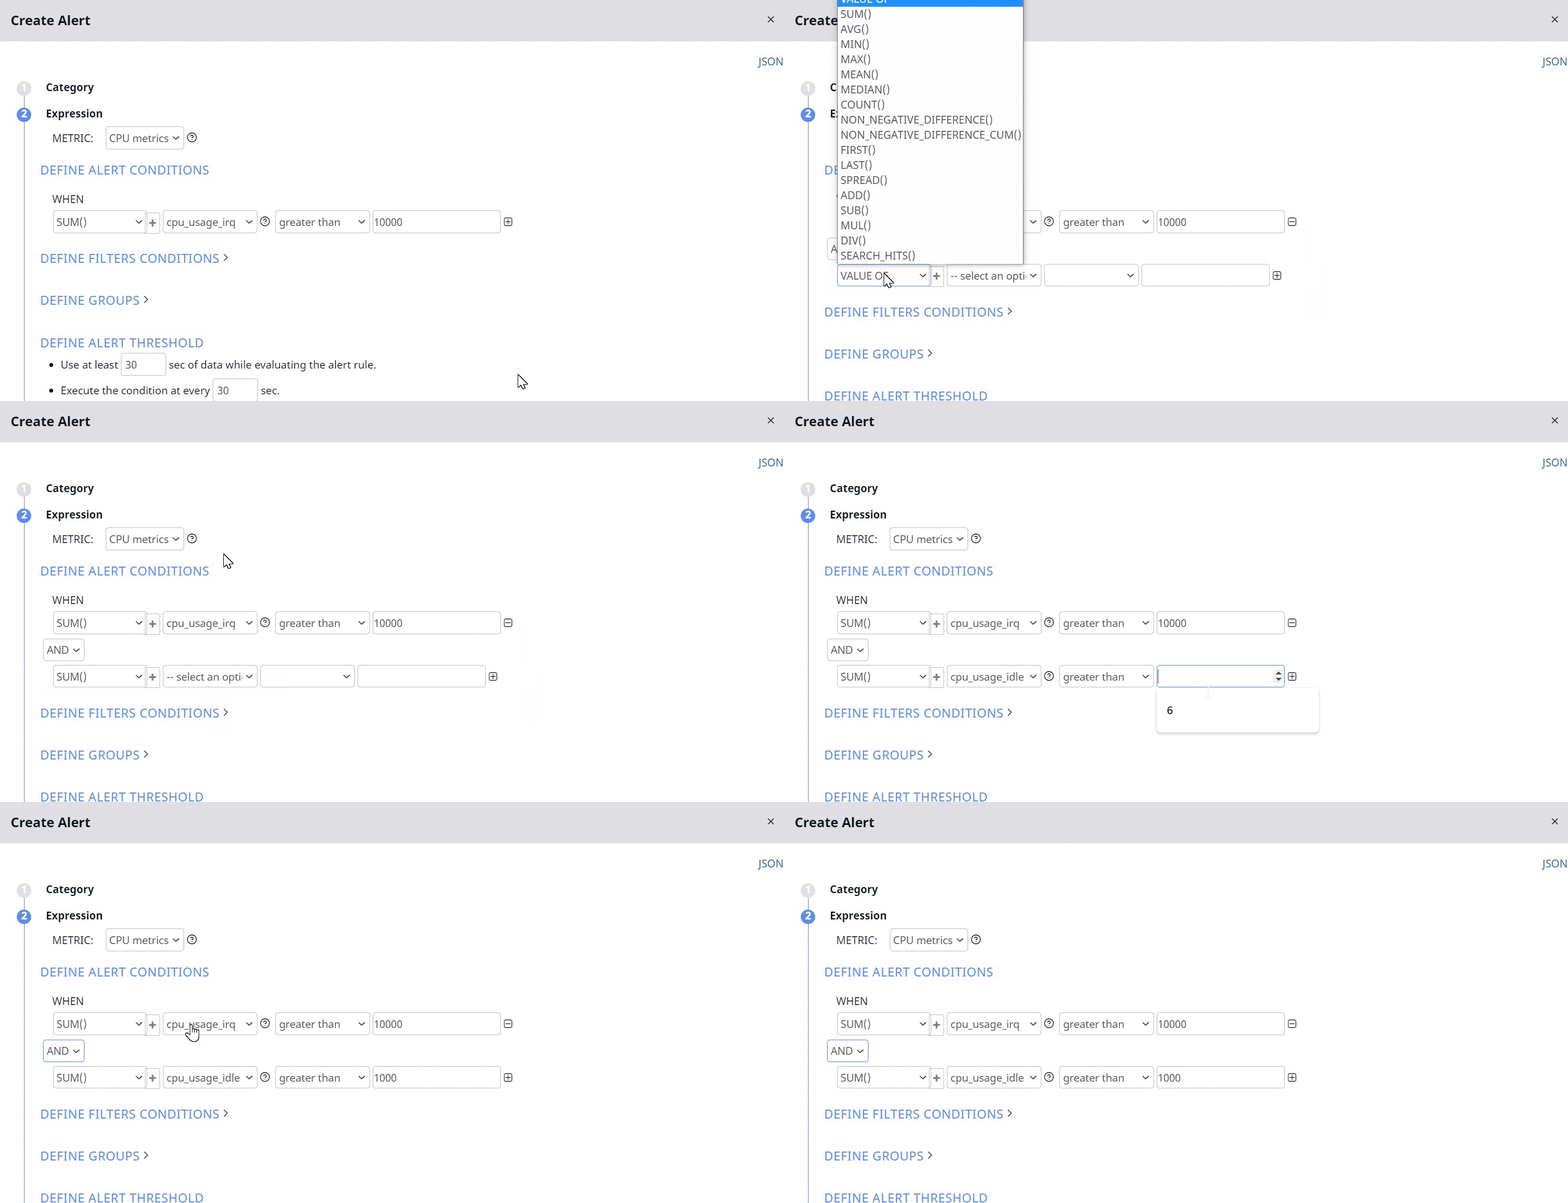
Now the alert is raised only if the two following conditions are matched:
- Sum of CPU usage by IRQ of all the hosts is greater than 10000 seconds.
- Sum of CPU idle time of all the hosts is greater than 1000 seconds.
If you configure the OR logic, the alert is raised, even if one of the above conditions is matched.
Define Filter Conditions
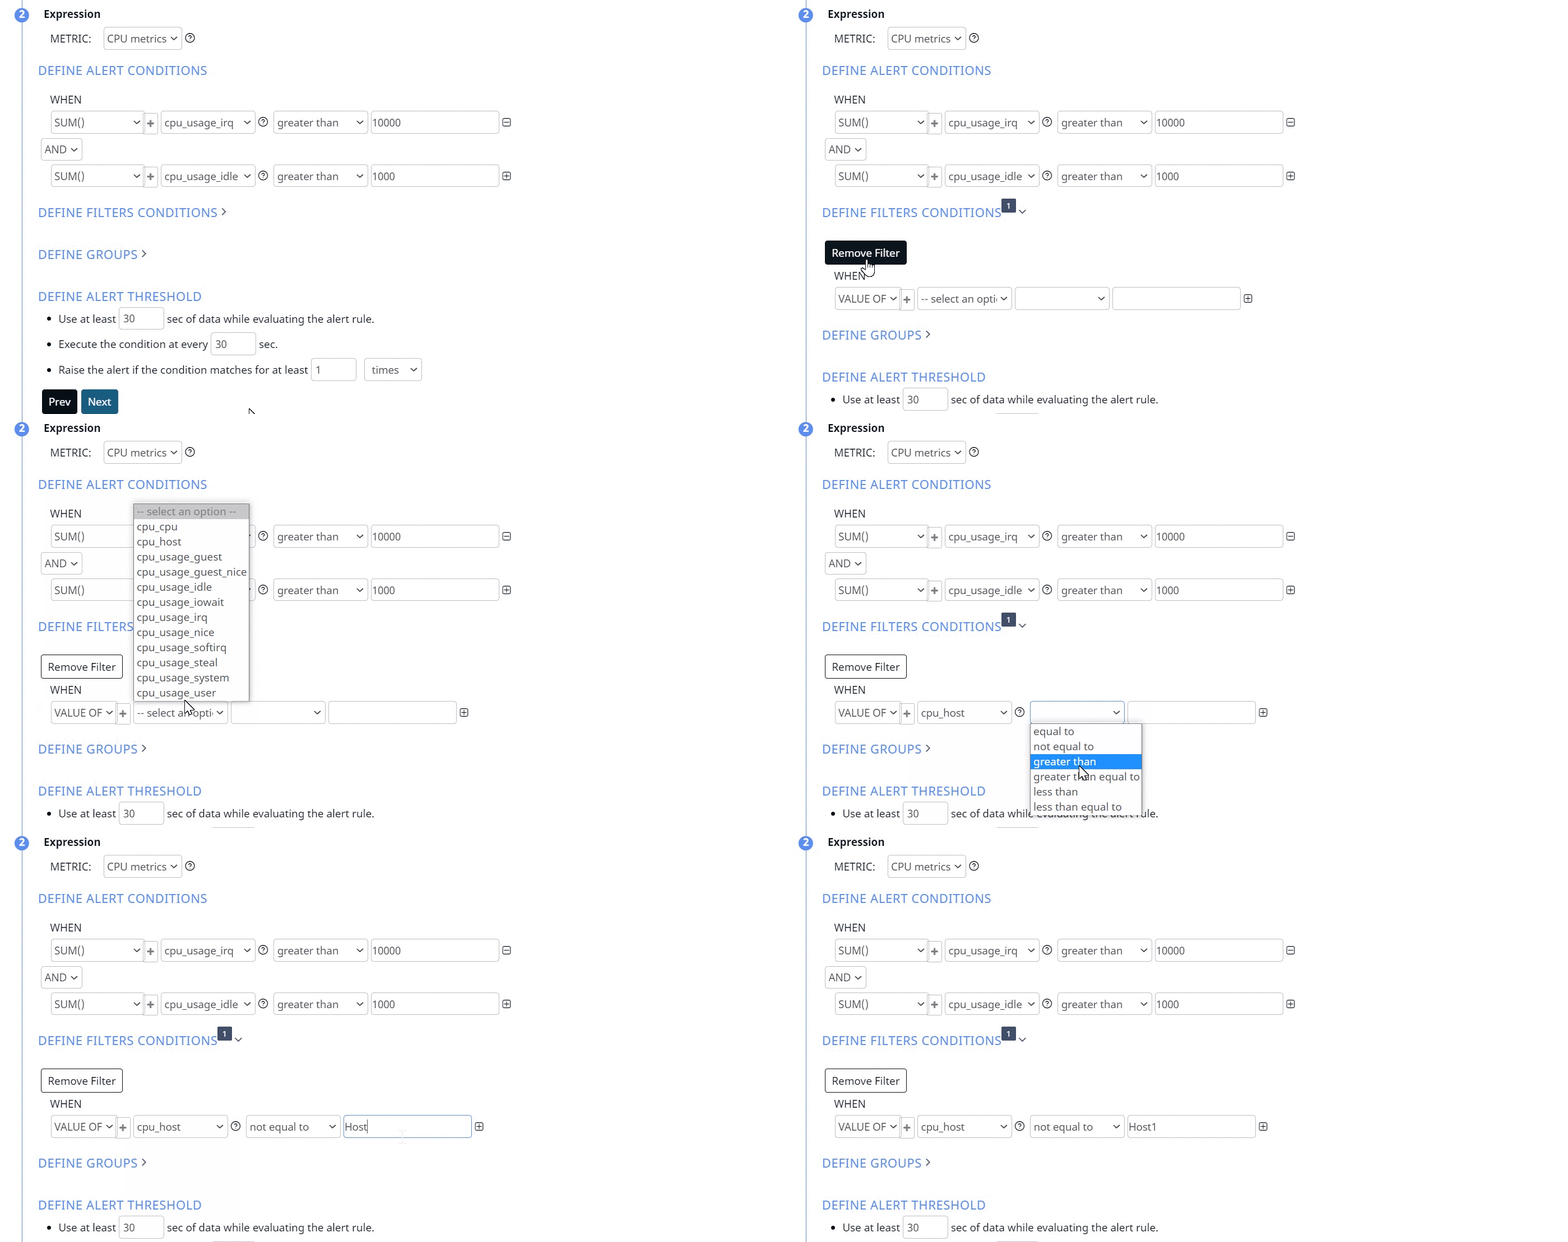
You must use this sub stage to filter data before applying the alert conditions. You must configure this option if you want to include only a specific host or server or want to exclude a specific host or server from being considered while evaluating the alert conditions. This sub stage is optional.
In the example from the previous section in which an alert condition was set on IRQ and idle time of CPU, if you wish to exclude a specific host(s) or include only a set of hosts, you must configure the conditions to exclude or include the required host(s), in this subsection.
The following image excludes Host1. The idle time and IRQ time of Host1’s CPU are excluded while calculating the sum of idle time and IRQ time of all the hosts and servers.
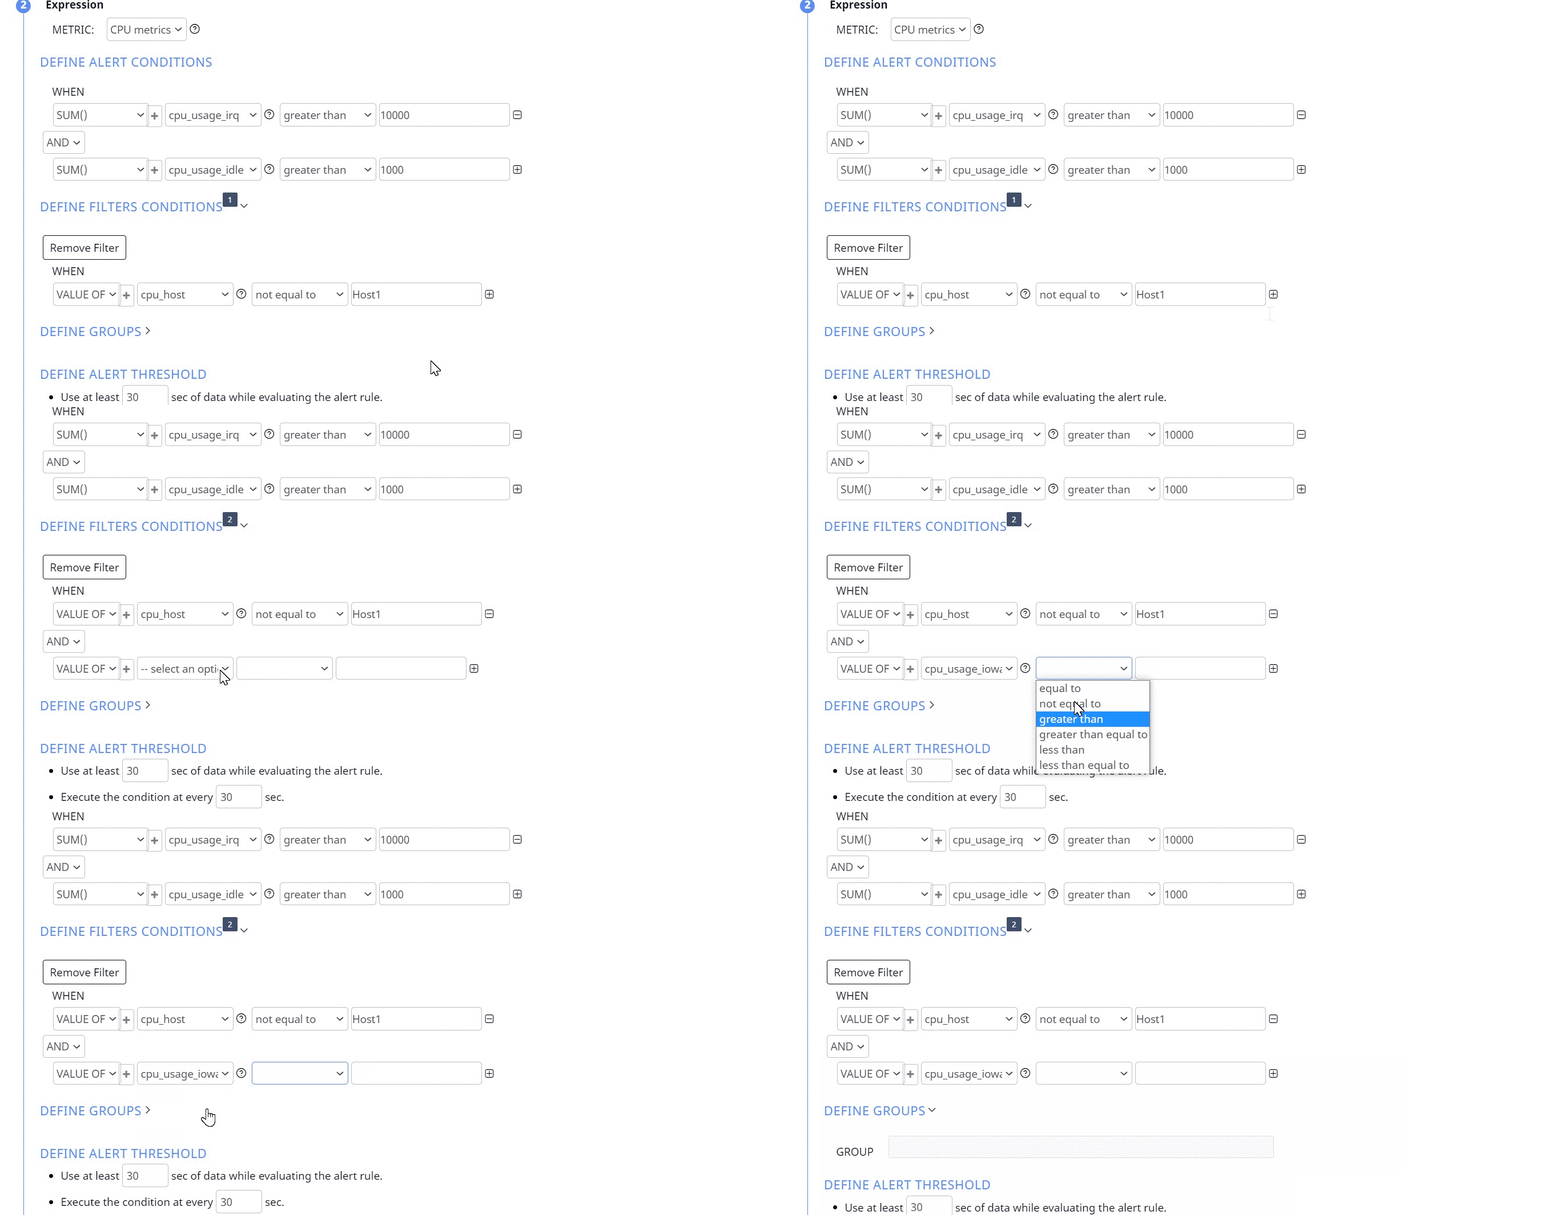
Similarly, you must use the equal to operator to include only a specific host or specific set of hosts. To include multiple hosts, you must add multiple filters and use the equal to operator and configure the OR logic between the filters. To exclude multiple hosts, you must add multiple filters and use the not equal to operator and configure the OR logic between the filters. You can set conditions to exclude multiple hosts, include only a specific set of hosts, include or exclude the arithmetic result of other options, and so on.
Define Groups
You must use this sub stage to group the results of the alert conditions. You must select one of the available options by which the filter results must be grouped. For example, in the previous section, we configured alerts on CPU Category. You can group the results of the alert by CPUs or by hosts.
If you choose to group by CPUs, all the CPUs, whose sum of IRQ and idle time is the same, are grouped together. Similarly, if you choose to group by hosts, all the hosts, whose sum of IRQ and idle time is the same, are grouped together.
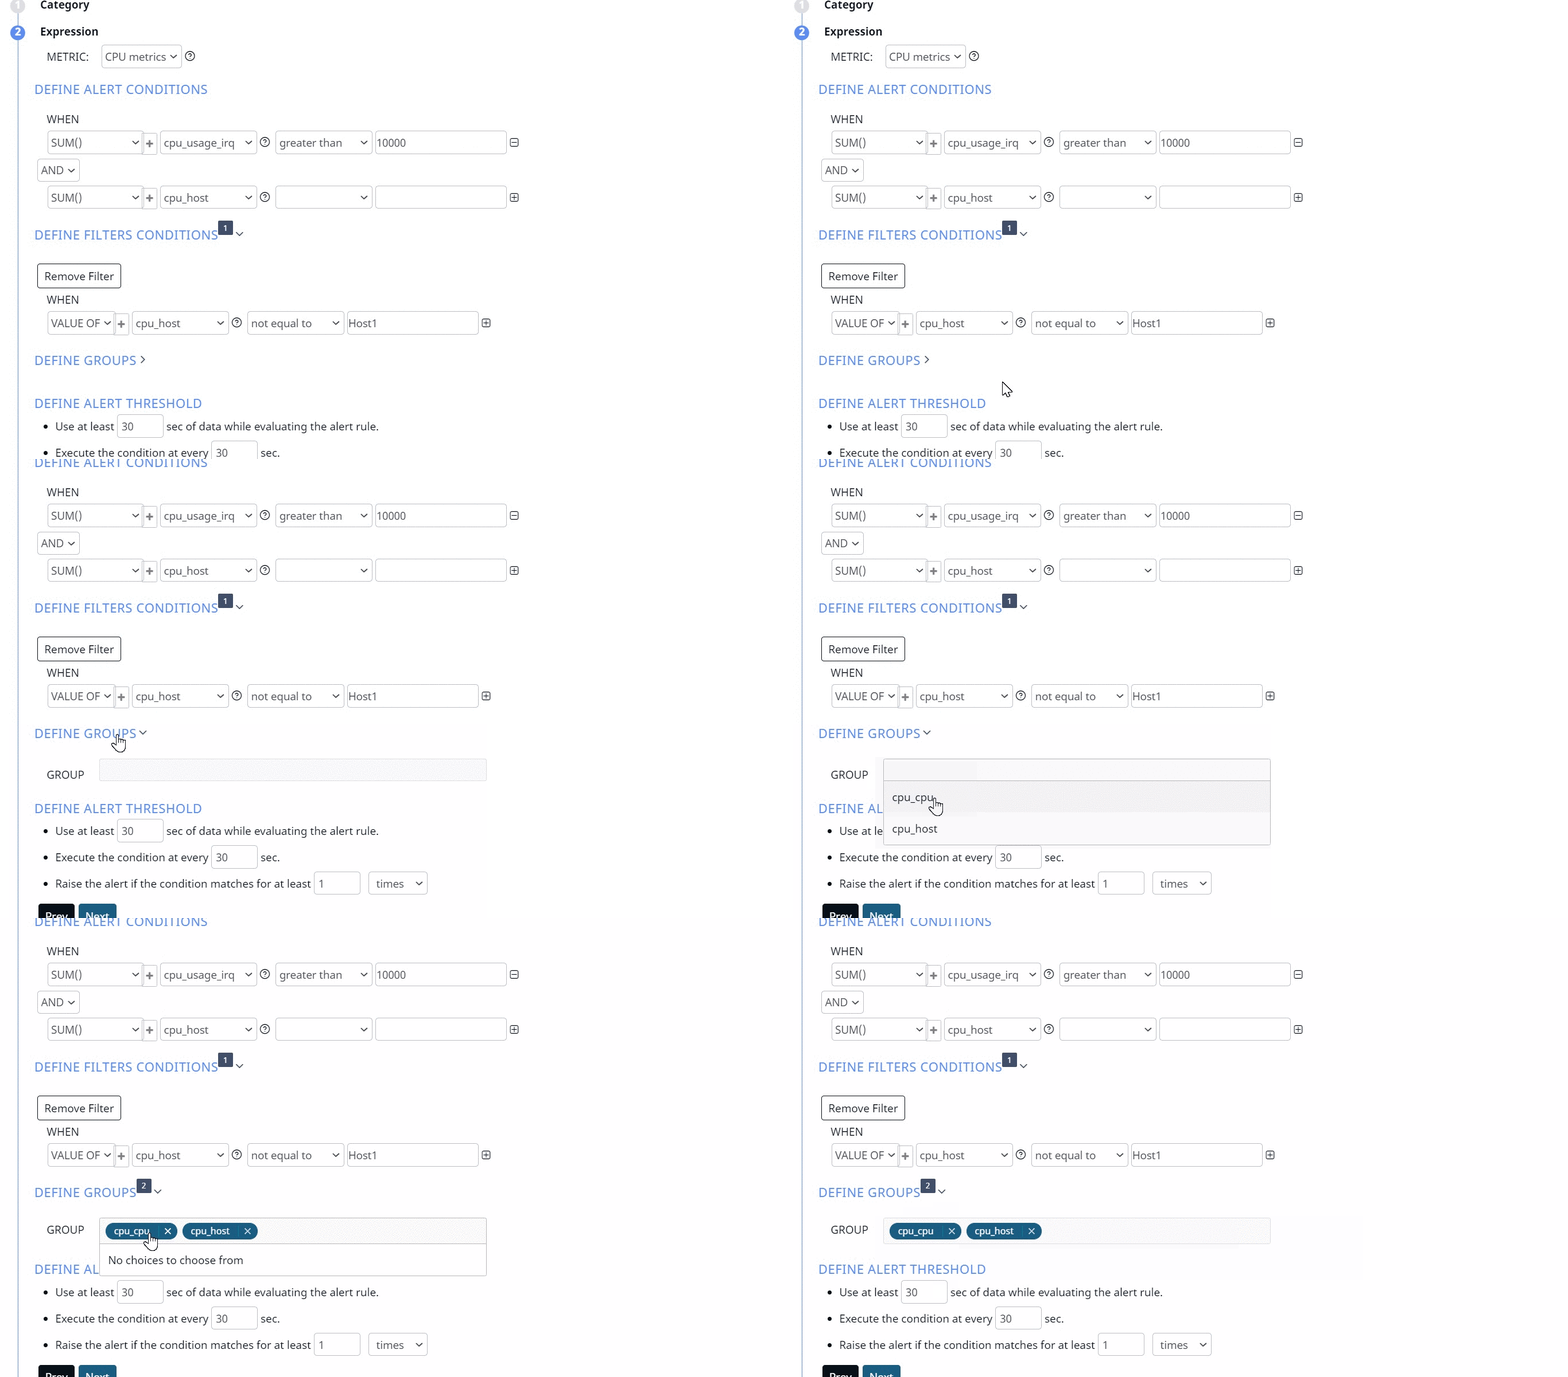
While creating an alert for Impala and defining groups, you can select these two groups: impala_queries_query_id and impala_queries_coordinator.
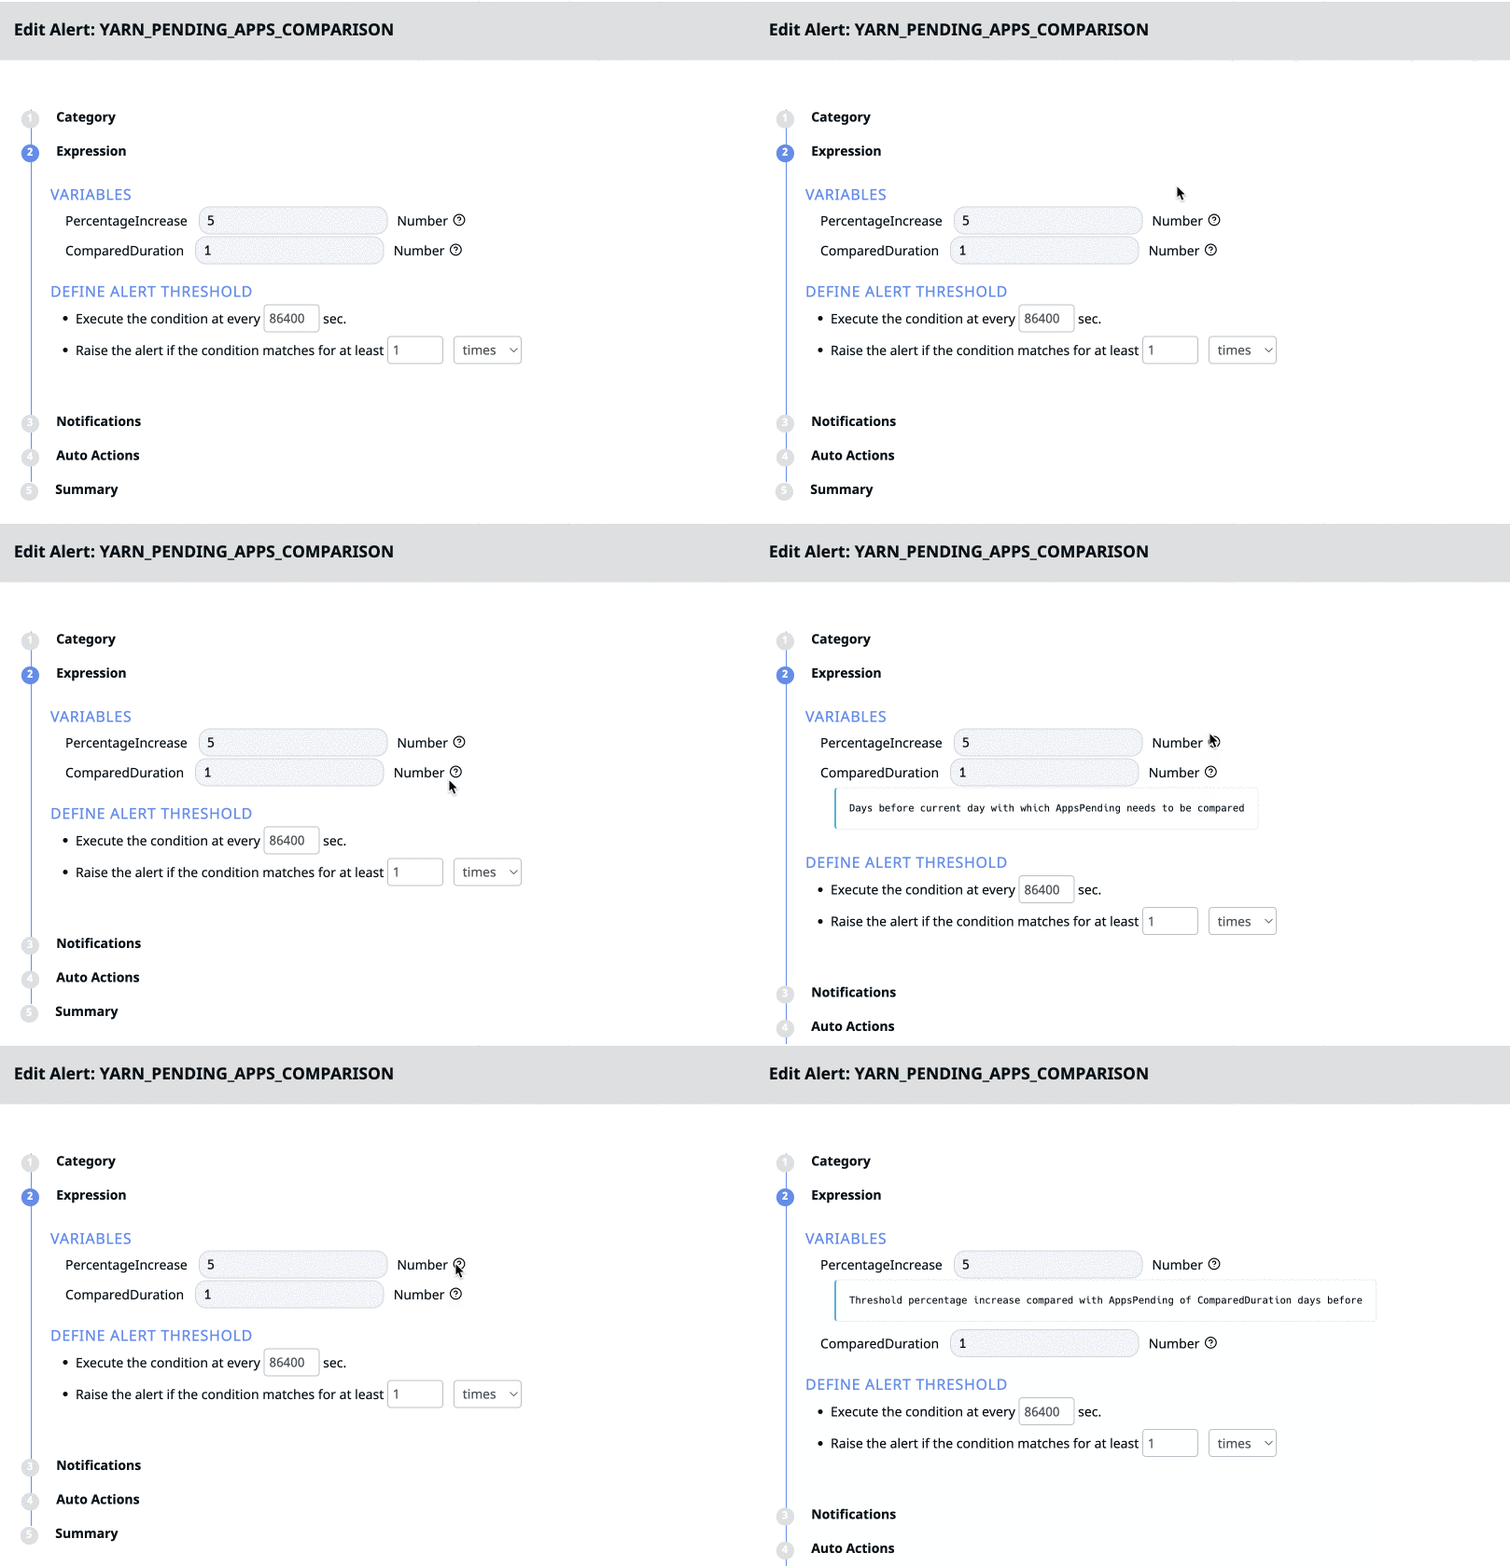
Variables (Only for Predefined Alerts)
The Variables field under Expression is only applicable to predefined alerts. Variables are the parameters used to set alert conditions for certain predefined alerts. You can view the description of the variable by clicking the
Define Threshold
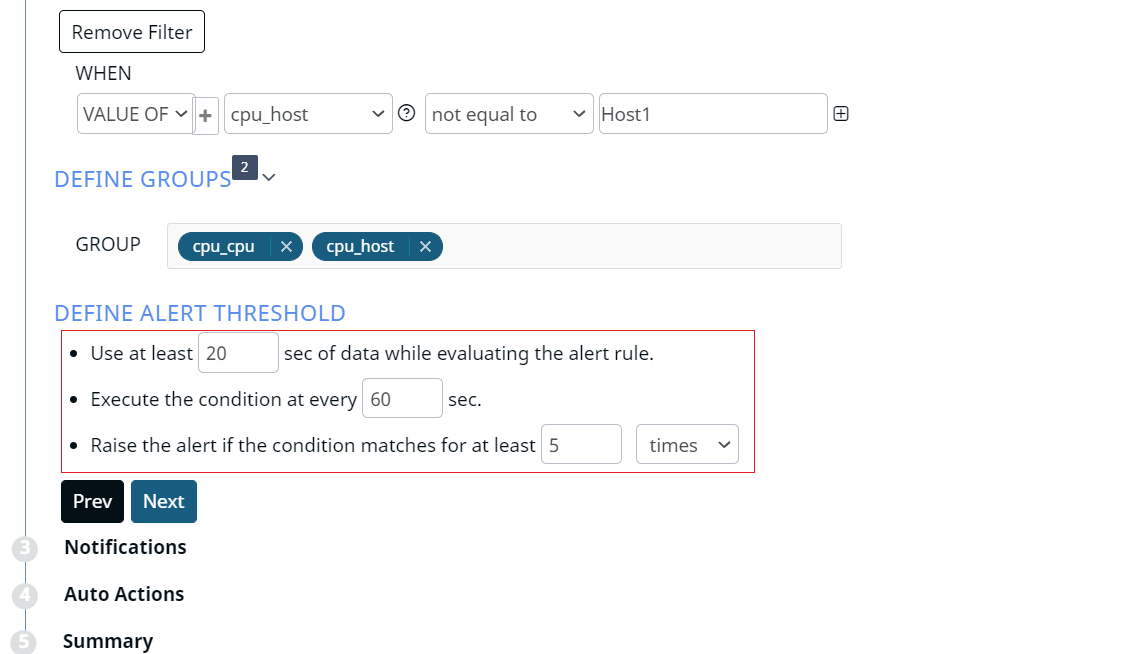
You must use this sub stage to define threshold values for the alert. Pulse provides you the following threshold conditions.
- Use at least x sec of data while evaluating the alert rule: You must set the minimum time interval (in seconds) for which data must be considered to evaluate the alert condition. For example, in the previous example, we set an alert of IRQ time and CPU idle time. In this threshold condition, if you set 20 seconds as the threshold value, the alert considers data for the last 20 seconds for both IRQ time and idle time, while evaluating the alert condition.
- Execute the condition at every x sec: You must type the time interval (in seconds) to set the alert execution frequency. If you set this value as 60, the alert condition is executed every minute. If you set 20 as the value of the previous threshold, then the last 20 minutes data is taken into consideration and alert is evaluated every minute.
- Raise the alert if the condition matches for at least x times/seconds: You must set the value for the number of times the condition matches. You can also enter the number of seconds for the same condition. If you set this value to be 5 times, if the alert condition is matched five times, the alert is raised.
Create Alert for Endpoint Check Metric
The Endpoint Check metric is used to check if a URL or endpoint is working as expected. This Category has a totally different set of Expression filters as compared to other categories. These filters are described as follows.
- (Optional) Type Custom Endpoint Url: Select this checkbox and type the URL in the Metric text box.
- (Optional) Show Response Body: Select this checkbox to display the response body of the alert when raised.
- Metric: If you have selected the Type Custom Endpoint Url check box, type the endpoint URL(s) separated by comma in the Metric box. If you have not selected the Type Custom Endpoint Url check box, you must choose the endpoint from the dropdown.
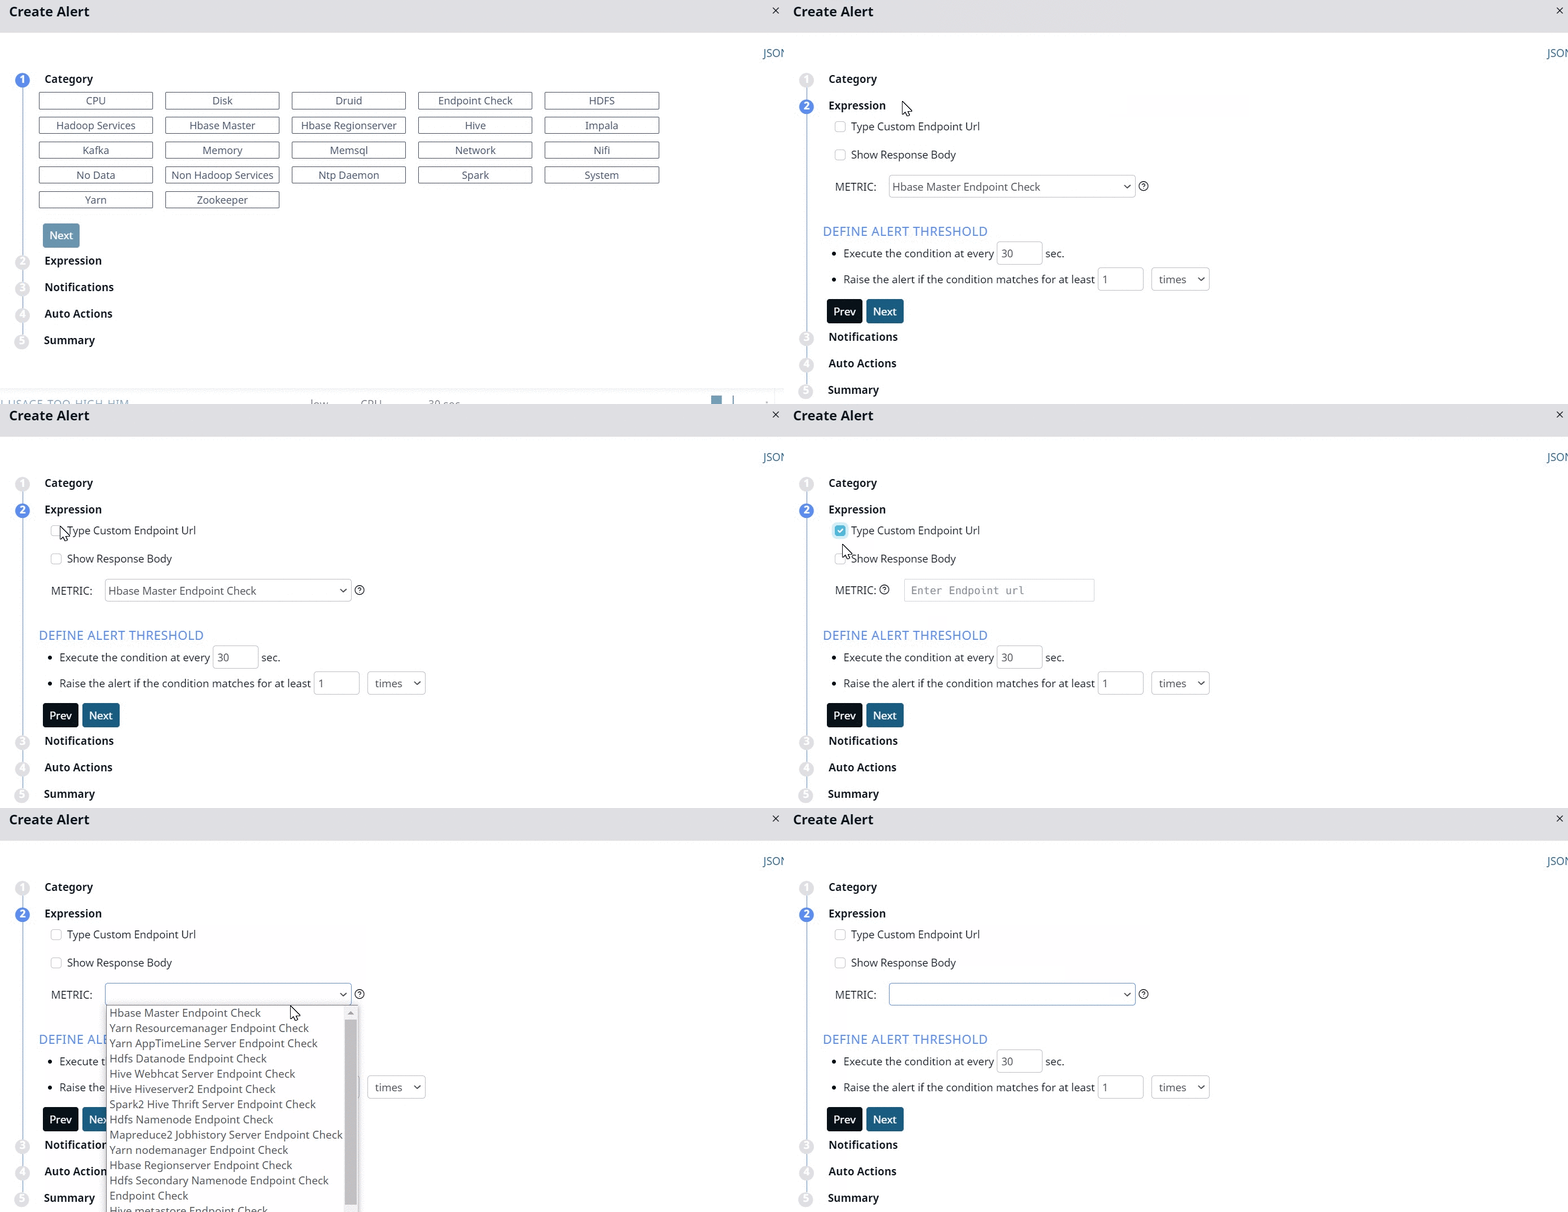
The Threshold section for this metric only has two threshold filters.
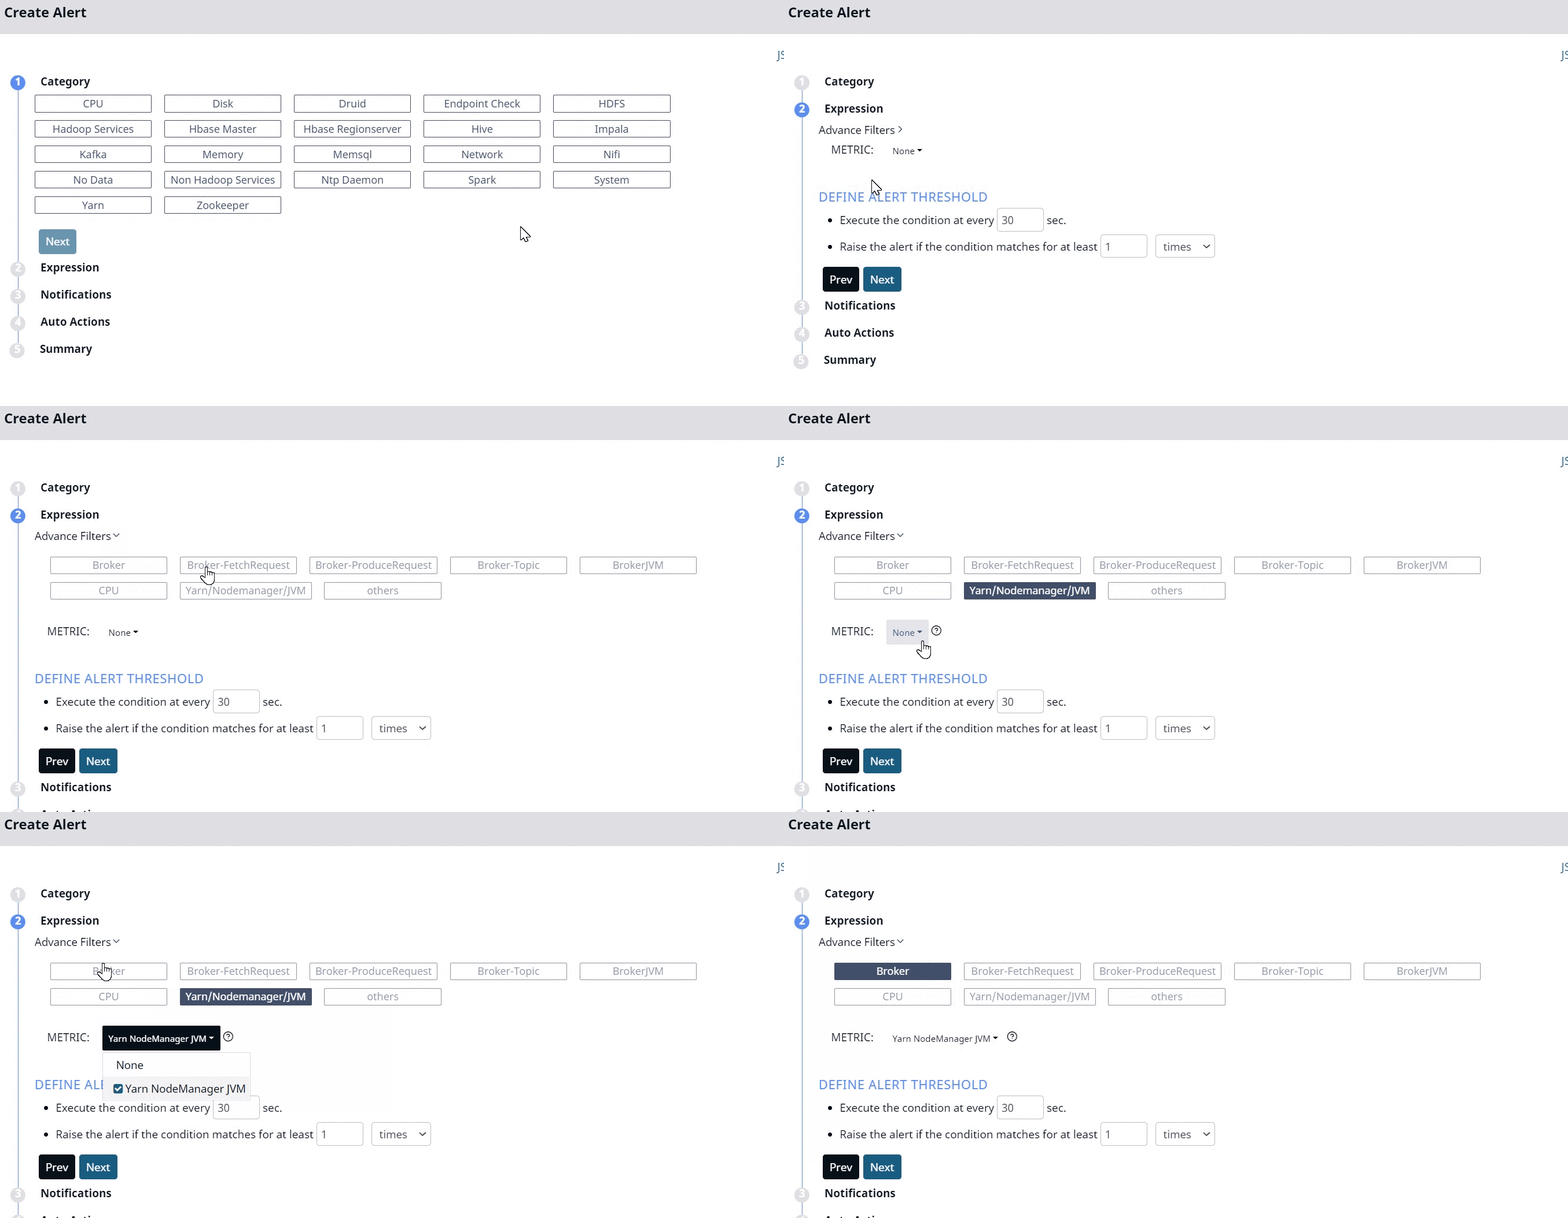
Create Alert for No Data Category
You must use the No Data category to create alerts based on data availability. This Category has a totally different set of Expression filters as compared to other categories. These filters are described as follows.
- Advanced Filters: Select one of the advanced filters for which the alert must be defined.
- Metric: Select a metric from the drop-down menu. These metrics vary based on the advanced filter selected.
Notifications
In this stage you must configure the notifications. When the alert is raised, the notifications are triggered based on the configurations you set in this stage. Pulse provides you six notification channels. These channels are described in the following table.
| Channel | Description |
|---|---|
Use Default Email Configuration: Select the checkbox to use the Default Email Configuration. Type an Email address(es) to receive alerts or notifications. You can CC and BCC the notifications to others as well. Adding an email address to CC and BCC is optional. | |
| Slack |
Note: The default slack configuration URL is provided by you during installation of Pulse.
|
| Hangouts | Webhook notification required: Select this checkbox to receive notifications and alerts on Hangouts. |
| Webhooks |
|
| Opsgenie | Enables you to set an alert to receive notifications in your Opsgenie environment. Do the following to set up Opsgenie alerts using Pulse.
|
| Log |
|
| Telegram |
If you have not selected the Use Default Telegram Configuration check box, enter the following parameters:
|
| Line |
|
| Service now |
If you have not selected the Use Default Service Now Configuration check box, enter the following parameters:
|
| Jira |
If you have not selected the Use Default Jira Configuration check box, enter the following parameters:
Note: If the Jira configuration includes custom mandatory fields, the ticket cannot be raised via Pulse. |
| XMatters |
If you have not selected the Enable X-Matters Notification check box, enter the parameters such as version and alert type. |
| Big Panda |
|
| Microsoft Teams | You can use the default Microsoft Teams configuration or specify a custom channel URL to send alert notifications. Use Default Microsoft Teams Configuration: Select this checkbox to use the default configuration URL defined when running the command: accelo config alerts notifications. Create a Microsoft Teams Webhook URL You can create the webhook URL using one of the following methods:
You must change it to a user who has permission to read messages in the private channel or authenticate the Flow bot to write to the private channel. |
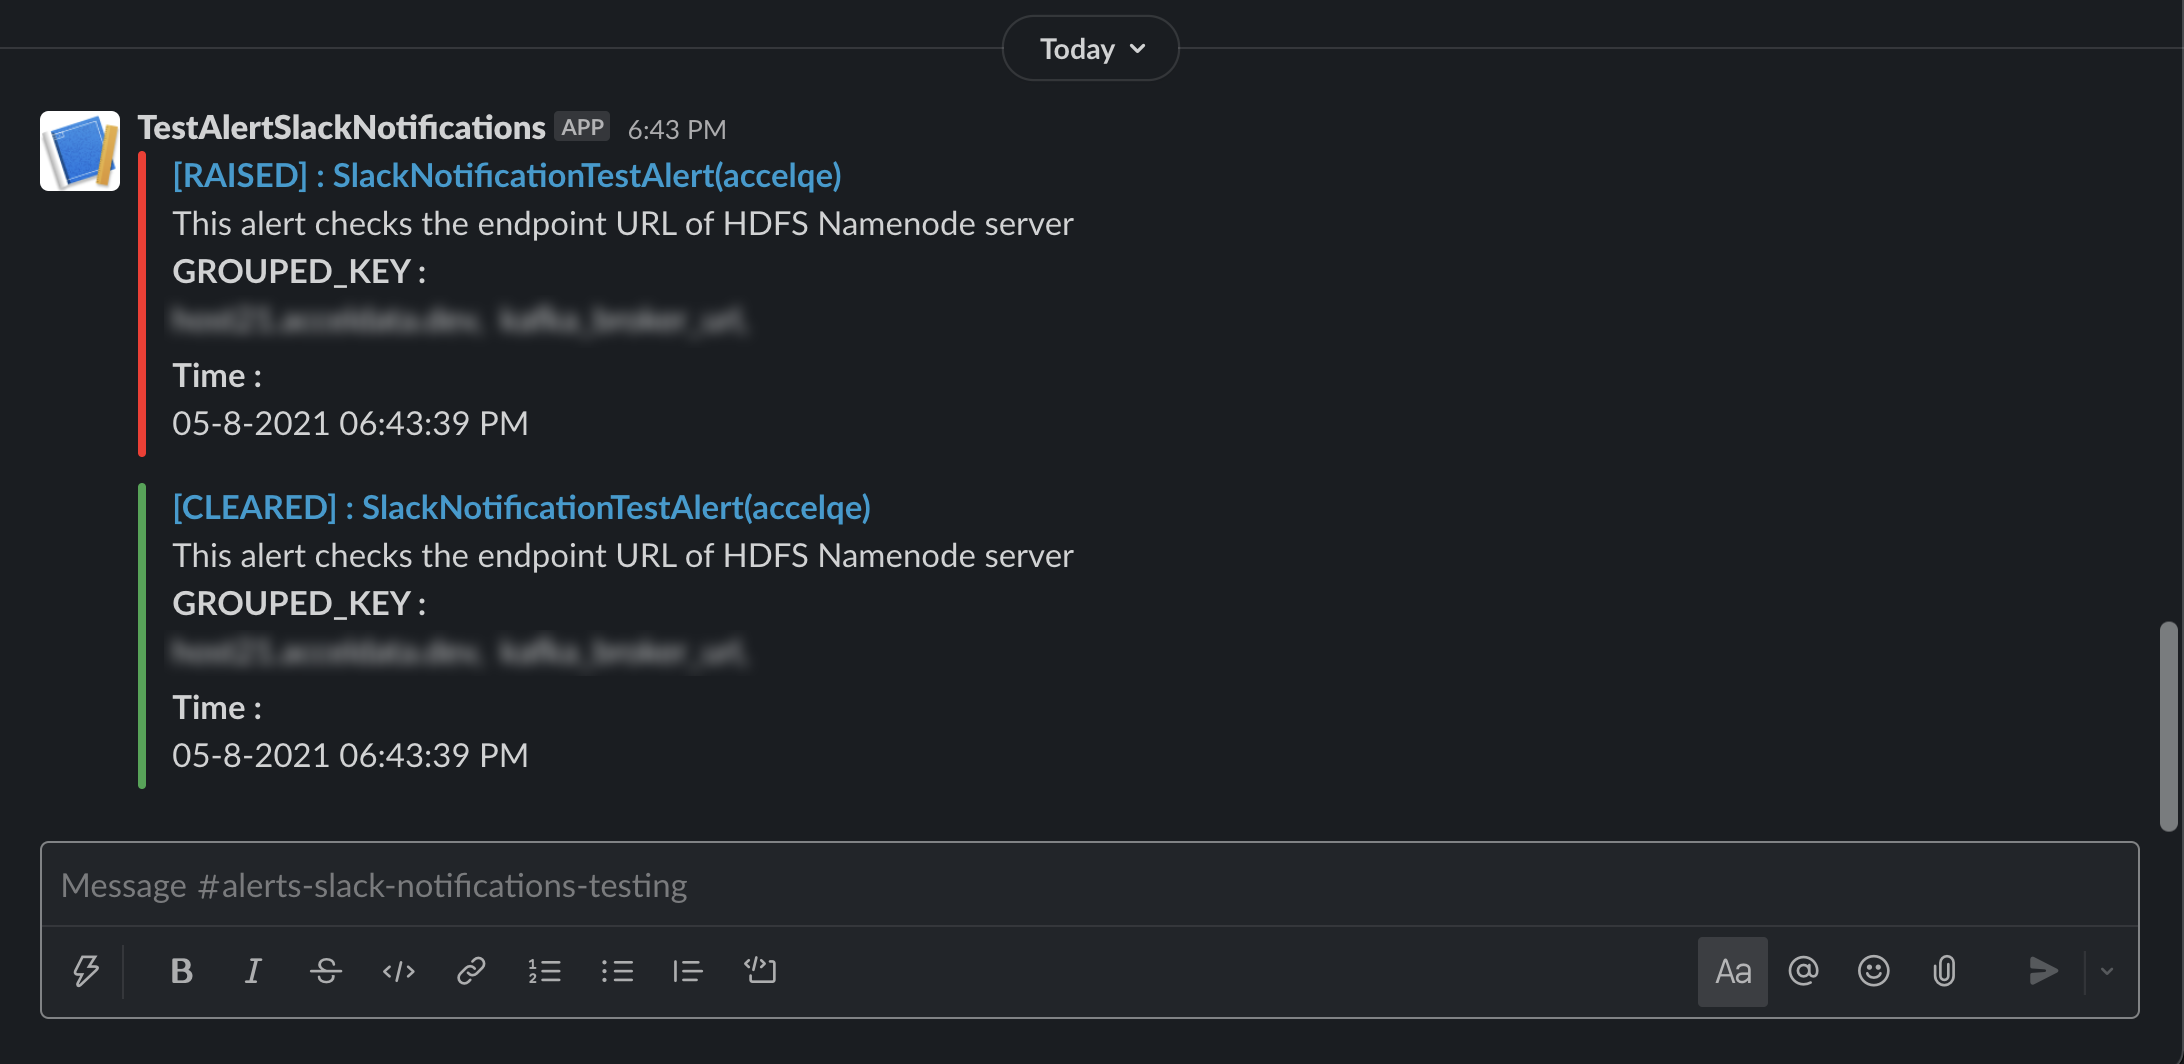
Viewing Notifications on Slack
If you have enabled Slack as a default notifications channel, you will receive your alerts and notification as displayed in the following image.
Viewing Log links from Emails
By clicking on the View in Dashboard link in the email, you may now view the Log Links from the email notifications. This displays data for the failed applications in the Application Explorer page.
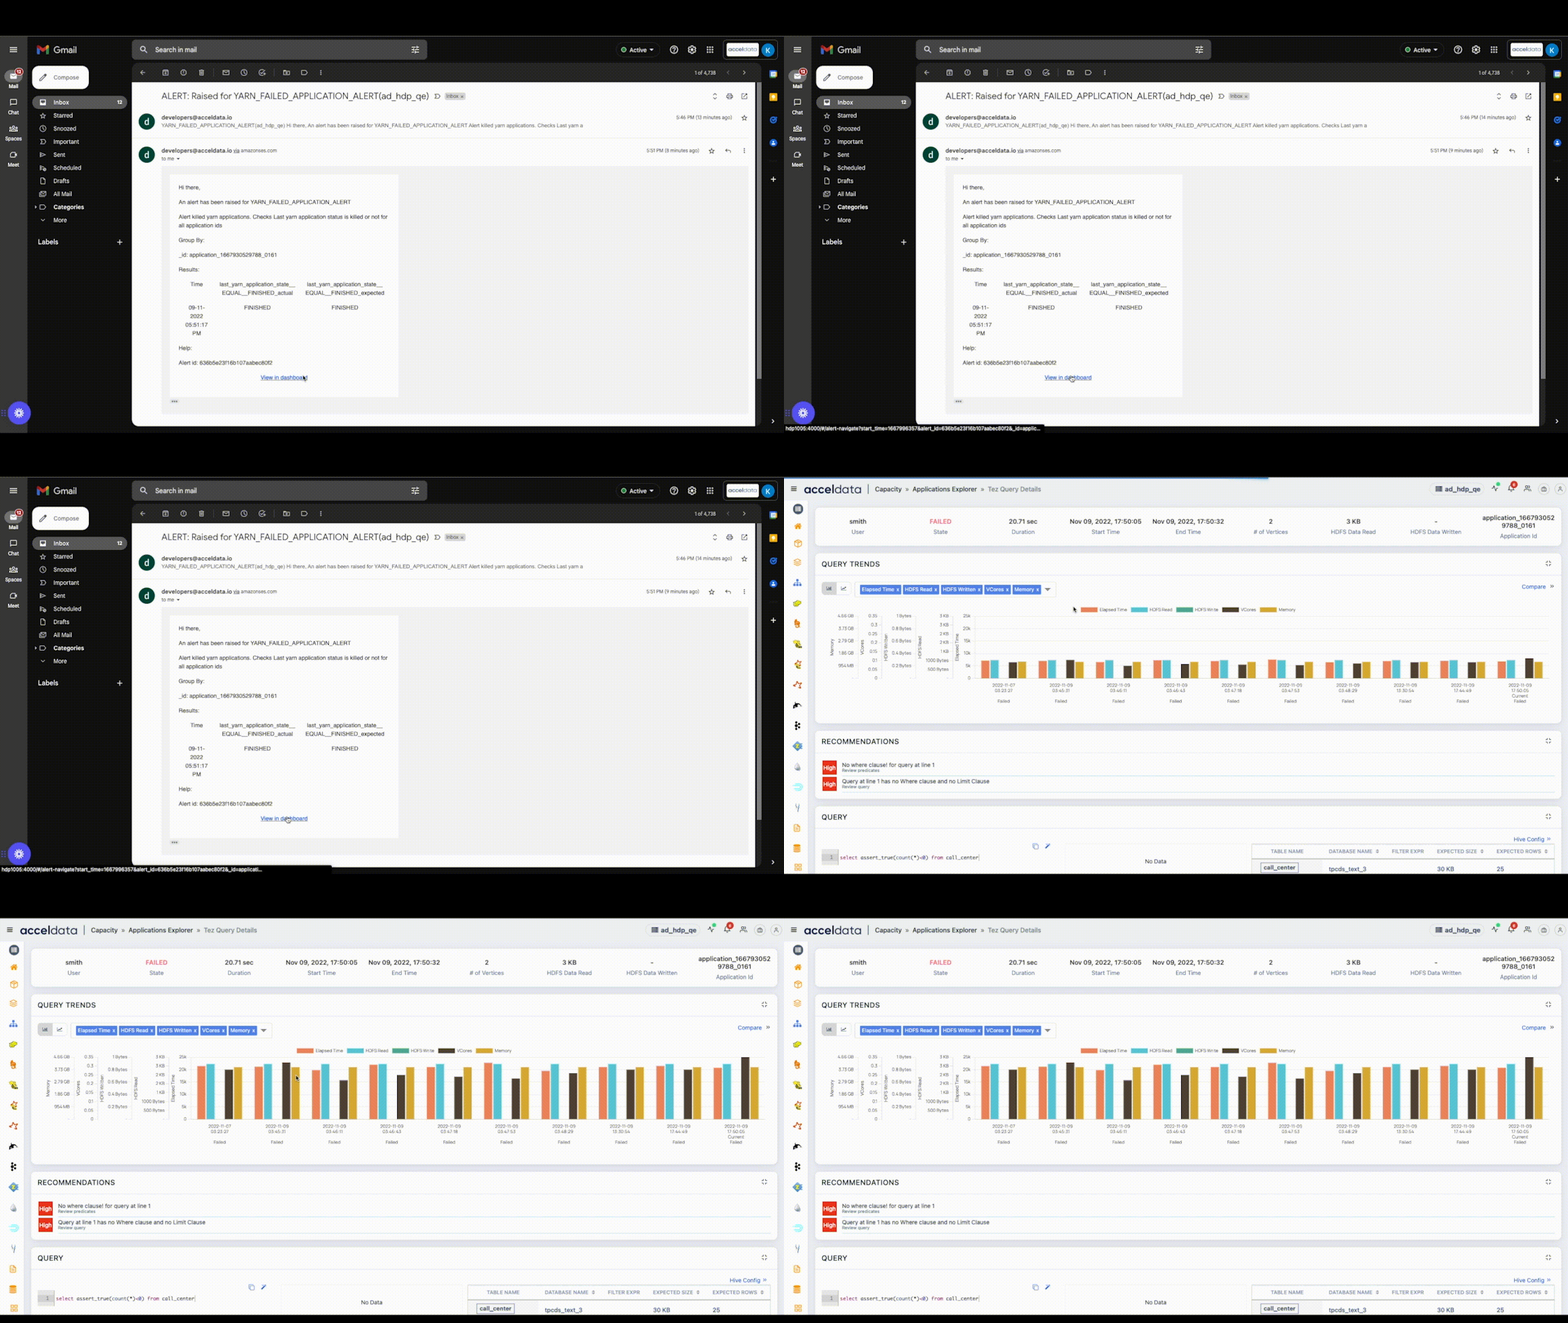
Application Log Link in Alert Email
Bulk Enable or Disable Notifications
You can now bulk enable the notifications by performing the following actions.
- Hover the mouse over the left side of the table on the Alerts page.
- Check any one of the check boxes.
- At the top of the left side header menu, a box appears. When you check the box, all of the Alerts in the table are selected.
- To perform the action on the selected Alerts, select the actions from the drop box Actions for Selected Alerts on the right.

Bulk Upload Notifications
The Select All option only works for the current Rows size. If the row size is increased, uncheck and recheck the Select All checkbox.
Auto Actions
In this stage you must configure the actions to be taken when an alert is raised. The list of actions displayed here are populated from the Actions page. For more information on actions, see the Actions documentation. You can add only one action for an alert.
Passing Arguments from Alerts to Actions
When you configure an auto action, you select a predefined action. The action has default values which were configured while creating it by using Runbook. You can choose to override the default values of the action with the values from alerts. Pulse passes the arguments from alerts to the actions.
Summary
In this stage, you must summarize the alert configurations. The fields of this stage are described in the following table.
| Field Name | Description |
|---|---|
| Name | Specify a name for the alert. |
| Description | Based on the severity of the alert, select one type of severity from the Severity type drop-down list. Available severity types are low, medium, high, and severe. |
| Help text to include with Incidents | Specify help text to be displayed on the incident if the alert generates an incident. |
| Enabled | Select this checkbox to enable the alert. If you do not enable the alert, it does not check the alert condition. The alert is considered to be switched off, if you do not select this check box. |
| Mute Notifications | Select this check box to mute the alert notifications for a specific time period. To learn more about this configuration, see Mute Alert Notifications. |
If you type text in the Description and Help text to include Incidents fields, you can also view this information on the alerts list view.
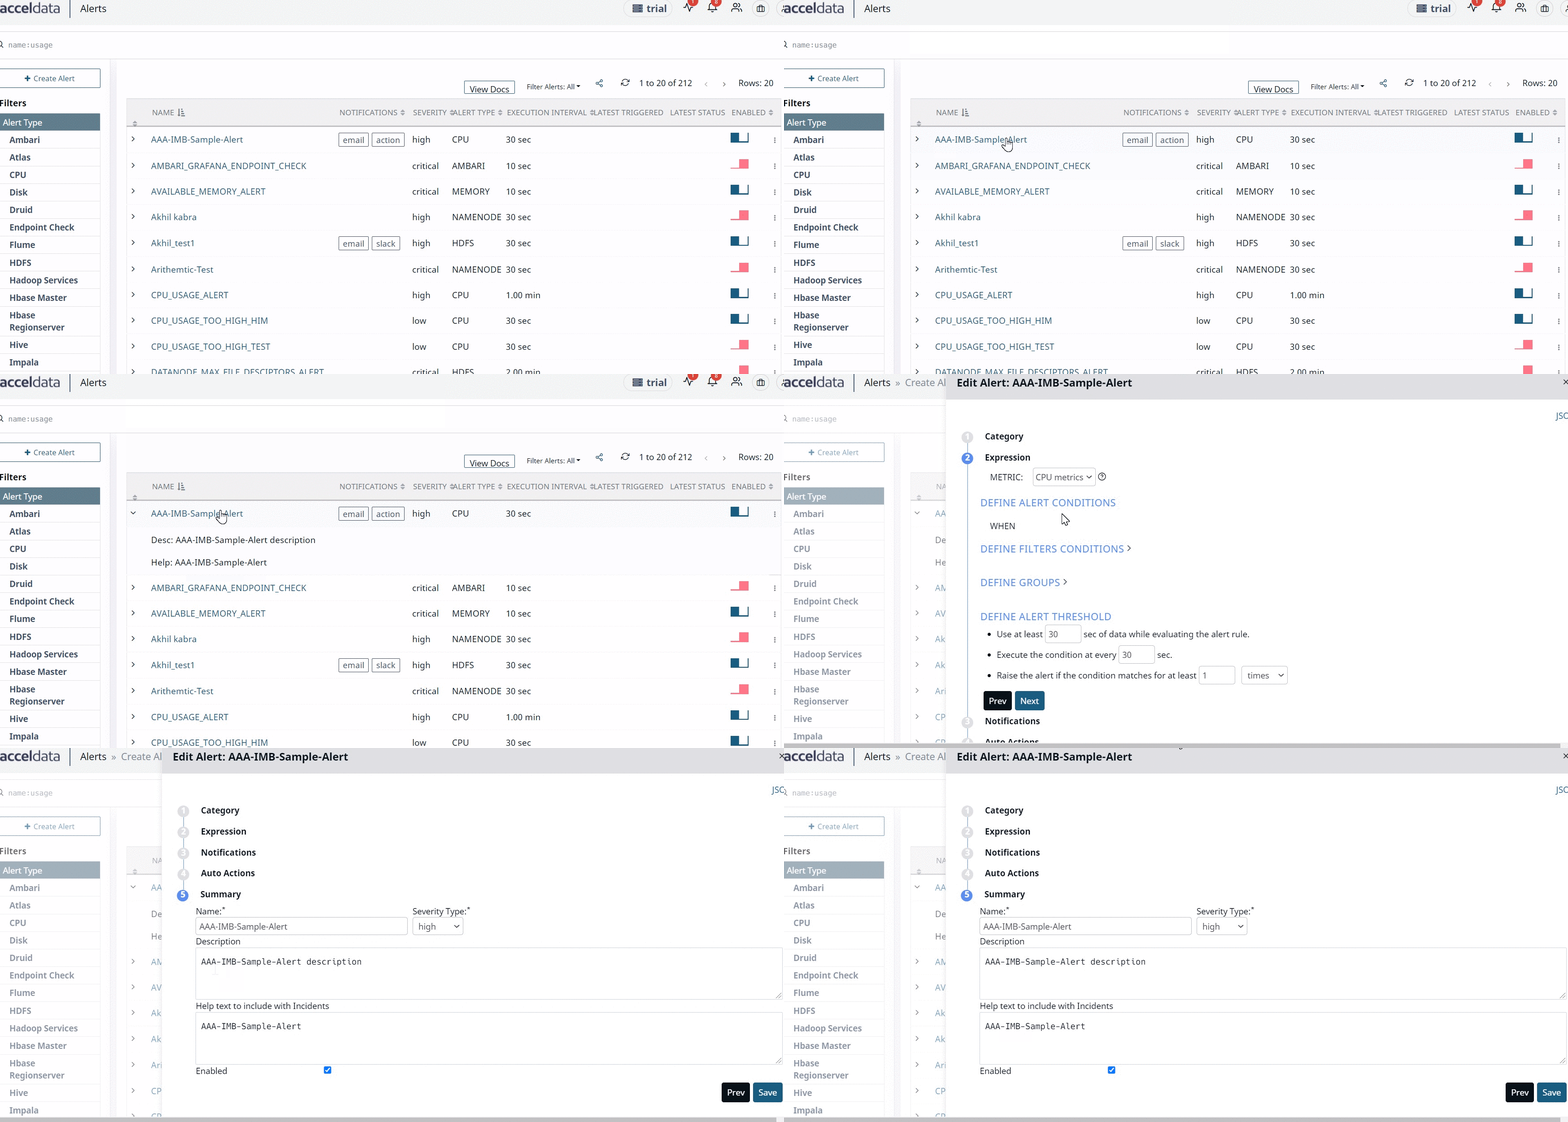
Mute Alert Notifications
Sometimes, you may not wish to receive notifications from the alert for a specific time period. In such cases, you can pause the alert notifications. The alert is active, enabled and evaluates the conditions and filters even during the mute period. However, it does not generate any notifications during the mute period. All the notifications are generated after the mute period ends.
To enable the alert mute notifications, you must select the Mute Notification check box in the Summary section of alert creation page.
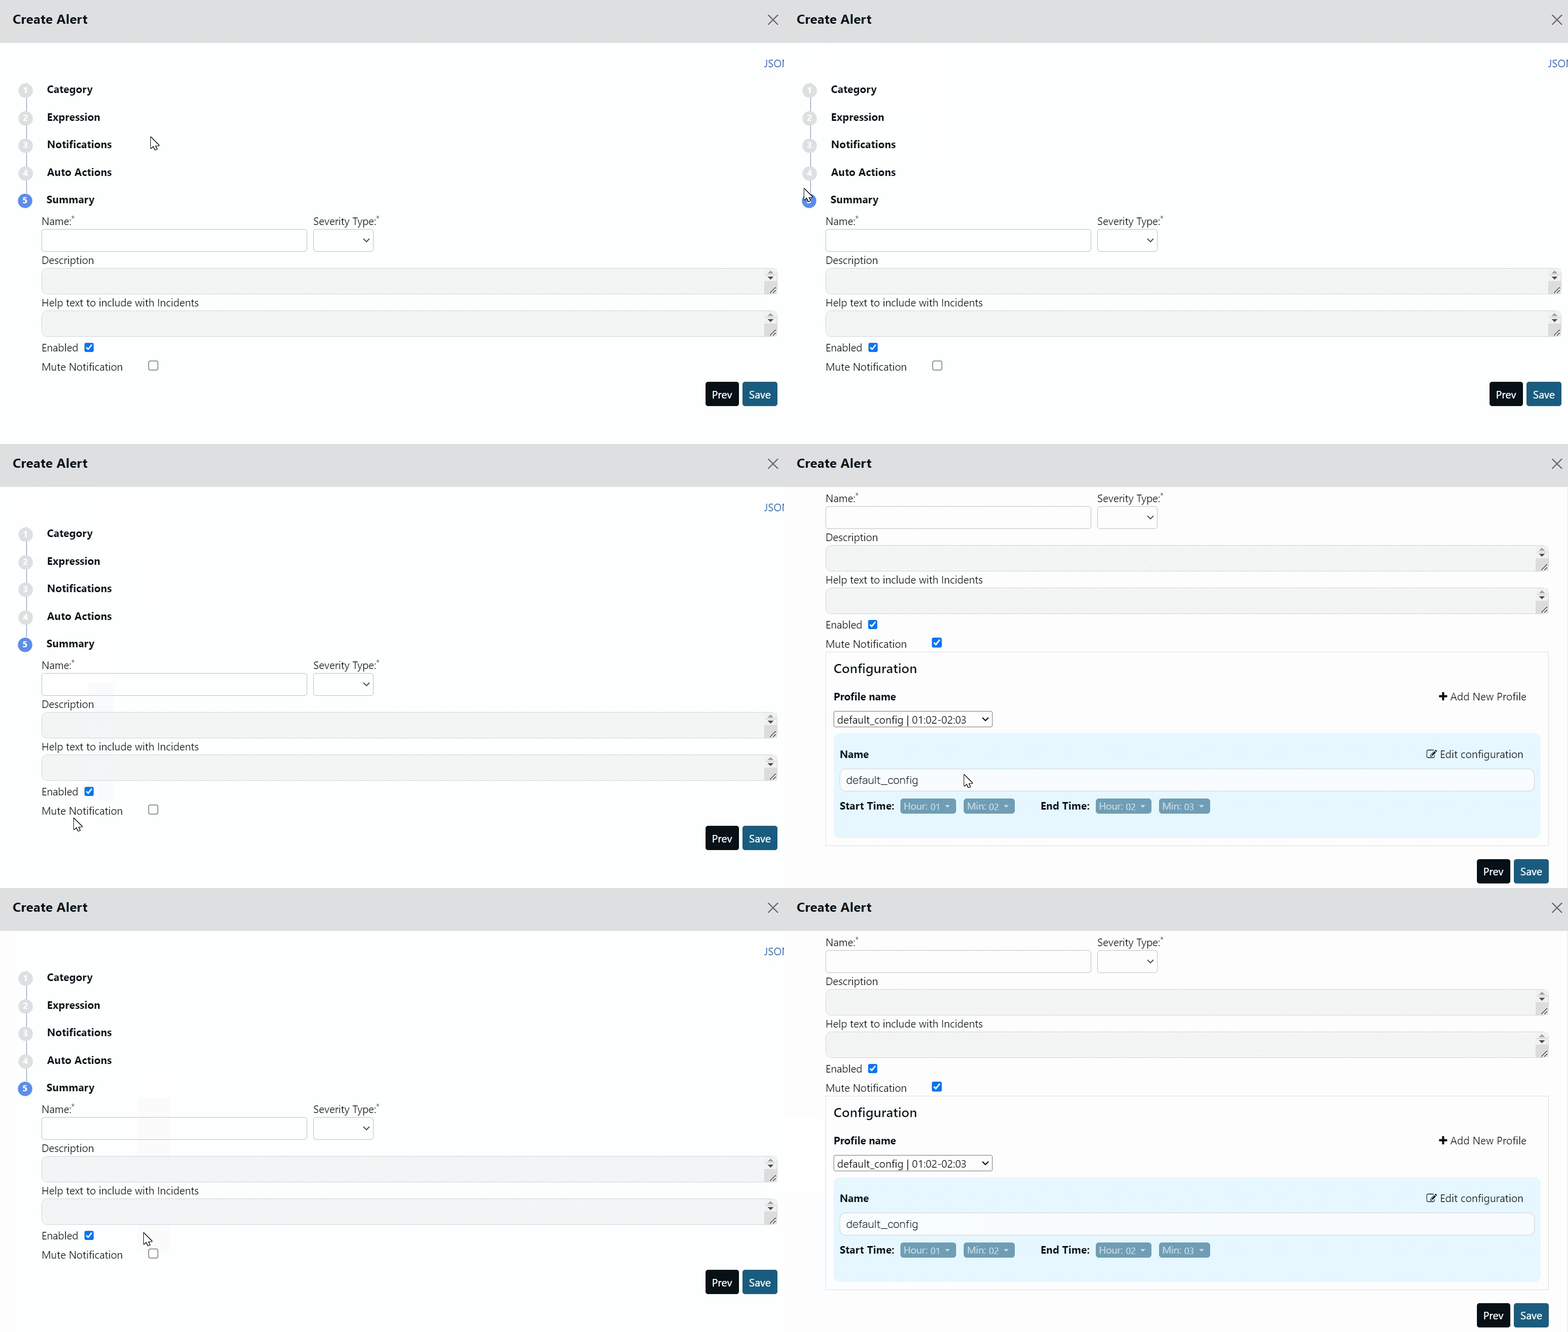
To configure the Mute period, you must configure a Profile. A Profile in Mute Notification feature denotes a start time and end time during which alerts are muted. You can create multiple profiles, each with a different start and end time to mute notifications and can assign any one of them to the alert.
For example, you can have a Kafka profile for all Kafka alerts. You can set the start time and end time for this Profile and assign it to all Kafka alerts. All the Kafka alerts are muted during the selected time period. Similarly, you can have a Druid profile and set a time period during which all the notifications from Druid alerts are muted.
By default, Acceldata provides you a profile called default_config. The start and end time for this profile is 01:02 hours and 02:03 hours, respectively. You cannot delete this profile, however, you can modify it.
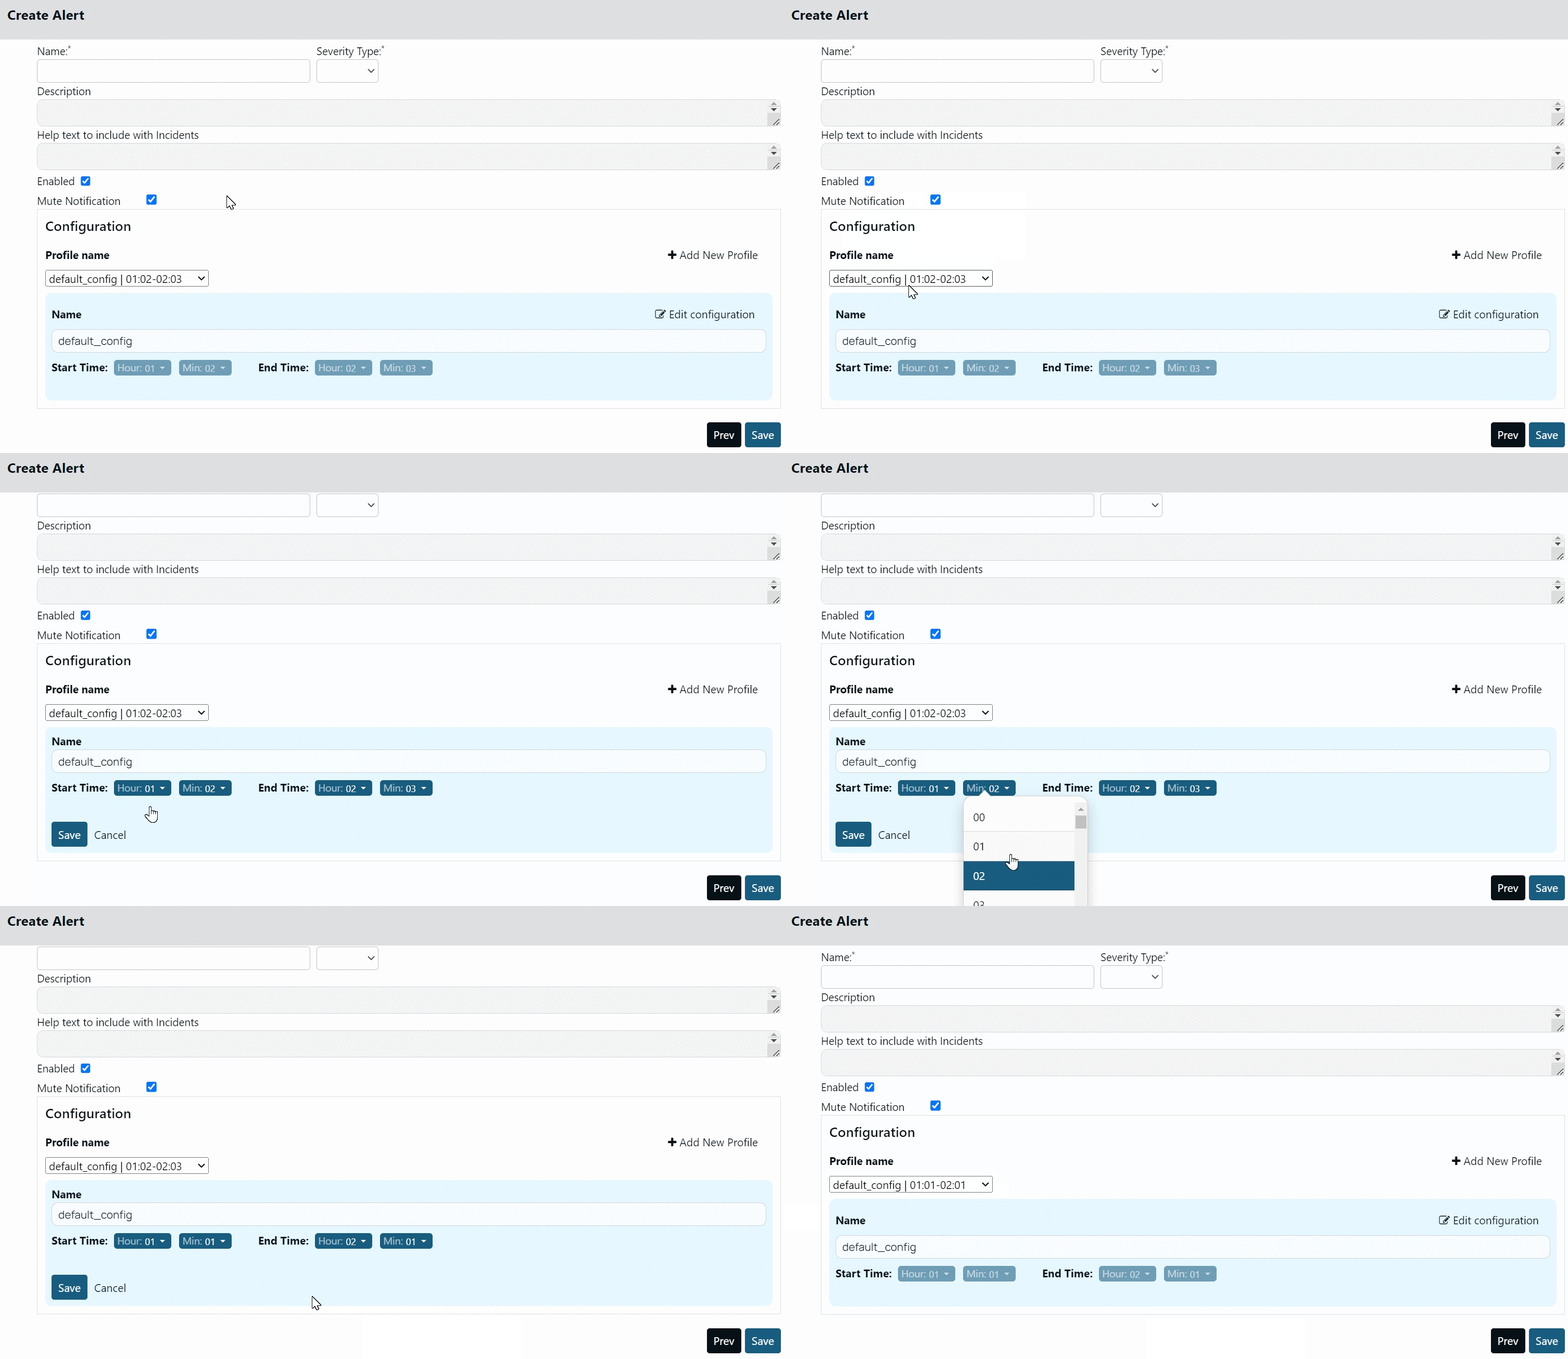
Creating Profile
To create a new Profile:
- Click +Add New Profile.
- Select the start and end time.
- Click Save.
All the profiles are displayed in the Profile name drop-down menu. The mute period of the alert depends on the profile that you select in the Profile name drop-down menu.
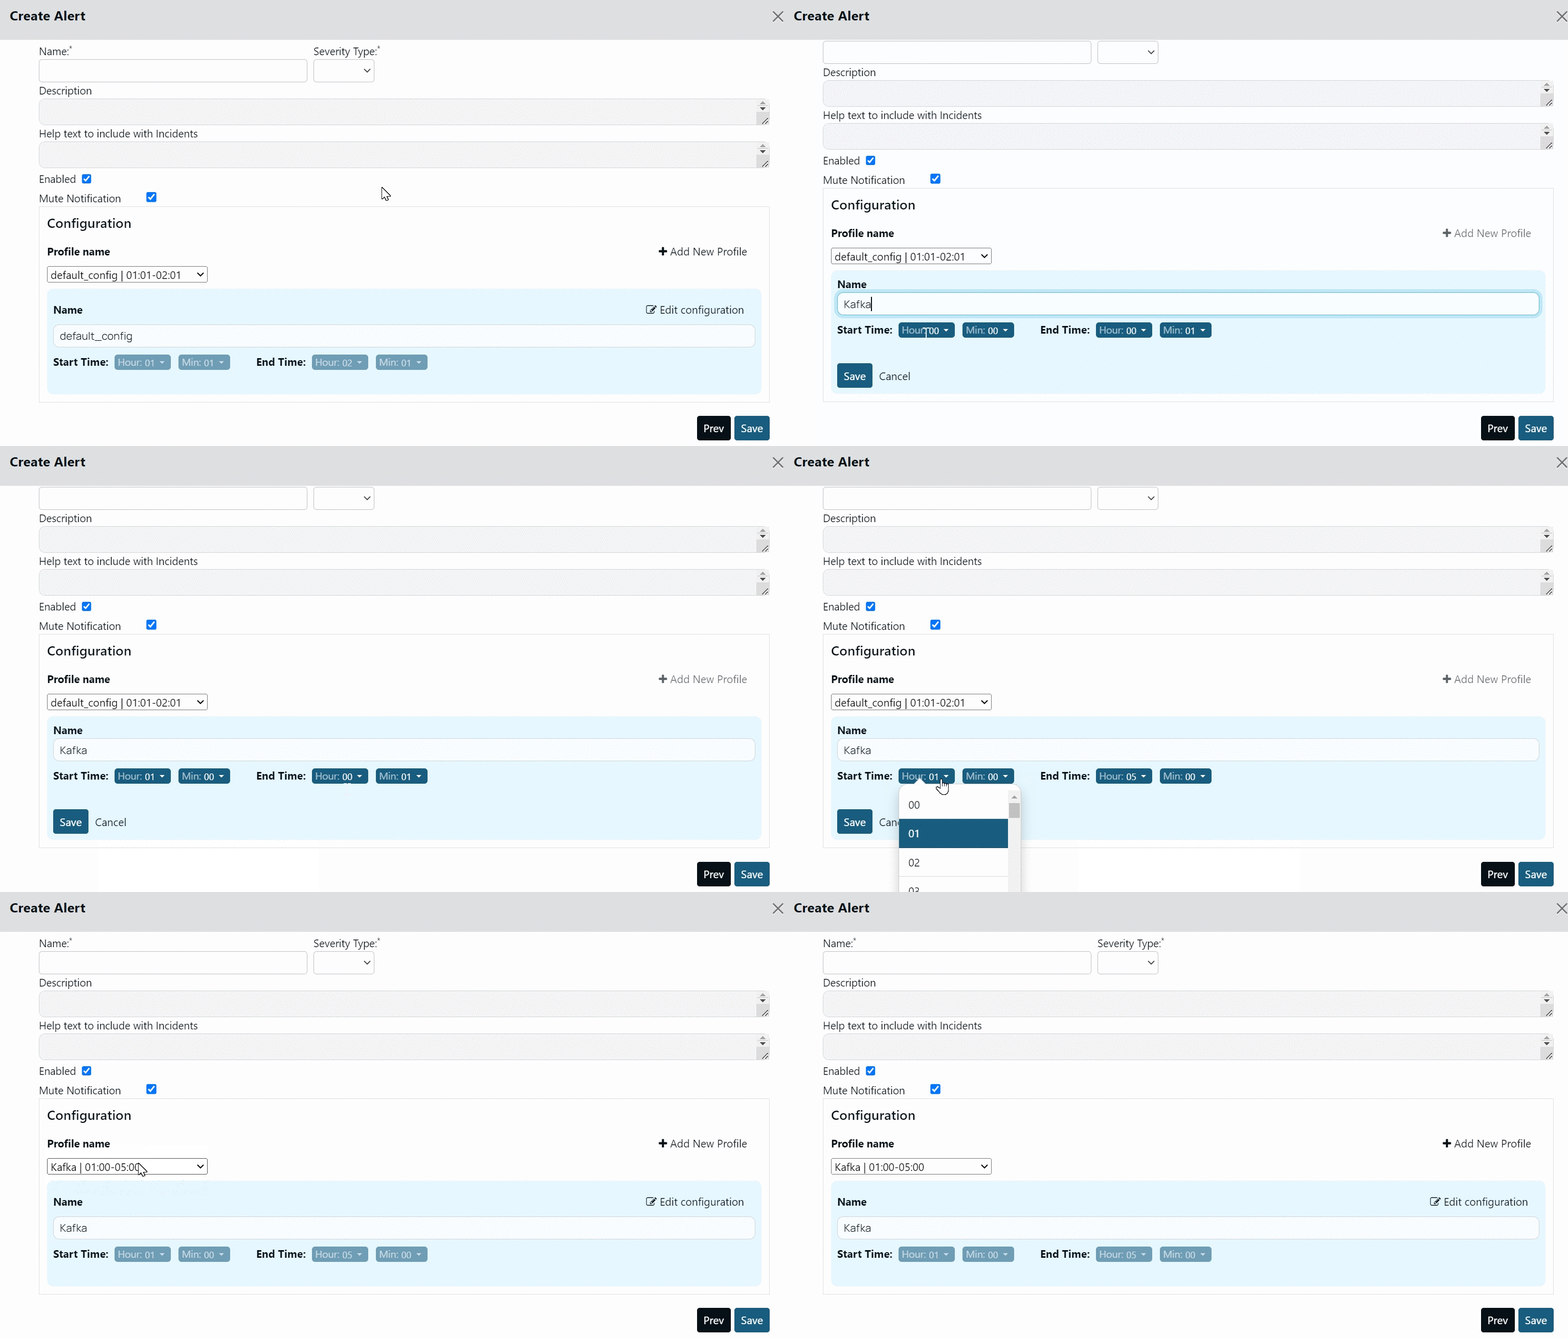
Bulk Mute Profile Configuration
You can assign a single Profile to multiple alerts. All the selected alerts are muted during the time period set in the Profile. This feature is useful when you wish to set a single profile to multiple alerts. Instead of opening each alert and setting the Profile, you can select all the required alerts from the alert list page and assign the required profile.
To Bulk assign a Profile:
- Select the check box for the required alerts on the alert list page.
- In the Actions for Selected Alerts drop-down menu, select Mute Notification.
- Select a Profile or create a Profile and select it.
- Click Save Configuration.
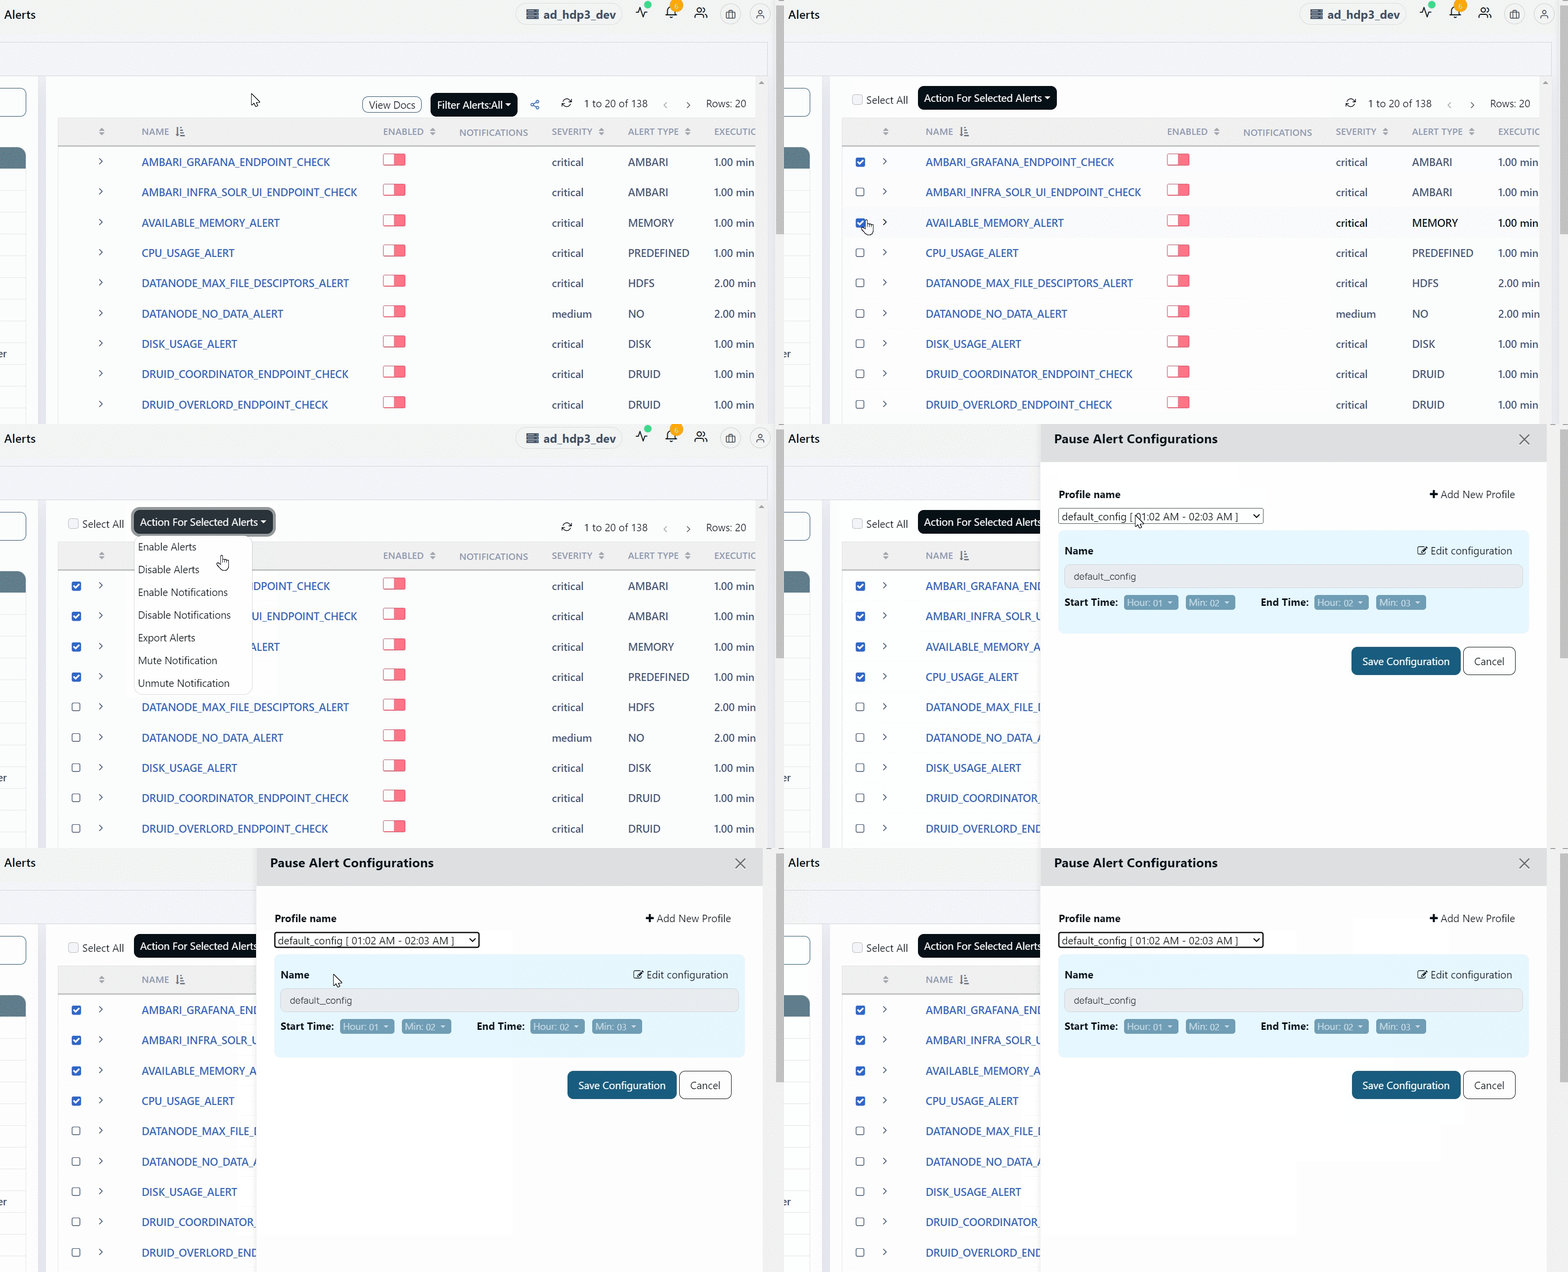
Steps to Create Alerts
This section lists a summary of procedural steps to create alerts. Acceldata recommends you to get acquainted with the above sections of the document and then proceed with this section.
- Navigate to Alerts > Alerts. The alert dashboard is displayed.
- Click + Create Alert. The Create Alert page is displayed.
- (Optional) Click JSON to use the JSON view to create an alert.
- Select a Category.
- Configure the fields in the Expression stage and then click Next.
Note: To go back to a previous stage, click Prev.
- (Optional) Configure the fields in the Notifications stage and click Next.
- (Optional) Configure the fields in the Auto Actions stage and click Next..
- Configure the fields in the Auto Actions stage.
- Click Save.
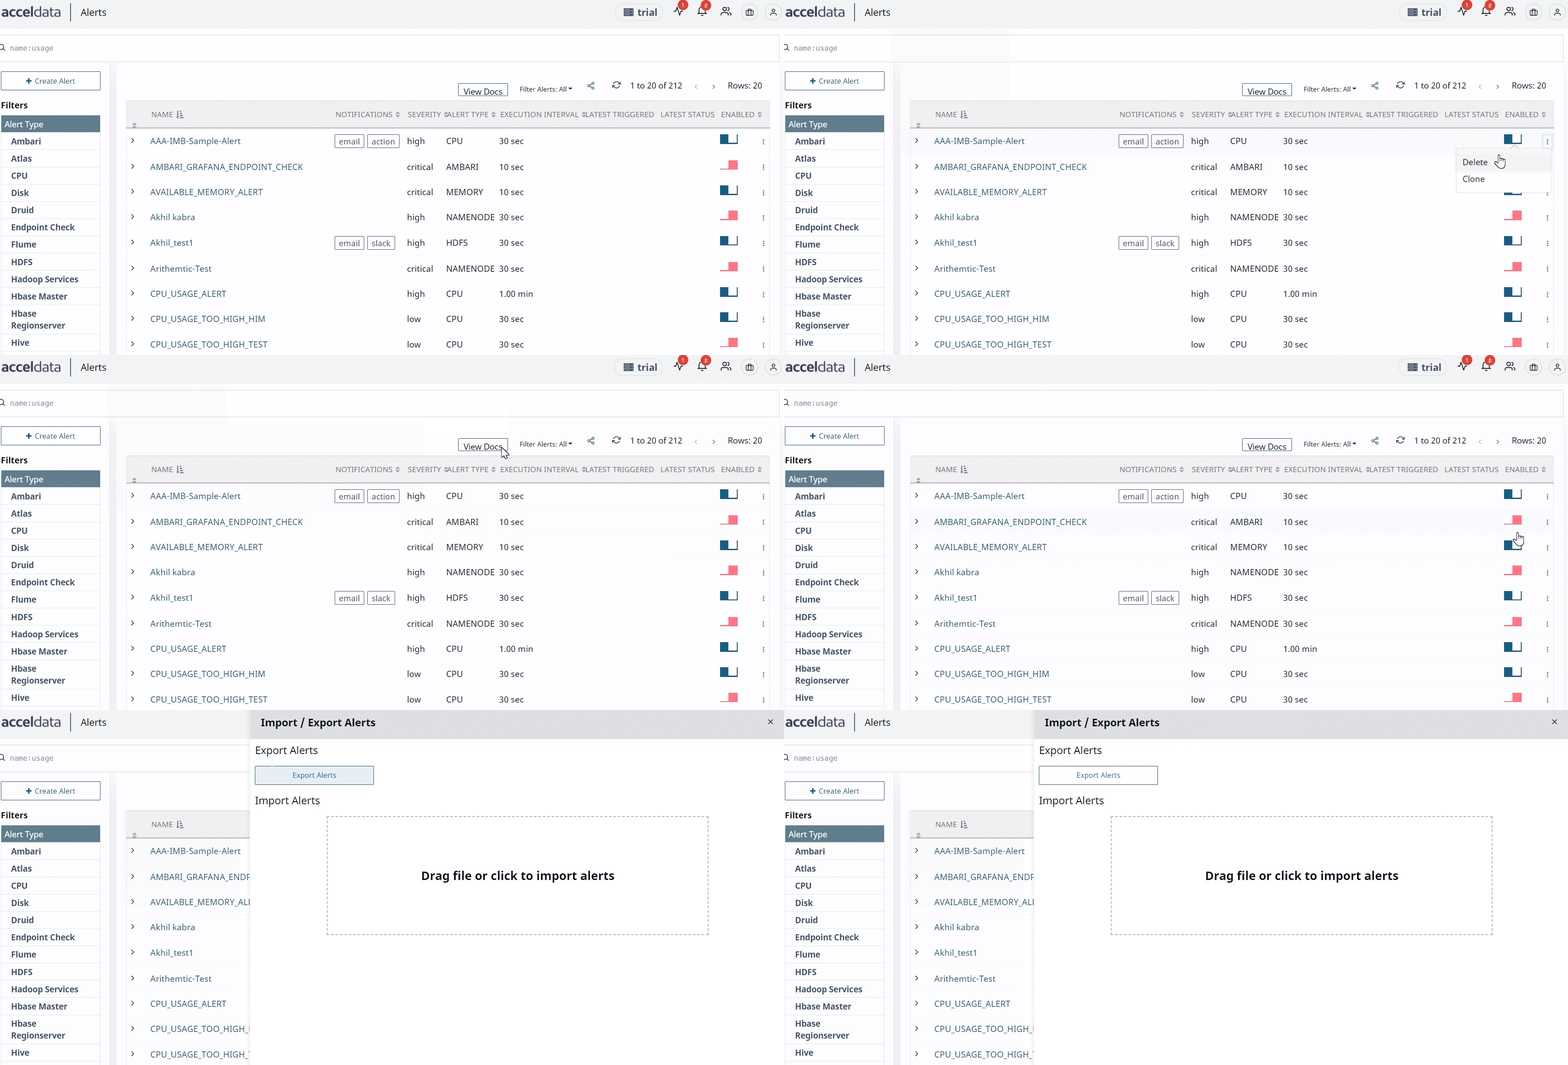
Miscellaneous Alert Tasks
You can perform the following additional tasks on alerts on the alerts dashboard.
- Click the ellipsis menu for an alert and select Delete, to delete an alert.
- Click the ellipsis menu for an alert and select Clone, to clone an alert.
- Click the toggle switch under the Enabled column, to enable to disable an alert.
- Click the Import & Export Alerts button to import or export alerts. You can import JSON extension files as alerts. The alerts are exported as JSON files.
Bulk Enable or Disable Alerts
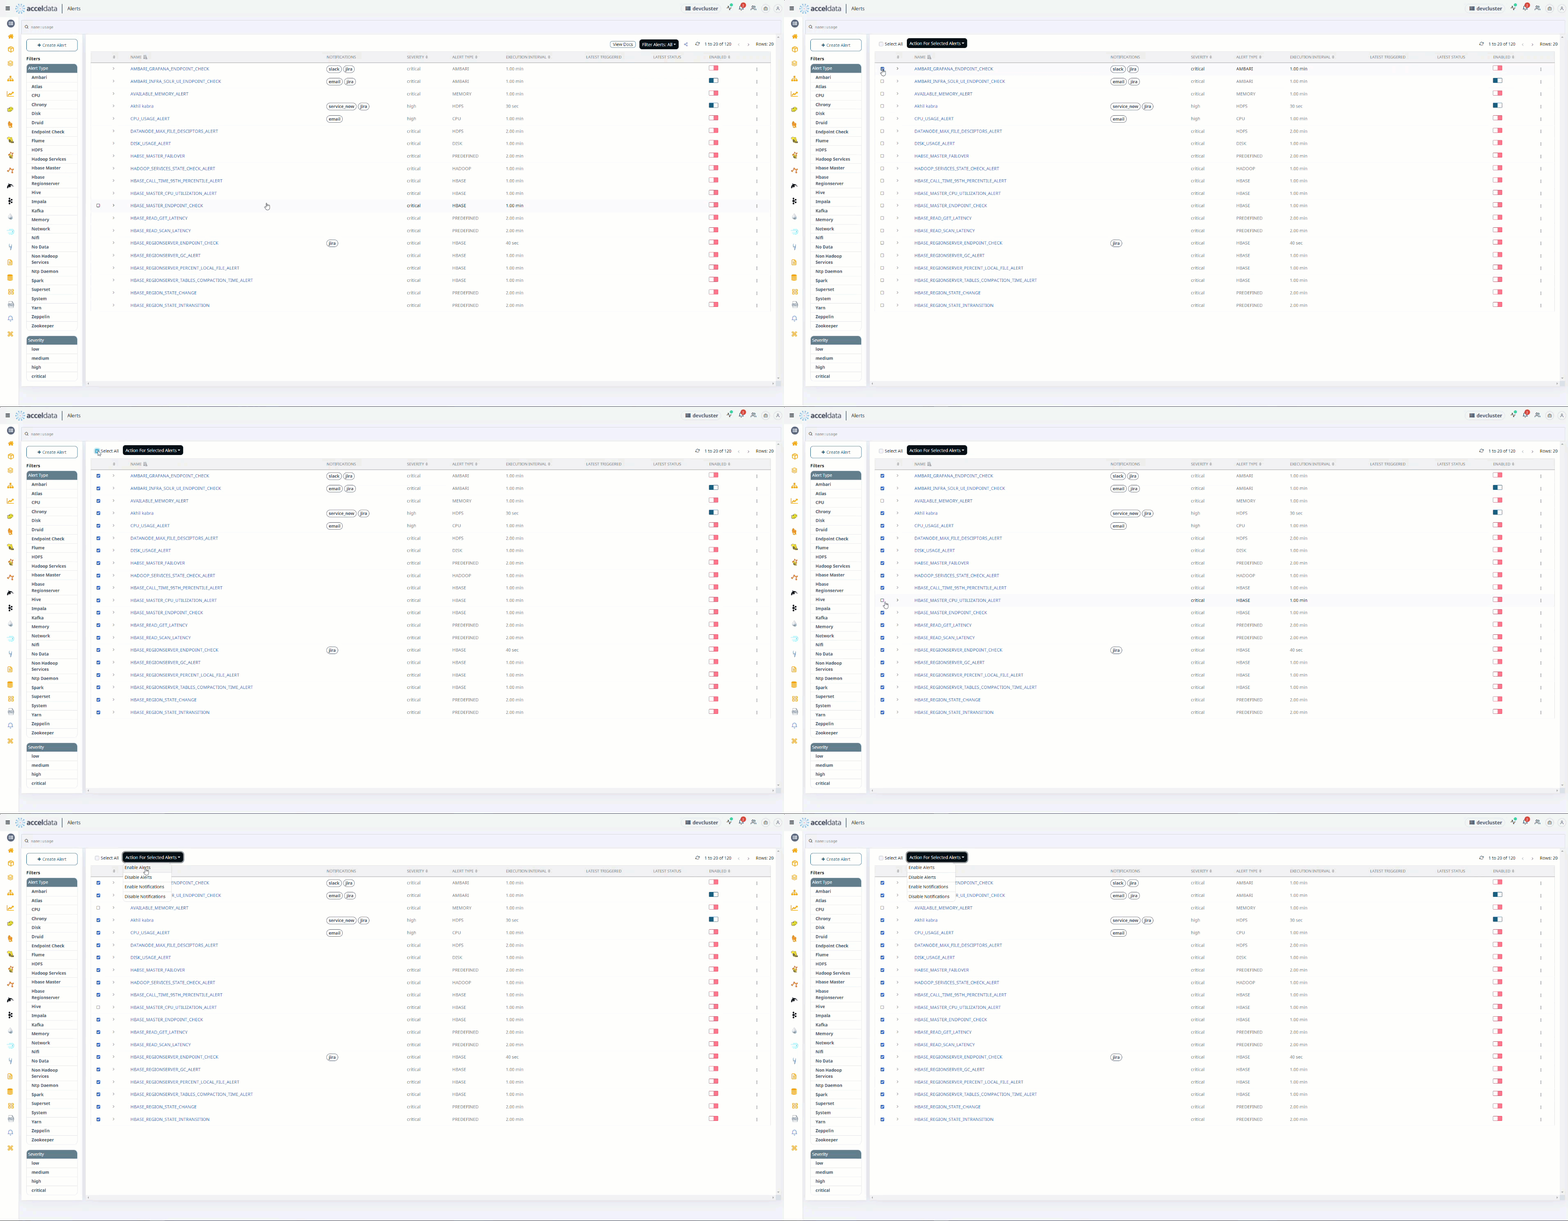
You can now bulk enable the alerts by performing the following actions.
- Hover the mouse over the left side of the table on the Alerts page.
- Check any one of the check boxes.
- At the top of the left side header menu, a box appears. When you check the box, all of the Alerts in the table are selected.
- To perform the action on the selected Alerts, select the actions from the drop box Actions for Selected Alerts on the right.
The Select All option only works for the current Rows size. If the row size is increased, uncheck and recheck the Select All checkbox.
Bulk Enable Alerts