HBase Region Server Details
Click the region server to view its details. The Region Server Details page for the selected region server is displayed.
The following are the list of the panel displayed in the Region Server Details page:
- Summary Panel
- Tables Hotspots
- Tables
- JVM Usage
- Cache
- Region Server Operations
- Compaction Metrics
- RPC Metrics
- WAL Operations
- Compaction
- Regions Servers Tasks
- Error & Fatal Logs
- Node Server Details
Summary Panel
The summary panel of the Region Server details page displays the following metrics:
| Metrics | Description |
|---|---|
| Size | The size of the region server |
| Req Rate /Sec | The number of requests per second |
| Read Count | The number of reads in the region server |
| Write Count | The number of writes in the region server |
| # Tables | The number of tables |
| Heap Used | Storage space used by the region server |
| Heap Allocated | Storage space allocated to the region server |
| WAL Size | Total files sized of Write-Ahead-Logs in the region server |
| WAL File Count | The number of Write-Ahead-Logs files in the region server |
| Block Cache Hit % | Percentage of Block Cache hits per second in the Region Server |
| Compaction Time | Time taken for compaction. |
| Compaction Queue Size | Number of stores in the regions that have been targeted for compaction |
| Flush Time | Time taken to flush Memory Stores. |
| Flush Queue Size | The number of Flush operations waiting to be processed in the Region Server. A higher number indicates the flush operations are slow. |
| RPC Processing Time | Latency for RPC calls to be processed in the Region Server |
| RPC Queue time | Latency for RPC calls to stay in the RPC queue in the Region Server |
| File Read Latency | File system level read latency at Operating System level per Region Server |
| File Write Latency | File system level write latency at Operating System level per Region Server |
Tables Hotspots
Hotspotting occurs when a single region server receives most or all of the read and write requests.
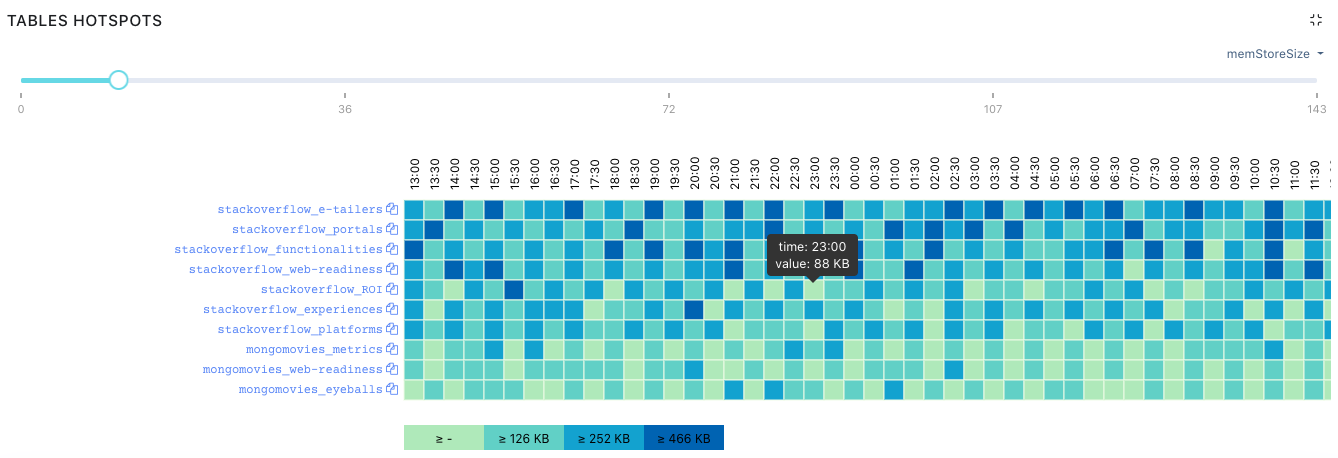
Table Hotspots displays a heat map chart used to represent the intensity of hotspots for the existing tables or regions servers. You can view the table hotspots by the following sorting parameters:
- Read Request Count
- Mem Store Size
- Write Request Count
- Store File Size

Hover over the colored boxes which represent regions on the chart to view the time and value for the selected metric. Click the regions or colored boxes to view the region size in the HBase Table Details page.
Move over the slider bar to view the corresponding memory store size data in the table hotspots chart.
To copy the table name, click the
Tables
All the tables that are processed by the region server are displayed here.
The following table describes all the table properties in the region server.
| Property Name | Description |
|---|---|
| Table Name | Name of the table in the region server. Click the table name to view the table details in the HBase Table Details page. |
| Size on Disk | Size of table on the disk |
| Store File Size | Size of the store files in the region server |
| # of Regions | The number of regions in the region server |
| # of Store Files | Number of store files in the region server |
| Mem Store Size | Memstore size in the region server |
| Read Request Count | The number of read requests sent to the table in the region server |
| Write Request Count | The number of write requests sent to the table in the region server |
Store File Metrics
Click the
| Field Name | Description |
|---|---|
| Region | Name of the the region server |
| Num Store | The number of stores in the region server. |
| Num Store File | The total number of store files in the region server. |
| Store File Size Uncompressed | Size of uncompressed files stored on the disk. |
| Store File Size | Size of compressed files stored on the disk. |
| Index Size | The size of Index. |
| Bloom Size | The size of the bloom filter. |
| Data Locality | The size of the data local. |
JVM Usage
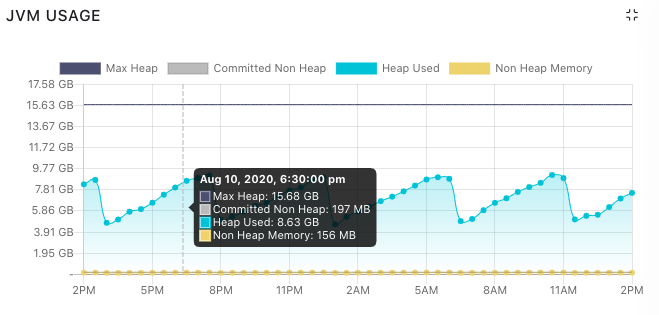
The JVM Memory Usage chart displays the amount of JVM memory used by processes in the cluster based on the following metrics.
- Max Heap: The maximum amount of heap memory allocated by the JVM
- Committed Non Heap: The amount of allocated memory other than the heap memory in the JVM
- Heap Used: The amount of heap memory used by the JVM
- Non Heap Memory: The amount of memory other than the heap memory in the JVM

GC Metrics
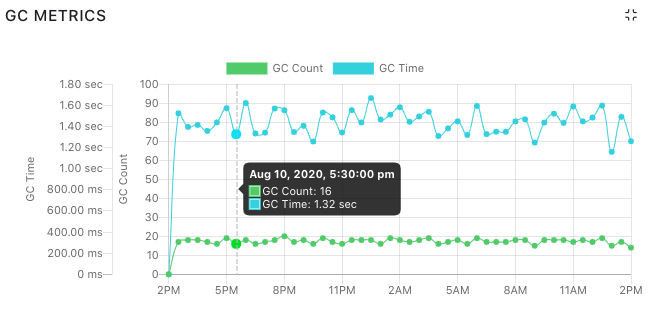
Garbage Collection (GC) Metrics chart displays the amount and time spent on Java garbage collections based on following metrics at a particular time:
- GC Count: Count of number of times Garbage Collection happened in the Region Servers JVM.
- GC Time: Aggregation of time spent by the region server JVM in Garbage collection.
- Hover over the chart to view the values for each metric.

alt
Cache
Cache tile includes the following four charts:
Block Cache Usage: It is a time-series chart displaying the cache size and cache free metric at a particular time. Hover over the chart to view the values for each metric.
MemStore Usage: Displays the memory in heap occupied by Memstore(Write Buffer). Hover over the chart to view the mem store usage value.
Block Cache Count Vs Evicted: Number of blocks present in Offheap Block Cache(Read Buffer)/ the number of blocks evicted from Offheap Block Cache (Read Buffer). The following metrics are displayed in the chart:
- The number of blocks.
- The number of blocks evicted Hover over the chart to view the values of each metric at a particular time.
MemStore Metrics: This chart displays the following two metrics:
- Flush Size
- Flush Queue Size
Region Server Operations
Region Server Operations tiles displays the following charts according to the Get, Append, Increments, Puts, or Deletes operation selected. To view values for only particular region server operations, click the unwanted operations to remove their statistics from the charts.
| Operation | Description |
|---|---|
| Region Server Operation Duration | Time taken to execute the operation |
| Region Server Operation Number | The number of operations completed |
| Slow Operation | The number of requests that took more than 1 second in the region server. Hover over each chart to view the values of each metric at a particular time. |
Compaction Metrics
The Compaction Metrics chart displays the following metrics:
| Metric | Description |
|---|---|
| Compaction Size | The size of compactions run |
| Compaction Time | The time taken by the compaction process |
| Compaction Queue Size | The number of stores in the regions that have been targeted for compaction |
Hover over the chart to view the value of each metric at a particular time.
RPC Metrics
The RPC Metrics chart displays the following metrics:
- Queue Time
- Processing Time
Hover over the chart to view the value of each metric at a particular time.
WAL Operations
The WAL Operations chart displays values for both Syncs and Append Metrics.
- Syncs: Syncs in Write-Ahead-Log is used to commit many transactions when the server is trying to process many small transactions.
- Appends: Updates are appended to the tail of the Write-Ahead-Log because if the update is directly written to its respective partition in the disk, then its performance gets affected.
To view statistics of only one metric on chart, click the metric you don't want to view to disable it. Hover over the chart to view the values of the metric selected.
If you are viewing the Syncs chart, the number of Syncs and Syncs Times metric at a particular time can be viewed.
If you are viewing the Appends chart, the number of Appends and Appends Times metric at a particular time can be viewed.
Compaction
Compaction in HBase is used to manage small files that were created from large files. Major compaction is used for multiple files into one file and minor compaction is used for two files into one.
The following table describes the compaction details for the selected table.
| Metric | Description |
|---|---|
| Table | Table name |
| Region | Region name |
| Num. Compacting KVs | Number of key values in compacting state. |
| Num. Compacted KVs | Number of key values that have finished compacting. |
| Compaction Progress | Percentage of the compaction progress. |
Regions Servers Tasks
The following table describes the metrics for the region server tasks:
| Metric | Description |
|---|---|
| Start Time | Date and time at which the region server was initiated. |
| Description | Description of the region server like its name, type and number of handlers, number of queues,and port number. |
| State | Current state of the region server |
| Status | Current status of the region server task |
Error & Fatal Logs
Error & Fatal Logs is a table that display all the errors that have occurred. It displays the Log Time and Message about the error.
To view all logs, click the log icon. The Logs page is displayed.
Node Server Details
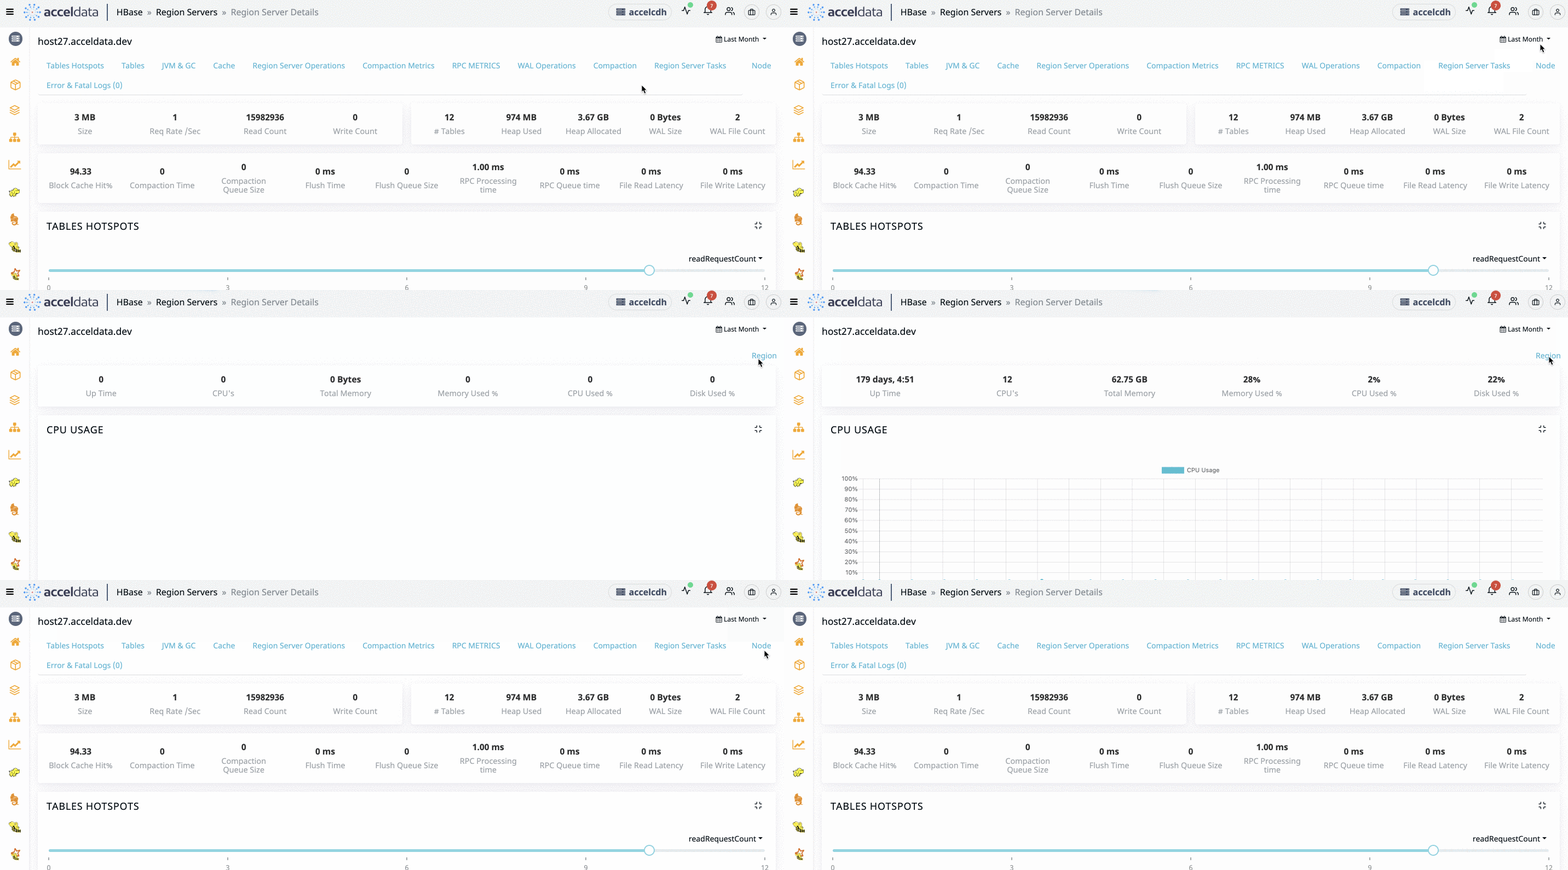
Click the Node from the top navigation panel, the node server details is displayed. To go back to Region Server Details Click Region. For more information, refer to the following illustration:

Summary Panel
The following table provides details of the summary panel:
| Metrics | Description |
|---|---|
| Up Time | The time that the node is available and working. |
| CPU's | The number of CPUs in the node. |
| Total Memory | The total memory allocated to the node. |
| Memory Used % | The amount of memory used (in %). |
| CPU Used % | The amount of CPU used (in %). |
| Disk Used % | The amount of disk used (in %). |
Charts in the Node Server Details
The following table provides description of the charts in the Node Server Details page:
| Chart Name | Description |
|---|---|
| CPU Usage | The percentage of CPU Usage by the node. |
| Disk Usage | The percentage of Disk Usage by the node. |
| Network Usage per Second | The network throughput measured for every second. |
| Memory Usage | The amount of memory utilized by the node. |
IO Usage
The IO Usage charts describe the number of input bytes read and the number of output bytes written to a node. The following IO metrics are displayed:
| Chart Name | Description |
|---|---|
| I/O OPS | The input/output operations per second. This chart displays the data for Read IOPS and Write IOPS. |
| I/T Time | The time utilized by input/output operations. This chart displays Read Time and Write Time (in ms) of I/O operations in a node. |
| I/O Bytes | The size of I/O operations. This chart displays the size of incoming and outgoing operations in the form of Read Bytes and Write Bytes. |
| I/O Request Time | The time taken by I/O requests waiting in queue to execute. |