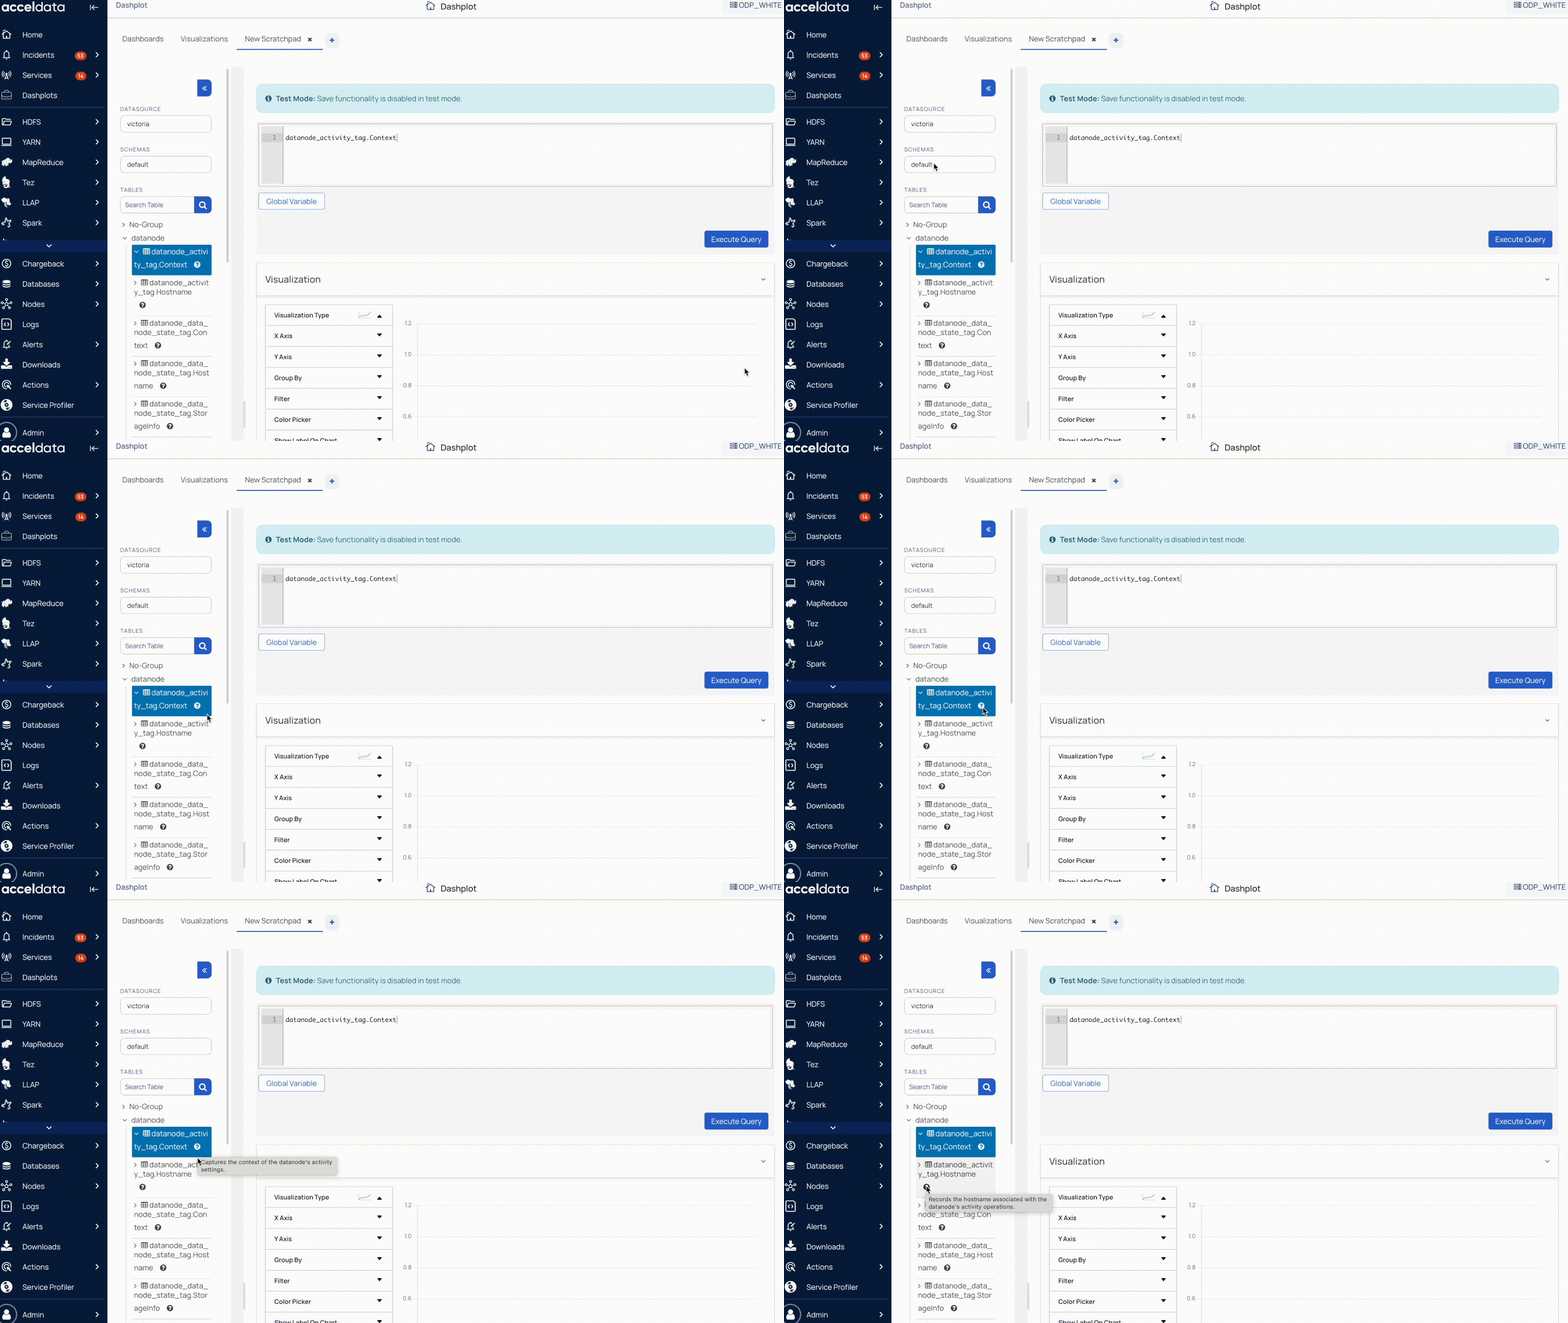
The Metric Search capability enables you to quickly find and understand metrics and their purpose within the platform.
This enables you to:
Simplify metric discovery across Pulse.
Help you understand metric definitions and their usage context.
Enhance dashboard creation and visualization accuracy.
Improve efficiency in monitoring and troubleshooting workflows.
Before You Begin
To use Metric Search in Pulse, ensure that the Metric Search add-on service is deployed in your Pulse environment. For details, see Deploy Metric Search Add-on Service.
Enable Metric Search
After deployment, configure the METRIC_SEARCH_ENABLED setting in the ad-core.yml file.
File path:
If the Metric Search container is deployed, set the following configuration:
This setting indicates that the Metric Search container is available and prevents unnecessary network calls when the container isn't deployed. It doesn't enable or disable the Metric Search functionality.
Access Metric Search
Once deployed, you can access Metric Search directly from the Pulse UI.
Steps
In the Pulse UI, go to Alerts > Alerts.
On the Alerts page, click View Docs.
On the Documentation page, enter any keyword in the Metric Search bar to view the metric’s purpose and details within Pulse.
This feature helps you discover, understand, and interpret metrics quickly, improving your ability to troubleshoot and optimize system performance.
Using Metric Search in Dashplot Studio
The Metric Search capability also enhances the experience in Dashplot Studio by providing helpful descriptions when selecting metrics for visualizations.
This context helps ensure you select the right metric and build accurate, meaningful visualizations.