Title
Create new category
Edit page index title
Edit category
Edit link
Track Pulse Statistics
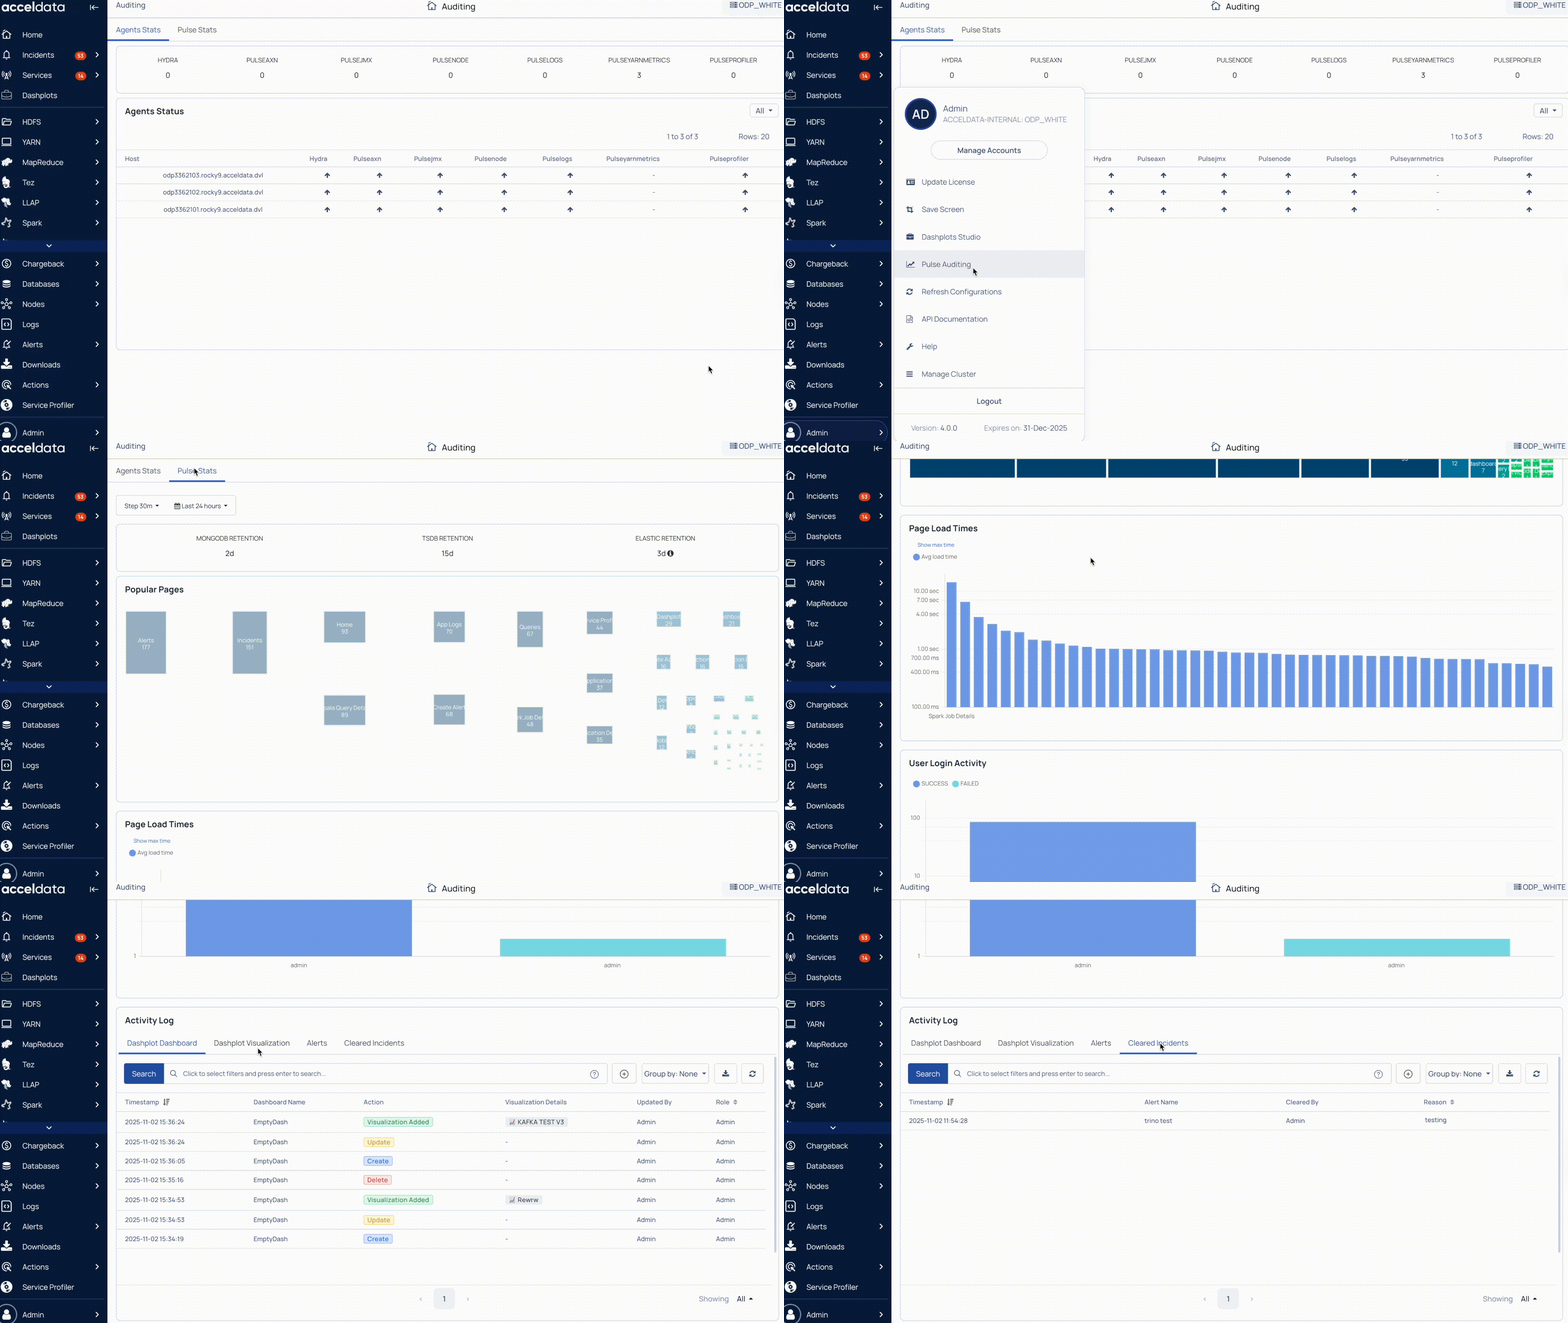
You can monitor data retention period, user activity charts, and activity logs to optimize performance and understand user engagement.
Steps
- In the Pulse UI, go to Admin (bottom left).
- On the Admin page, select Pulse Auditing.
- On the Pulse Auditing page, select the Pulse Stats tab.
- On the Pulse Stats tab:
- Time Range: Choose a time range (for example, Today, Last 12 hours, or Last 3 months)
- Refresh Interval: Set a refresh interval (such as 10 s, 20 m, 2 h, 4 d, or 1 w)
- This helps you view timely and relevant data.
The Pulse statistics appear on the screen.

Data Retention Summary
- MongoDB retention: View the number of days job, event, query, etc. data is stored in the MongoDB database.
- TSDB retention: View the number of days time-series data is stored in the VictoriaMetrics (TSDB) database.
- Elasticsearch retention: View the number of days log and index data is stored in the ElasticSearch database.
User Activity Charts
These charts provide insights into user interactions within Pulse:
- Popular Pages: See the most visited Pulse UI pages and the number of times each page is accessed.
- Page Load Times: Monitor the average and maximum load times for each page to identify performance bottlenecks.
- Login Activity: Track successful and failed logins for each user to understand access patterns and usage issues.
Track Activity Logs
The Activity Log capability in Pulse Audit tracks user activity across key areas of Pulse, including the following:
- Dashplot Dashboard
- Dashplot Visualization
- Alerts
- Cleared Incidents
You can click the respective tabs to view detailed activity logs for each capability.
Dashplot Dashboard
Track all user interactions related to the dashplot dashboards.
- Timestamp: The date and time when the dashboard was created, updated, or removed, or when a visualization was added or removed.
- Dashboard Name: The name of the dashboard affected by the action.
- Action: shows the user’s activity, such as creating, updating, or deleting a dashboard, or adding/removing a visualization.
- Visualization Details: Displays the details of any visualization involved in the action.
- Updated By: The user who performed the action.
- Role: The role of the user who performed the action.
Dashplot Visualization
Monitor activities related to individual dashplot visualizations.
- Timestamp: The date and time when the visualization was created or updated.
- Visualization Name: The name of the visualization.
- Action: Shows the user’s activity, such as creating or updating a visualization.
- Updated By: The user who performed the action.
- Role: The role of the user who performed the action.
Alerts
View user actions related to alert configuration and status.
- Timestamp: The date and time when an alert was created, enabled, or disabled.
- Alert Name: The name of the alert.
- Action: Shows the user’s activity, such as creating, enabling, or disabling an alert.
- Updated By: The user who performed the action.
- Role: The role of the user who performed the action.
Cleared Incidents
Track incident resolution activity.
- Timestamp: The date and time when an incident was cleared.
- Alert Name: The name of the alert associated with the cleared incident.
- Cleared By: The user who cleared the incident.
- Reason: The reason provided for clearing the incident.
Key Features
Each tab in Activity Log includes options to refine and analyze activity logs efficiently:
- Search: Search and filter records based on keywords, user names, actions, etc.
- Save Search: Save a custom search query using the + icon and reuse it later. Click Search to view saved queries.
- Group By: Group the results by parameters such as User, Action, Updated, etc., for structured insights.
- Download: Export activity logs for reporting and compliance.
- Refresh: Refresh the activity table to view real-time data.
For additional help, contact www.acceldata.force.com OR call our service desk +1 844 9433282
Copyright © 2026