Title
Create new category
Edit page index title
Edit category
Edit link
Troubleshoot Using Application Logs
Pulse enables you to search and analyze application logs to troubleshoot issues across your cluster.
These logs capture events from services such as YARN, Kafka, Oozie, etc, giving you visibility to detect anomalies, debug errors, and identify root causes when workloads fail or behave unexpectedly.
Access Application Logs
- In the Pulse UI, go to Logs on the left navigation bar.
- Or, go to Pulse Home and click Logs Summary. The application logs appear on the screen.
- On the Application Logs page, set the time range by selecting Today, Last 12 hours, Last 3 months, or a custom period. Then select Apply.

Features and Functionality
Search Logs
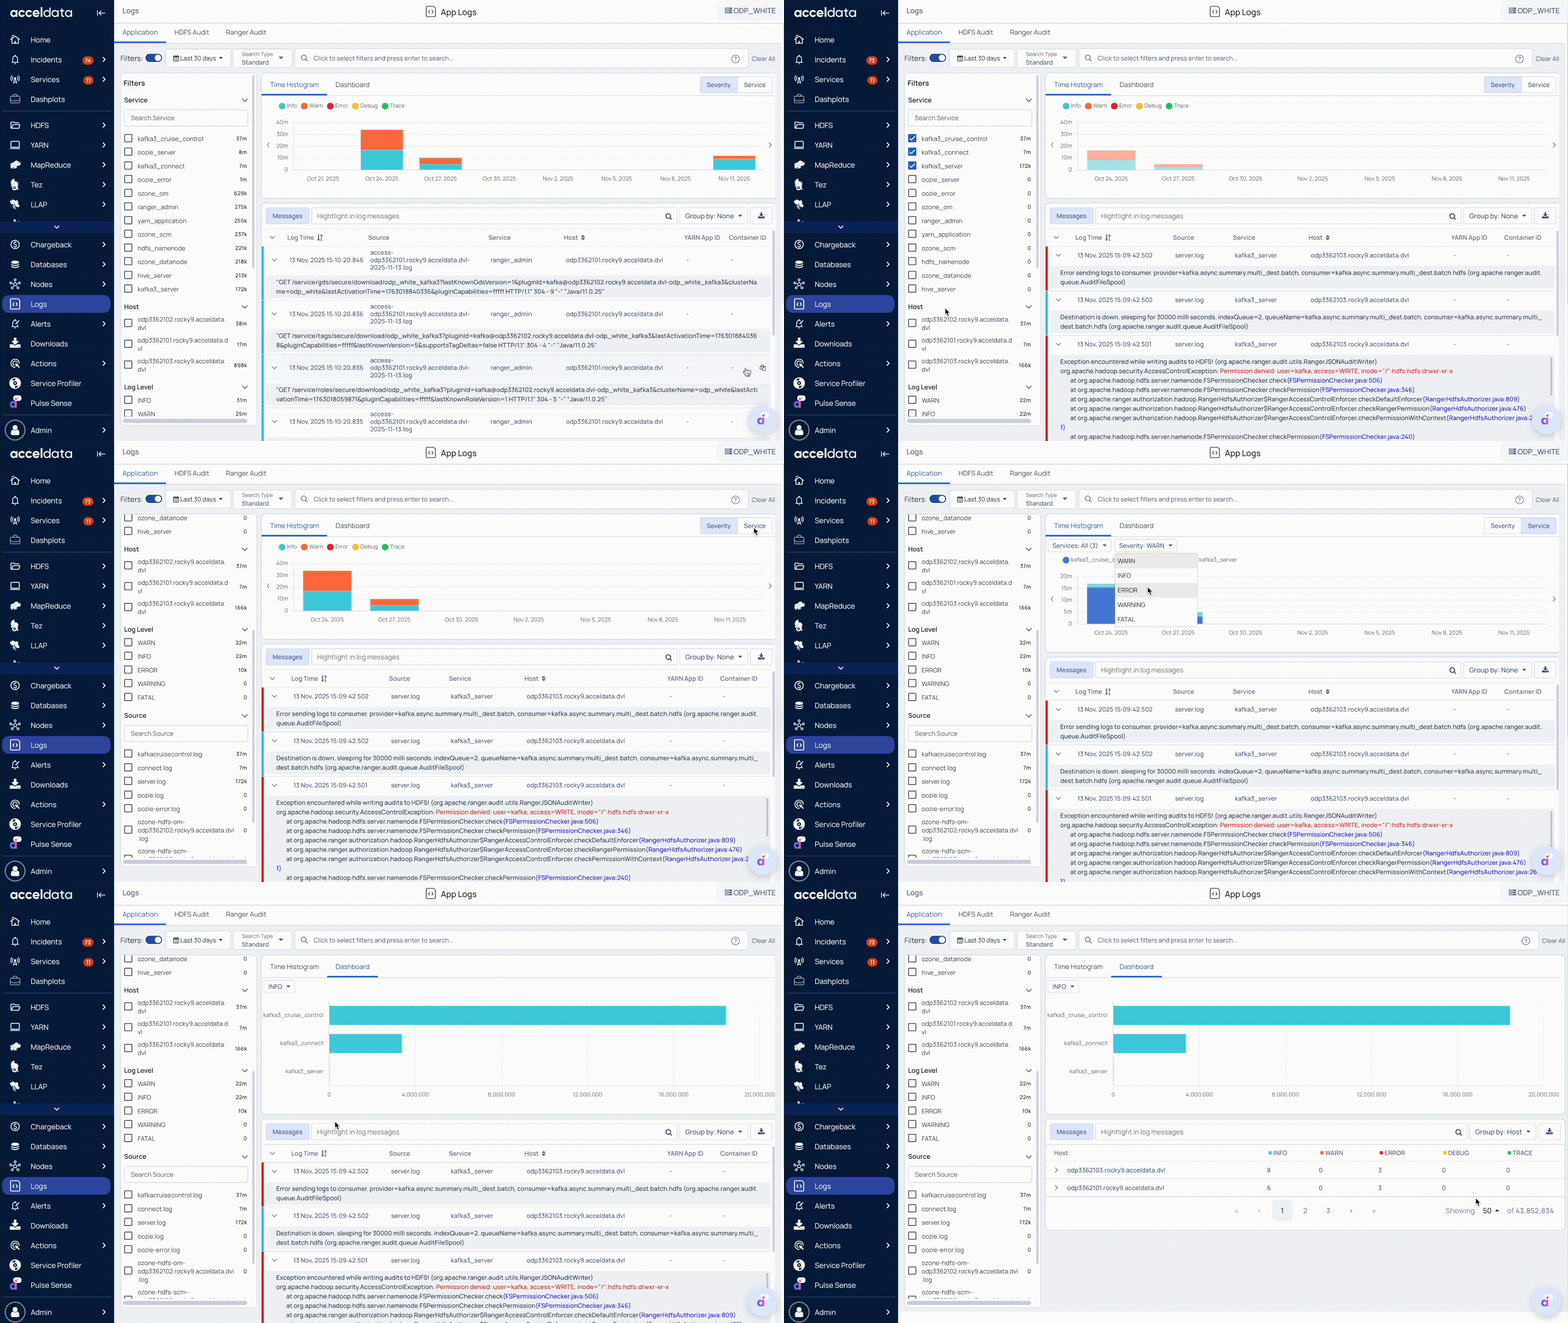
Search for logs of applications and associated services installed in your cluster
On the Logs page, you can choose a search type to locate logs efficiently:
- Standard Search: Use built-in filters such as Source, Service, Host, Yarn App ID, Container ID, Log Level, and Message.
- Elastic QS Search: Use Elastic Query Syntax (QS) to create search queries.
In the search bar, enter your query, and Pulse displays the matching logs within the selected time range.
Best practices:
- Use exact values for accurate results.
- Combine multiple parameters to refine your search.
- For guidelines and examples of standard search queries, see Search and Analyze Records
- For examples of Elastic search queries, see Sample Elasticsearch Queries for Searching Logs.
Filter Logs
On the Logs page, you can narrow down results using filters:
- Service (Kafka, Impala, etc.), Host, or Log Level (Info, Warn, etc.): Select one or multiple options to focus on specific components.
- Multiple Filters: Apply more than one filter at a time to refine your results.
Filtered logs update automatically, including the histogram, dashboard, and detailed message panels.
Visual Log Insights
On the Logs page, Pulse provides interactive visualizations to help you analyze trends and detect anomalies.
Time histograms – Display the number of logs over time.
- You can view the logs by severity or service.
Dashboard view – Summarizes log counts across services by severity levels to provide a snapshot of overall system health and performance.
- You can group logs by service, host, or log level (Info, Warn, Error, Fatal) to quickly spot spikes, anomalies, or recurring issues.
Visualizations update automatically as you apply filters or search queries, ensuring real-time visibility into your cluster’s activity.
Detailed Log Messages
On the Logs page, you can review complete log details for deeper analysis:
- Message Details: View the message body, log time, source, service, hostname, and Yarn App ID, and Container App ID.
- View in Context: See related logs that occurred before and after the selected event for full context.
- Copy Messages: Copy log messages to the clipboard for reuse, reporting, or offline analysis.
- Search messages – Enter keywords to quickly find specific log messages.
Detailed messages update automatically as you apply filters or search queries, helping you troubleshoot issues efficiently.
For more details about the Log Messages, see Application Logs.
Group and Export Logs
On the Logs page, you can organize and export logs to streamline troubleshooting and reporting:
- Group Logs: Organize logs by Trace, “Level or Severity”, or Host for structured analysis.
- Export Logs: Download logs in .xlsx or .logs format for offline analysis, reporting, or compliance purposes.
Grouped and exported logs reflect any filters or search queries applied, ensuring you capture the relevant data efficiently.
For additional help, contact www.acceldata.force.com OR call our service desk +1 844 9433282
Copyright © 2026