The cluster overview page displays Kubernetes cluster details such as CPU and memory metrics, running Spark applications, active users, namespace-level CPU and memory usage, node summaries, and more.
In the Pulse UI, select the Kubernetes cluster. Then, from the left-side menu, navigate to Kubernetes Dashboard > Cluster Overview.
Summary Panel
The summary panel provides CPU and Memory usage, running spark applications, and users running jobs, etc. across the cluster.
| Metric | Description |
|---|---|
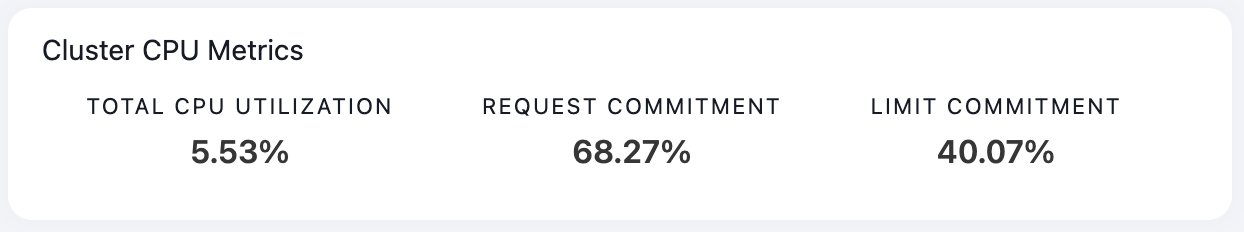
| Cluster CPU Metrics | Total CPU Utilization: The current CPU usage across the cluster. Request Commitment: The percentage of CPU reserved by pod requests. Limit Commitment: The maximum CPU the pods are allowed to use.
|
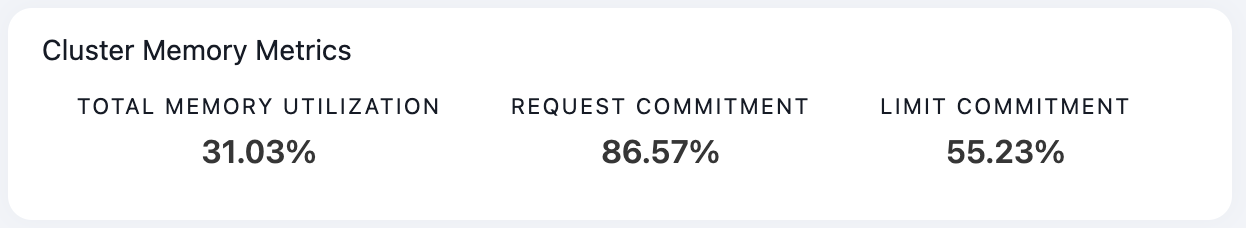
| Cluster Memory Metrics | Total Memory Utilization: The current memory usage across the cluster. Request Commitment: The percentage of memory reserved by pod requests. Limit Commitment: The maximum memory the pods are allowed to use.
|
| Running Spark Apps | The number of running spark applications. |
| Users | The number of users running spark jobs or applications. |
Nodes Summary
The node summary panel provides a list of node instances along with their CPU and memory utilization percentages.
| Metric | Description |
|---|---|
| Instance | The node instance name. |
| CPU Usage | The actual CPU usage on each node. |
| CPU Utilization (in %) | The percentage of CPU usage on each node. |
| Memory Utilization (in %) | The percentage of memory usage on each node. |