A dashboard is a collection of visualizations organized into a single view. Dashboards allow you to monitor related metrics together and create operational views for specific use cases.
Navigation
In the xObserve UI, go to the user icon in the top-right corner.
Navigate to Dashplots Studio from the user menu.
The Dashplots workspace opens with the following tabs:
Dashboards
Visualizations
+, to Create a New Visualization.
Dashboard Page
The Dashboards page allows you to create, organize, manage, and share dashboards.
From this page, you can:
View existing dashboards
Create folders
Create dashboards
Import dashboards
Search dashboards
Edit dashboards
Add visualizations to dashboards
Configure dashboard interactions
Export dashboards
Delete dashboards
Dashboard List
The dashboard list displays the following information:
Type – Dashboard type
Name – Dashboard name
Tags – Associated tags
Last Modified – Timestamp of the most recent modification
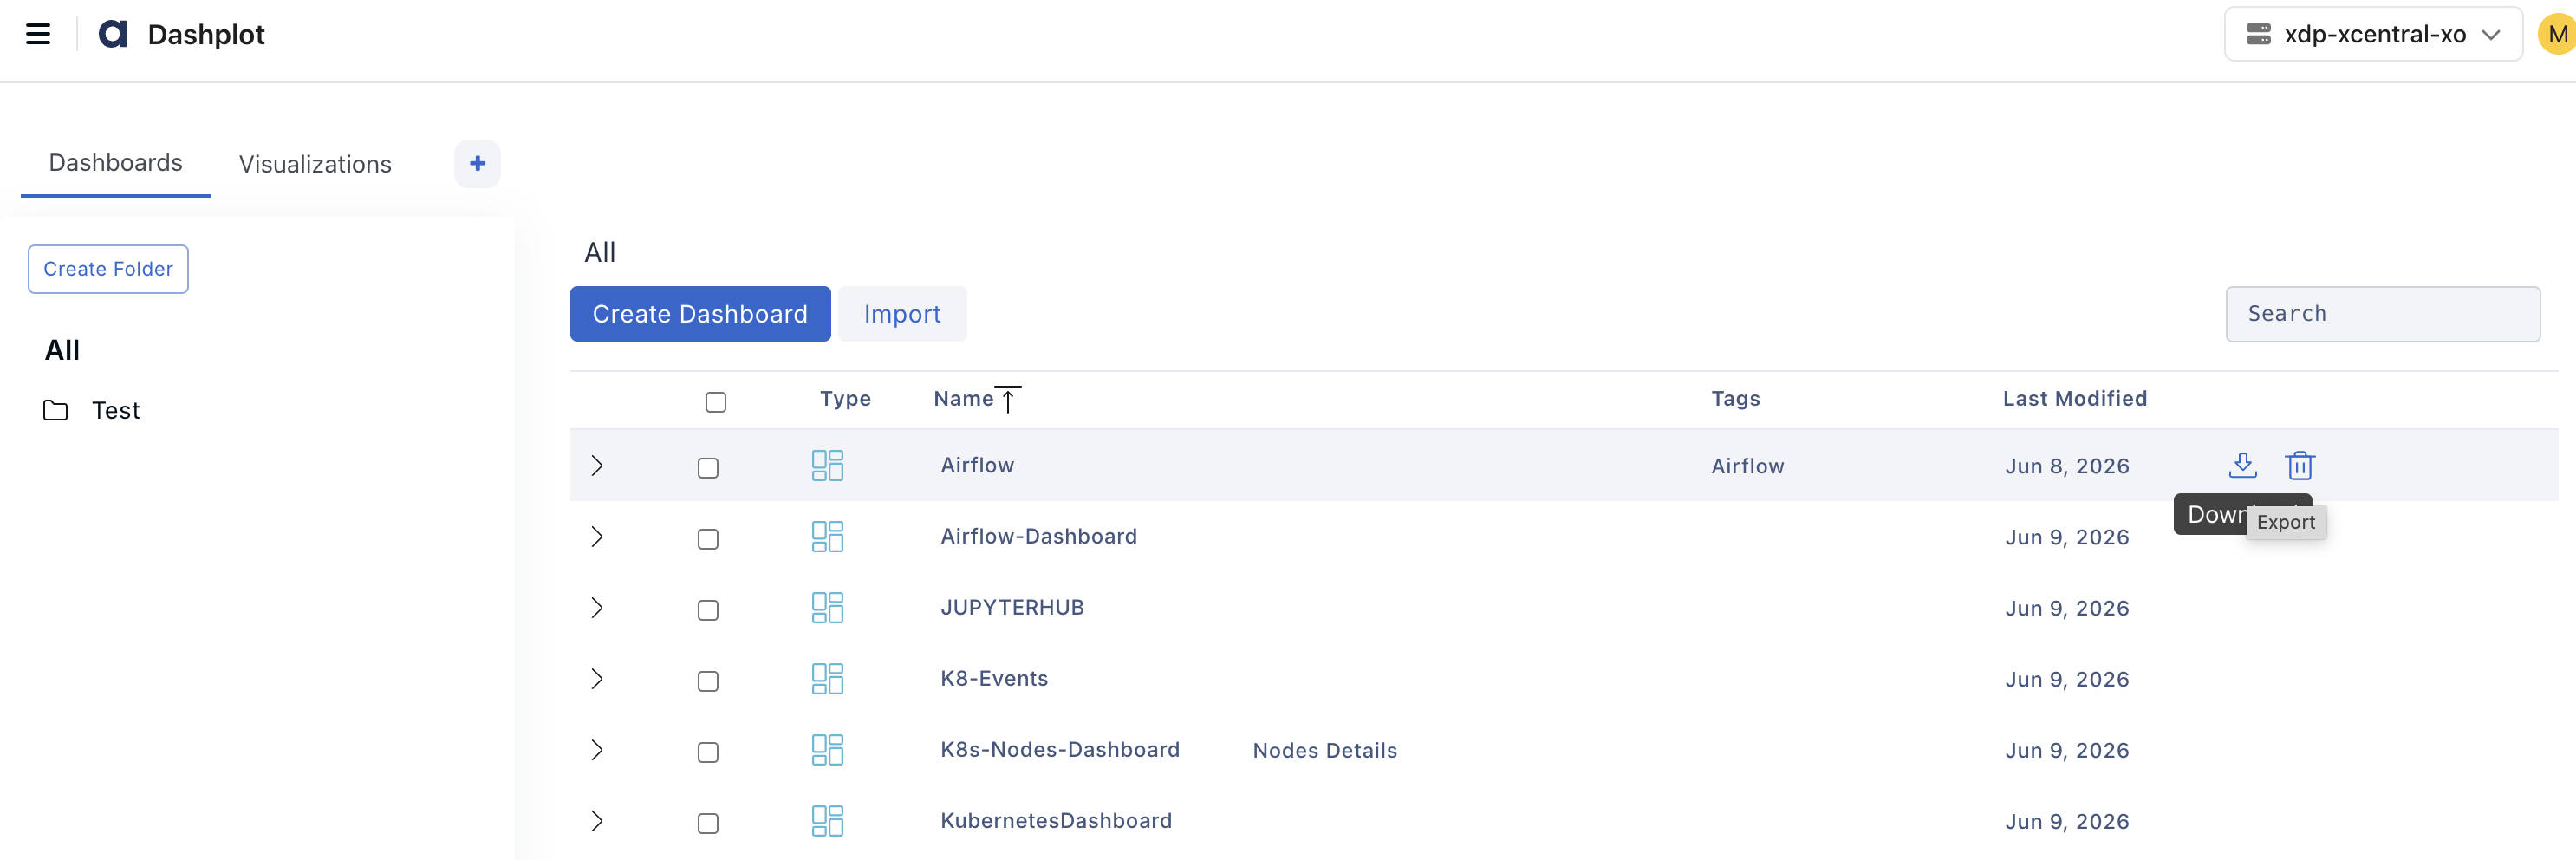
Dashboard Actions
Hover over a dashboard to access the available actions:
Export – Export the dashboard configuration
Delete – Delete the dashboard
Create a Folder
Click Create Folder to create a folder for organizing dashboards.
Folders help organize related dashboards and visualizations. After creating a folder, you can:
Create dashboards within the folder
Add visualizations to dashboards in the folder
Organize dashboards by team, application, or use case
Importing a Dashboard
To import a dashboard:
Click the User icon in the upper-right corner and select Dashplots Studio.
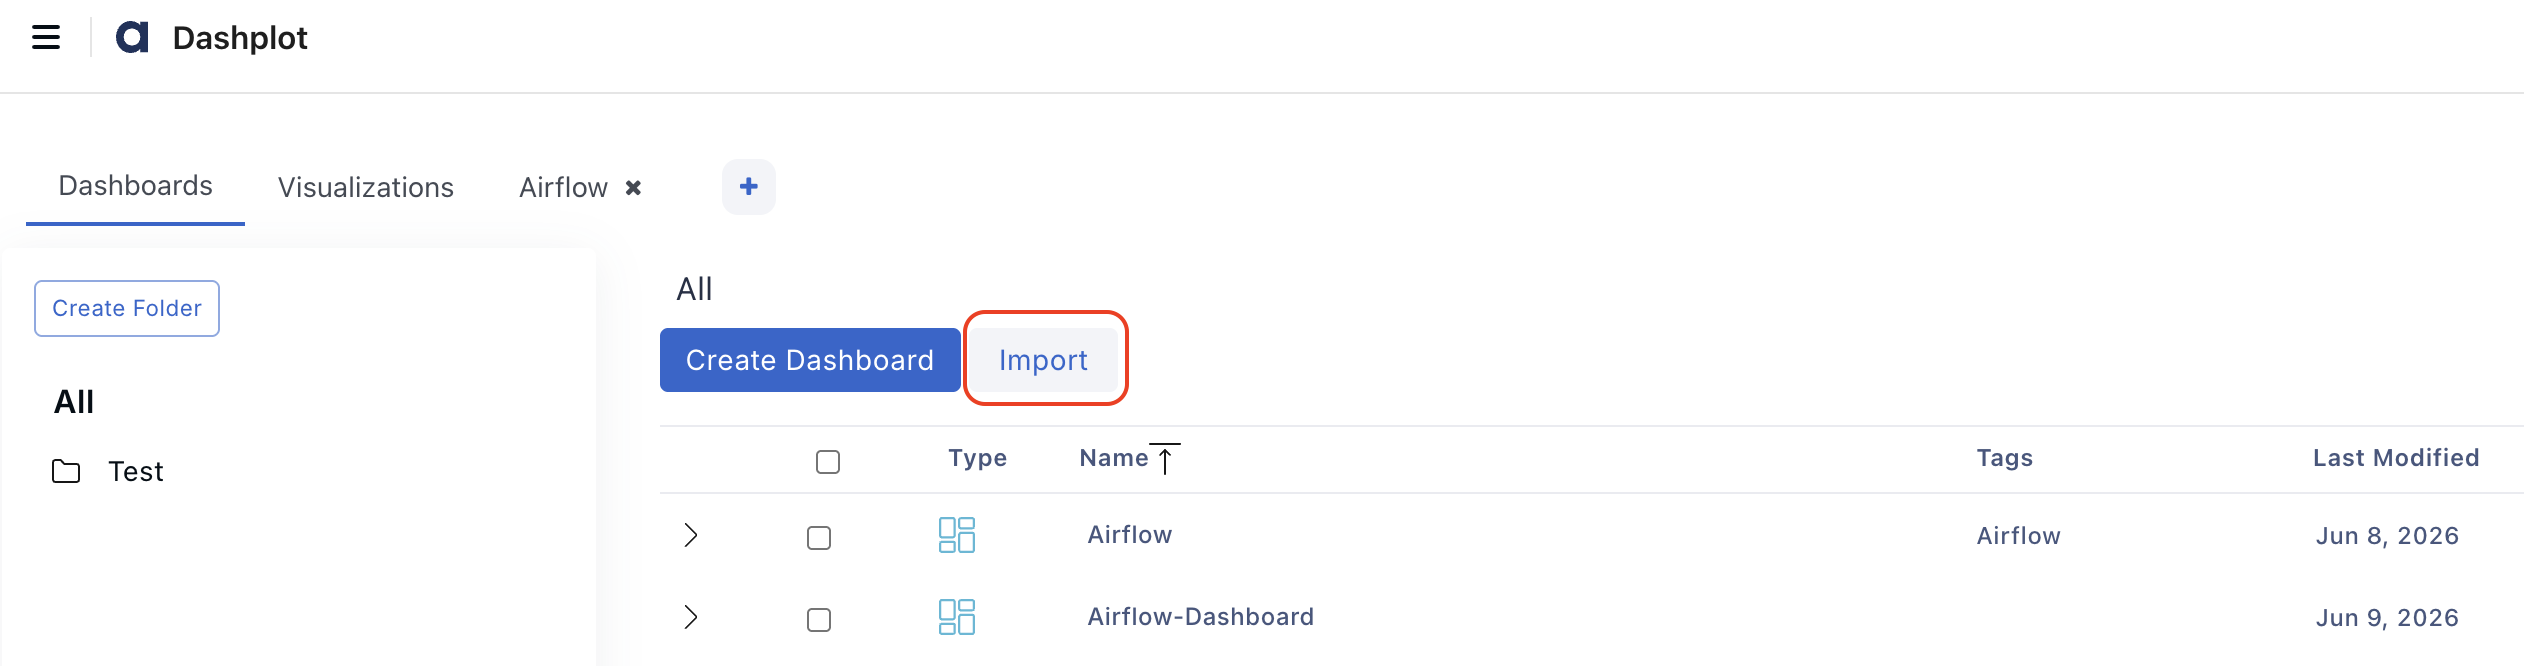
Open the Dashboards tab.
Click Import.
In the Import Directory page, upload the dashboard .zip file.
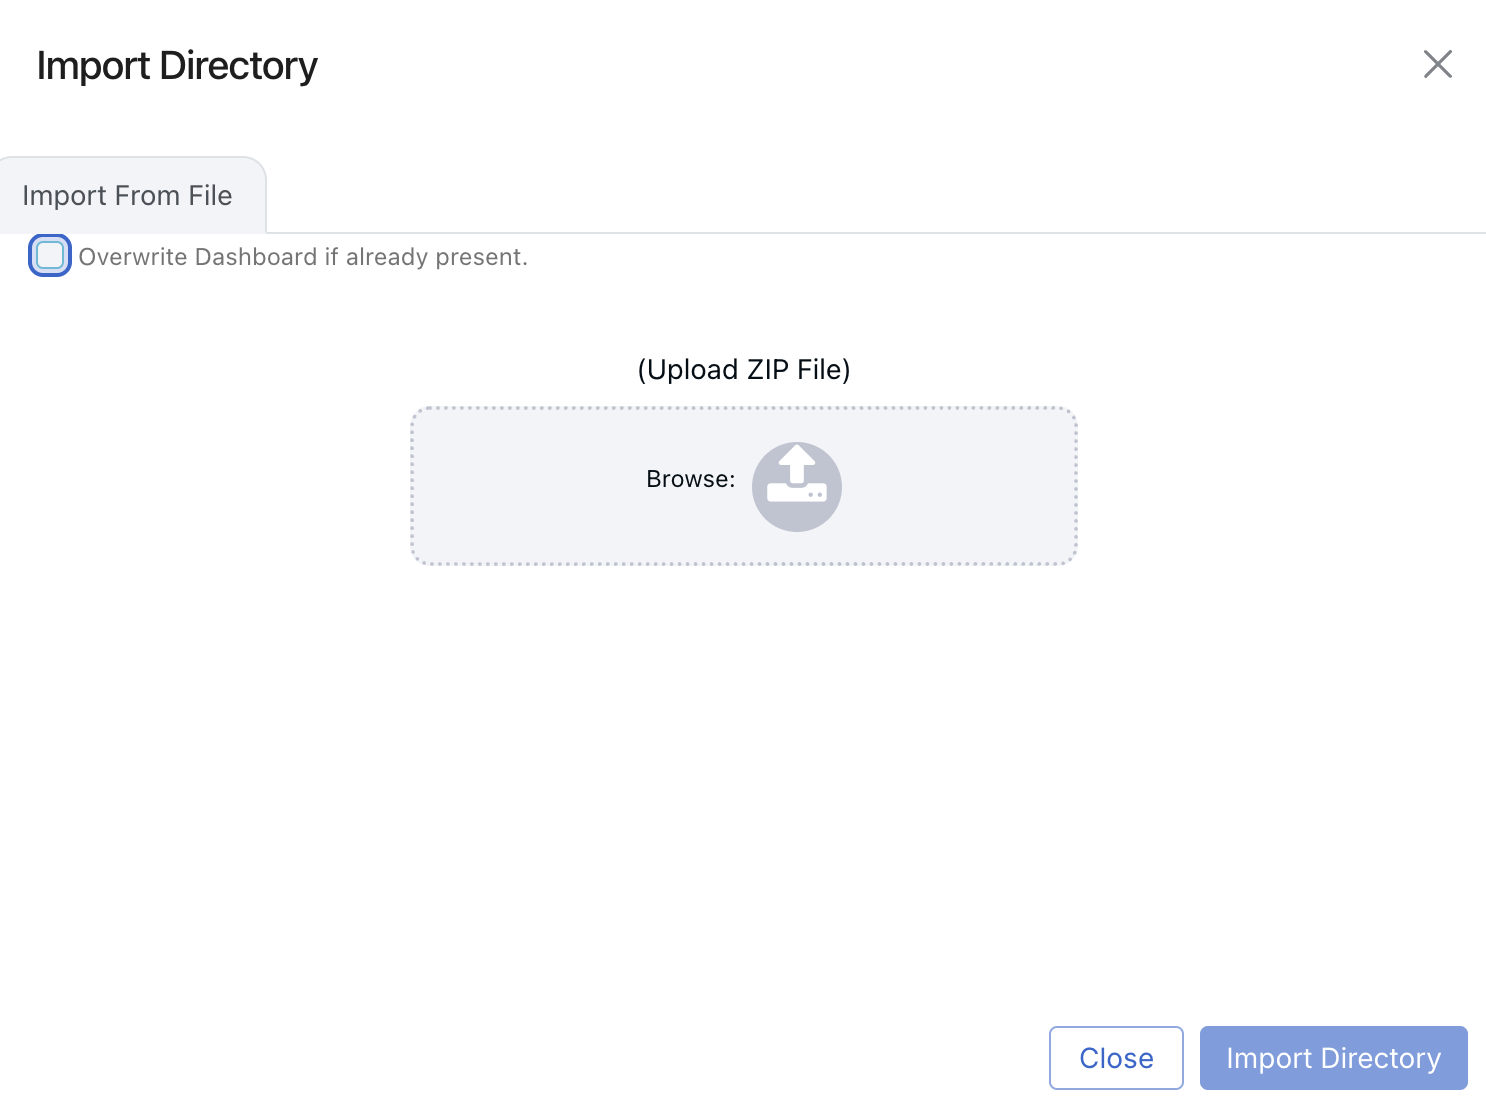
The dashboard is imported and added to the Dashboards page.
Creating a Dashboard
To create a dashboard:
In the xObserve UI, go to the user icon in the top right corner.
Select Dashplots Studio. The dashboard page appears on the screen.
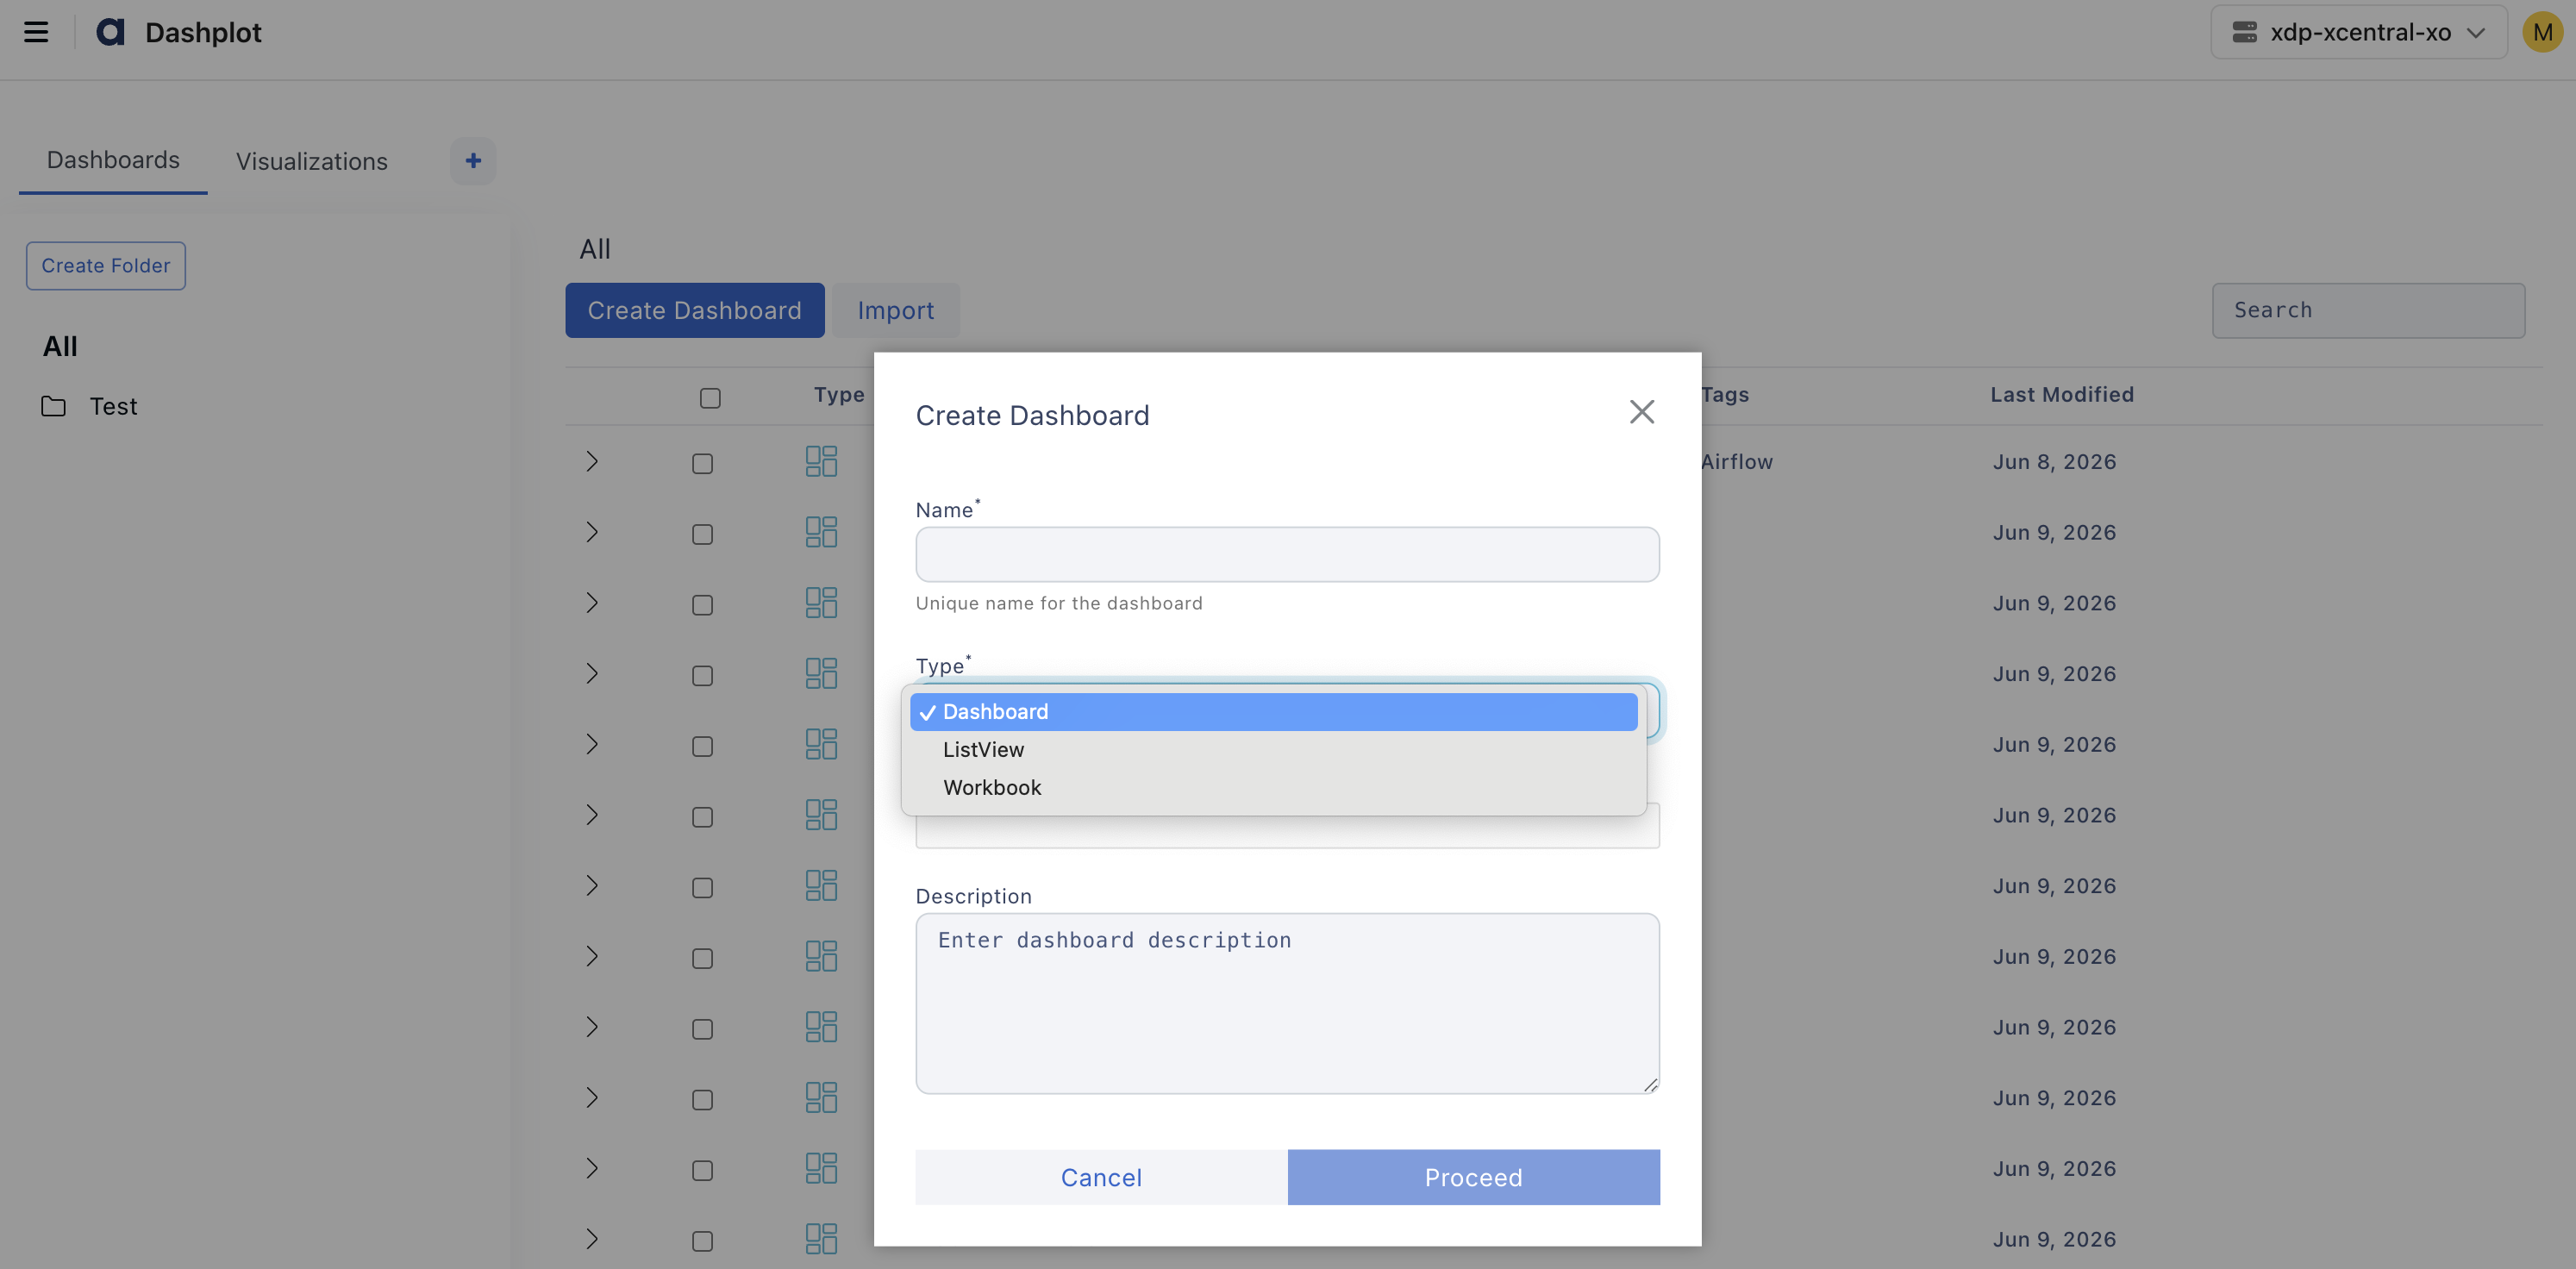
In the Dashboards tab, click Create Dashboard. The Create Dashboard window appears.
Provide the following details:
Name – Name of the dashboard.
Type – Select one of the following:
Dashboard – A collection of widgets and visualizations.
List View – A table-based view for displaying data.
Workbook – A collection of related dashboards.
Tags – Optional tags for categorization. You can add multiple tags.
Description – Brief description of the dashboard.
Click Create.
A new dashboard is created and opened for editing.
Adding Visualizations to a Dashboard
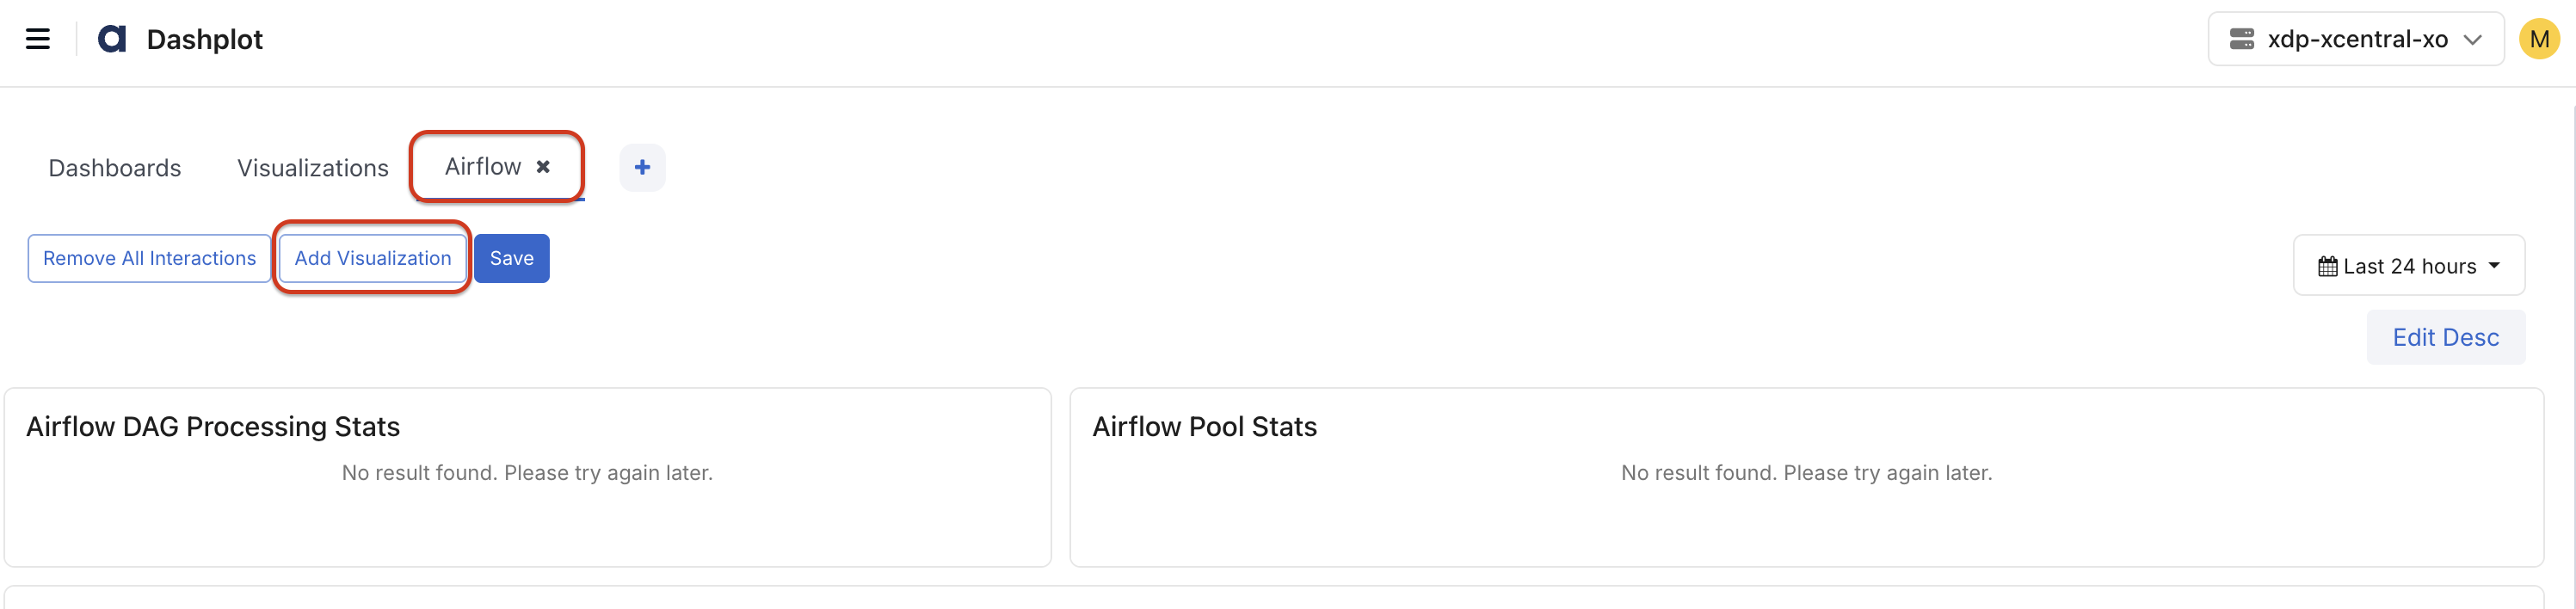
After creating a dashboard, it opens in a new tab.
In the dashboard tab, click Add Visualization.
Select one or more visualizations from the visualization library.
Click Select.
Click Save.
The selected visualizations are added to the dashboard.
Dashboard Operations
Within a dashboard, you can:
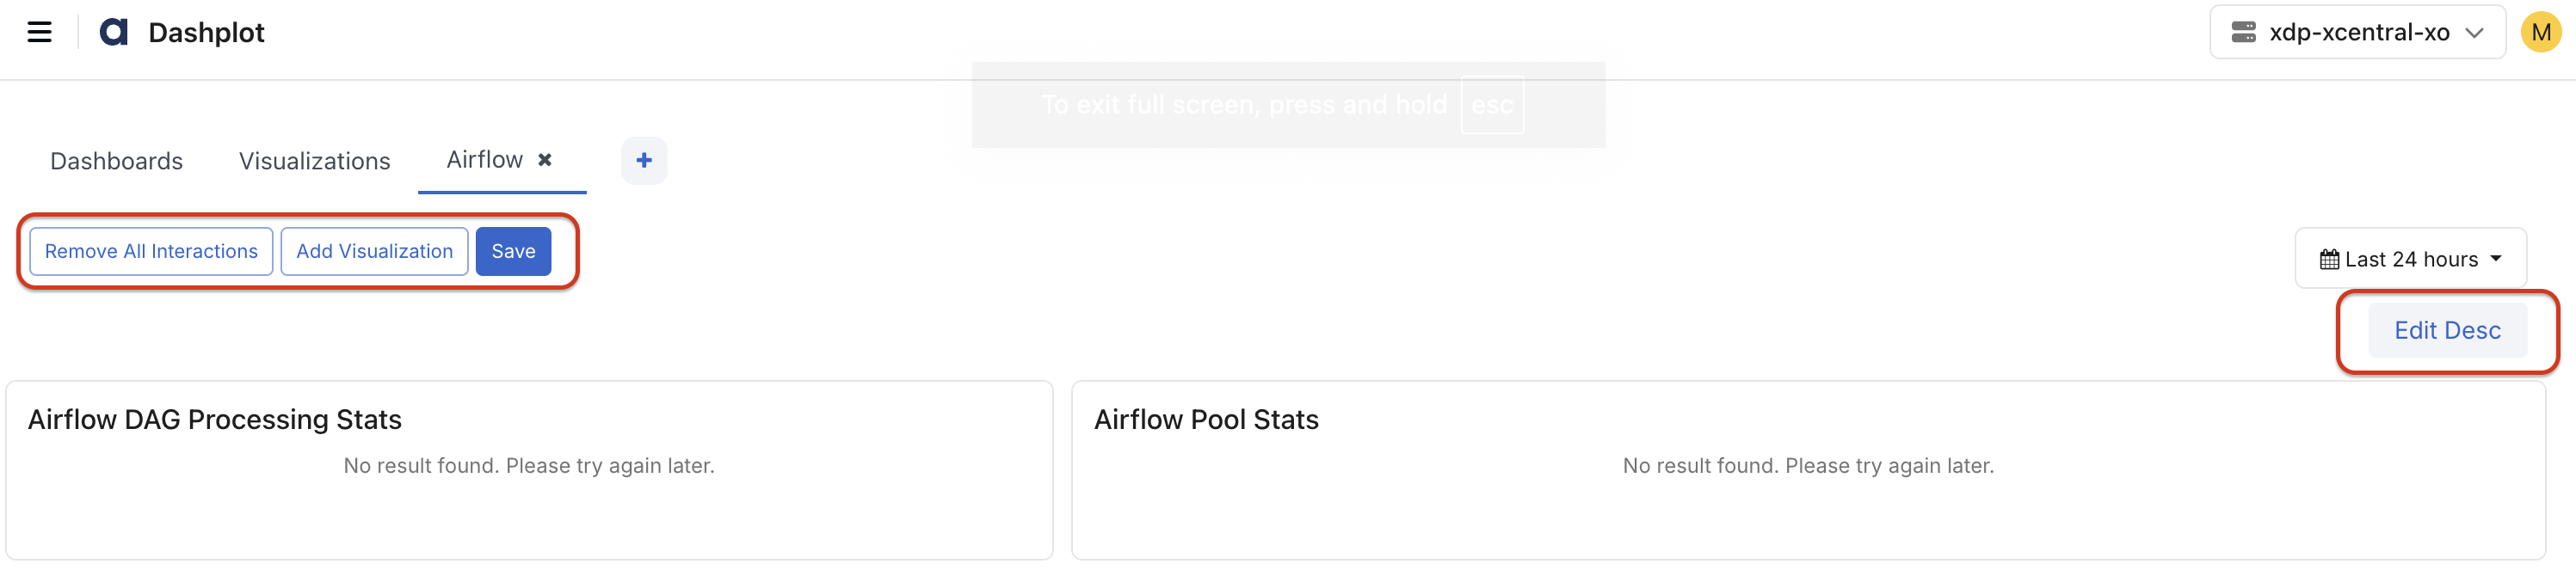
Edit Description: Click Edit Desc to modify the dashboard description.
Dashboard Time Filter: Use the time selector in the upper-right corner to control the dashboard time range. Examples include Last 15 minutes, Last 1 hour, Last 24 hours, Last 7 days, or Custom Range.
Remove Interactions: Click Remove All Interactions to clear all configured chart drilldowns and interactions.
Save Dashboard: Click Save to persist dashboard changes.
Dashboard Chart Options
On a dashboard, hover over any chart to view the following options:
Tip: Displays the chart description.
Show Anomaly Detection: Highlights points that deviate from the normal pattern.
Refresh: Refreshes the chart.
Maximize: Expands the chart to full-screen view.
Download: Downloads the chart in .csv or .xlsx format.
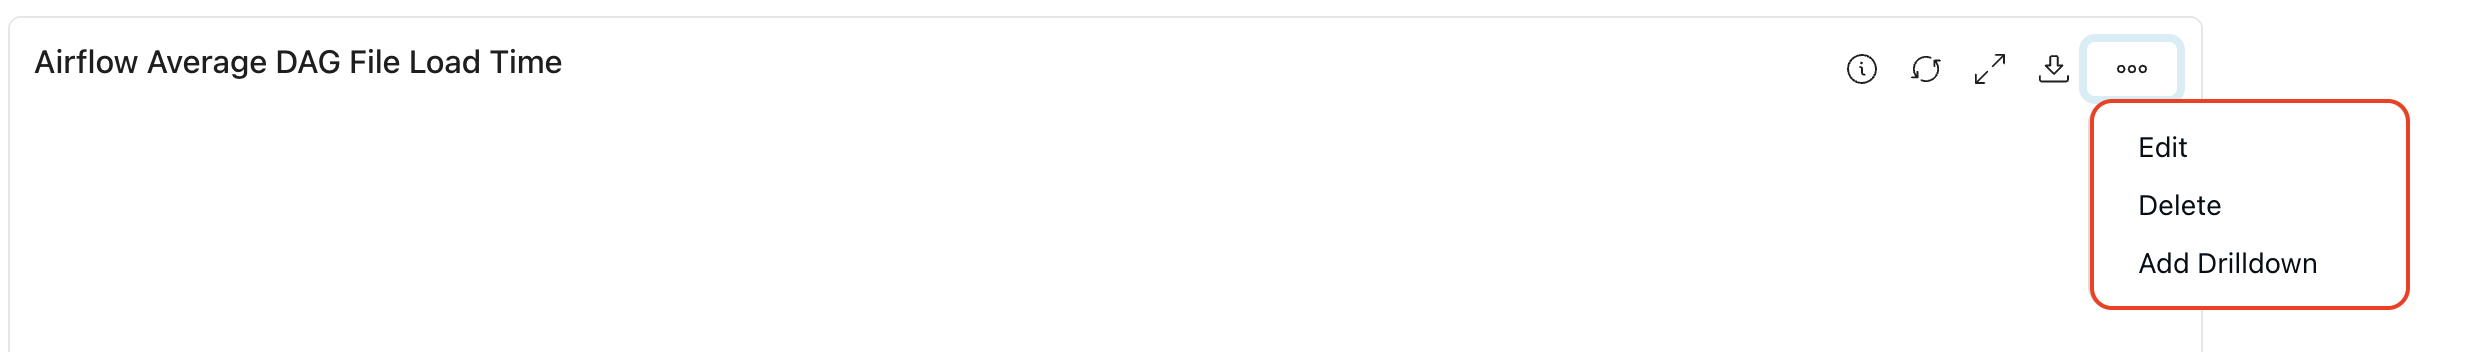
Select the More options (⋮) menu to access:
Edit: Update the query, visualization type, and other variables such as date or step interval.
Delete: Delete the dashboard.
Three Dots (...): Select Add Drilldowns to create an interaction with another chart. For details, see the section Configure Redirection below.
Configure Redirection
On the Dashplots page, in the Dashboards tab, hover over any chart.
Select the More options (⋮) menu and select Add Drilldowns. The drilldown pane opens.
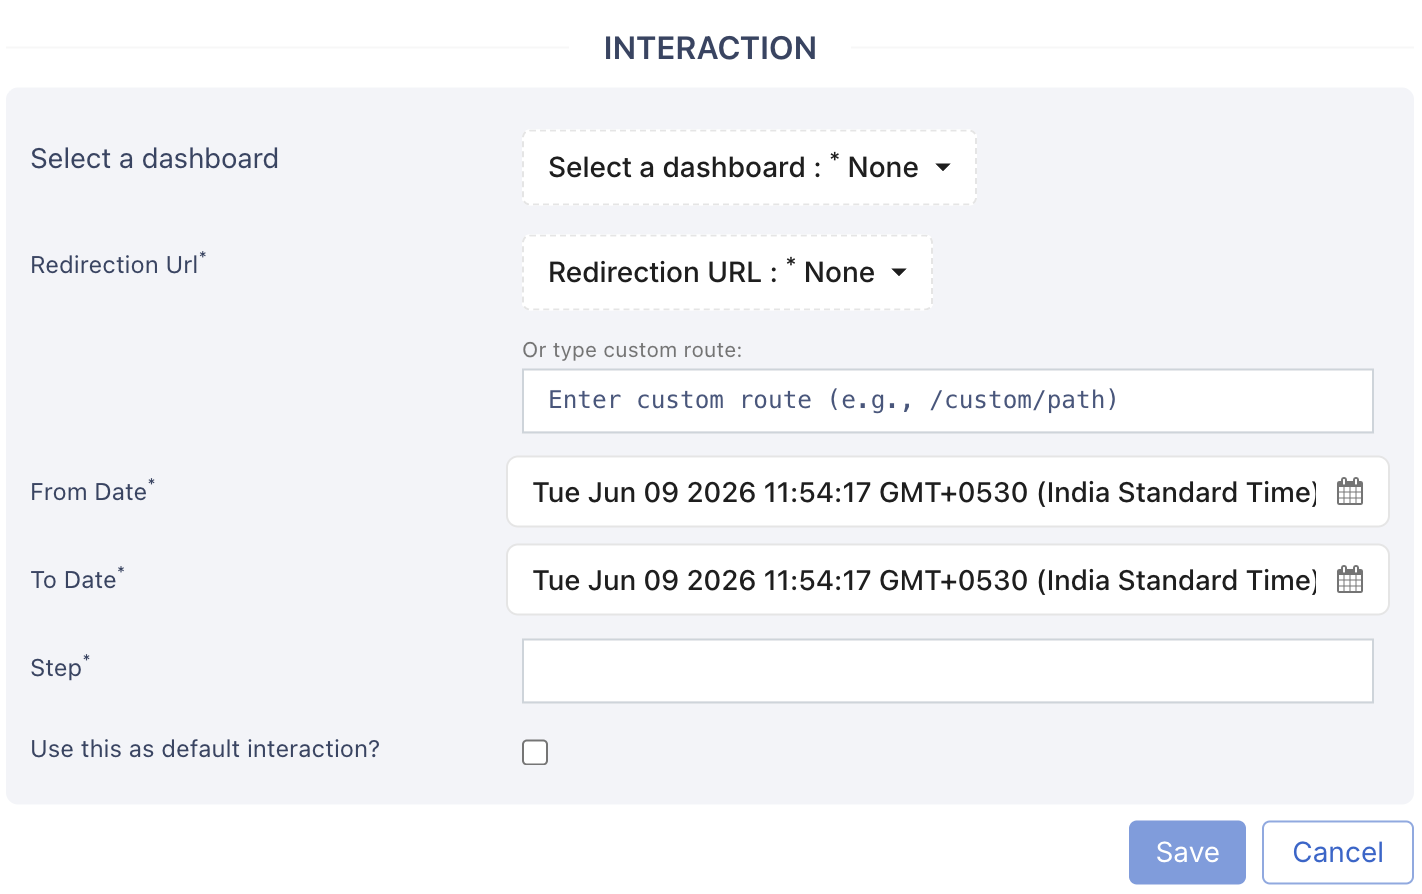
In the Drilldowns pane:
Select a dashboard: Choose any custom predefined or user-created dashboard (Dashplots) to link to.
Redirection URL: Select a predefined dashboard from the left navigation bar.
Or, Custom URL: Enter a custom path for redirection.
From Date / To Date: Define the date range for the linked dashboard.
Step: Specify how often the charts should refresh (for example, 30m, 1h).
Set as default: Select the checkbox to use this as the default interaction.