xObserve provides centralized visibility into the health, resource utilization, workload activity, and operational status of your xCompute clusters.
Use the Cluster Dashboard to monitor cluster performance, track resource consumption, analyze workload trends, and identify potential issues affecting cluster operations.
Navigation Steps
In the xObserve UI, select a cluster from the cluster drop-down list in the upper-right corner.
The selected cluster's overview page opens automatically.
Alternatively, navigate to Dashboard from the left navigation pane.
The Cluster Overview Dashboard displays cluster health, resource utilization, workload activity, namespace usage, and node-level metrics.
Time Period
Use the Time Period selector in the upper-left corner of the dashboard to filter metrics and charts for a specific monitoring window.
Step Interval
This controls how often the dashboard needs to refresh. By default, the dashboard refreshes every 30 seconds.
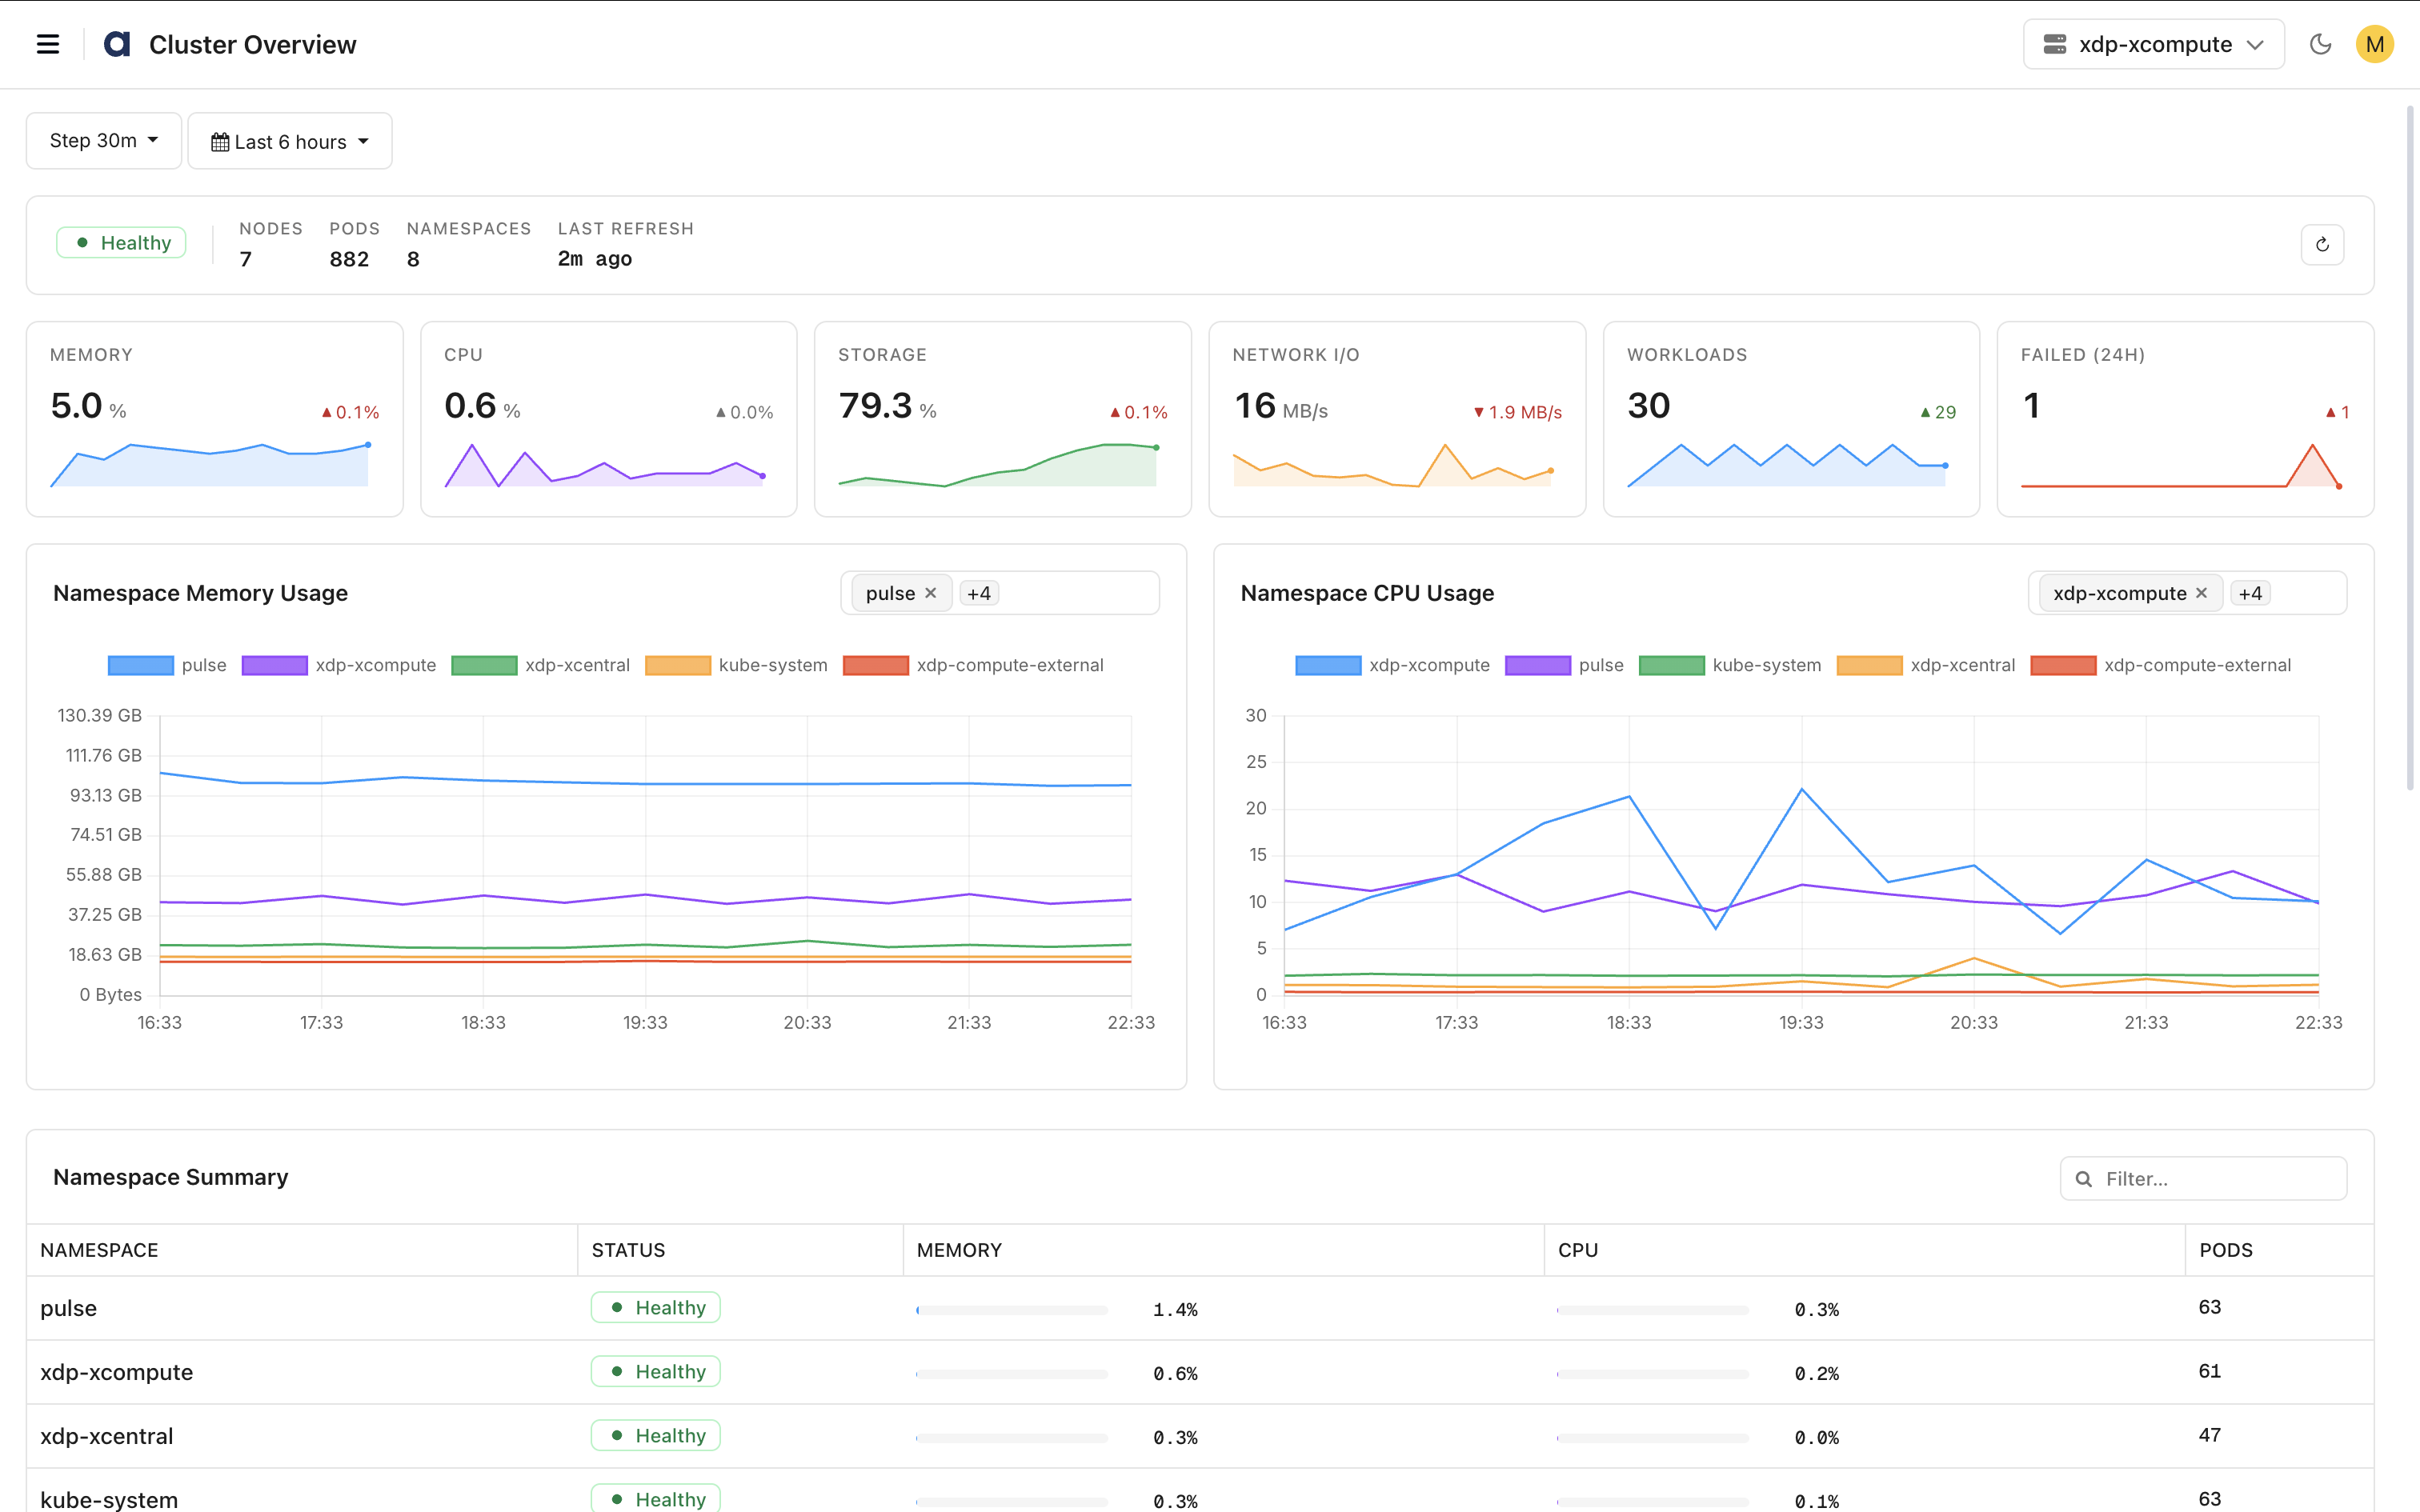
The Cluster Overview Dashboard provides a consolidated view of cluster health, resource utilization, workload execution, namespaces, and node activity.
Cluster Summary
Displays high-level cluster information.
Cluster Status – Overall health status of the cluster.
Nodes – Total number of cluster nodes.
Pods – Total number of running pods.
Namespaces – Total number of namespaces in the cluster.
Last Refresh – Time elapsed since the dashboard was last refreshed.
Resource Utilization
Monitor overall cluster resource consumption.
Memory: Displays cluster-wide memory utilization and usage trends.
CPU: Displays cluster-wide CPU utilization and processing activity.
Storage: Displays storage utilization across the cluster.
Network I/O: Displays network throughput and traffic activity.
Workloads: Displays the total number of workloads running within the cluster.
Failed (24H): Displays the number of workloads that failed during the selected time period.
Namespace Resource Utilization
Monitor resource usage across namespaces.
Namespace Memory Usage
Displays memory consumption trends for namespaces over time.
Use this chart to:
Compare memory usage across namespaces.
Identify memory-intensive workloads.
Detect abnormal spikes in resource consumption.
Namespace CPU Usage
Displays CPU utilization trends for namespaces over time.
Use this chart to:
Compare CPU consumption across namespaces.
Identify heavily utilized namespaces.
Monitor workload activity and processing patterns.
Namespace Summary
Provides a summary of resource utilization and health for each namespace.
The table displays:
Namespace – Namespace name.
Status – Current health status.
Memory – Memory utilization percentage.
CPU – CPU utilization percentage.
Pods – Number of pods running in the namespace.
Use the search field to locate specific namespaces.
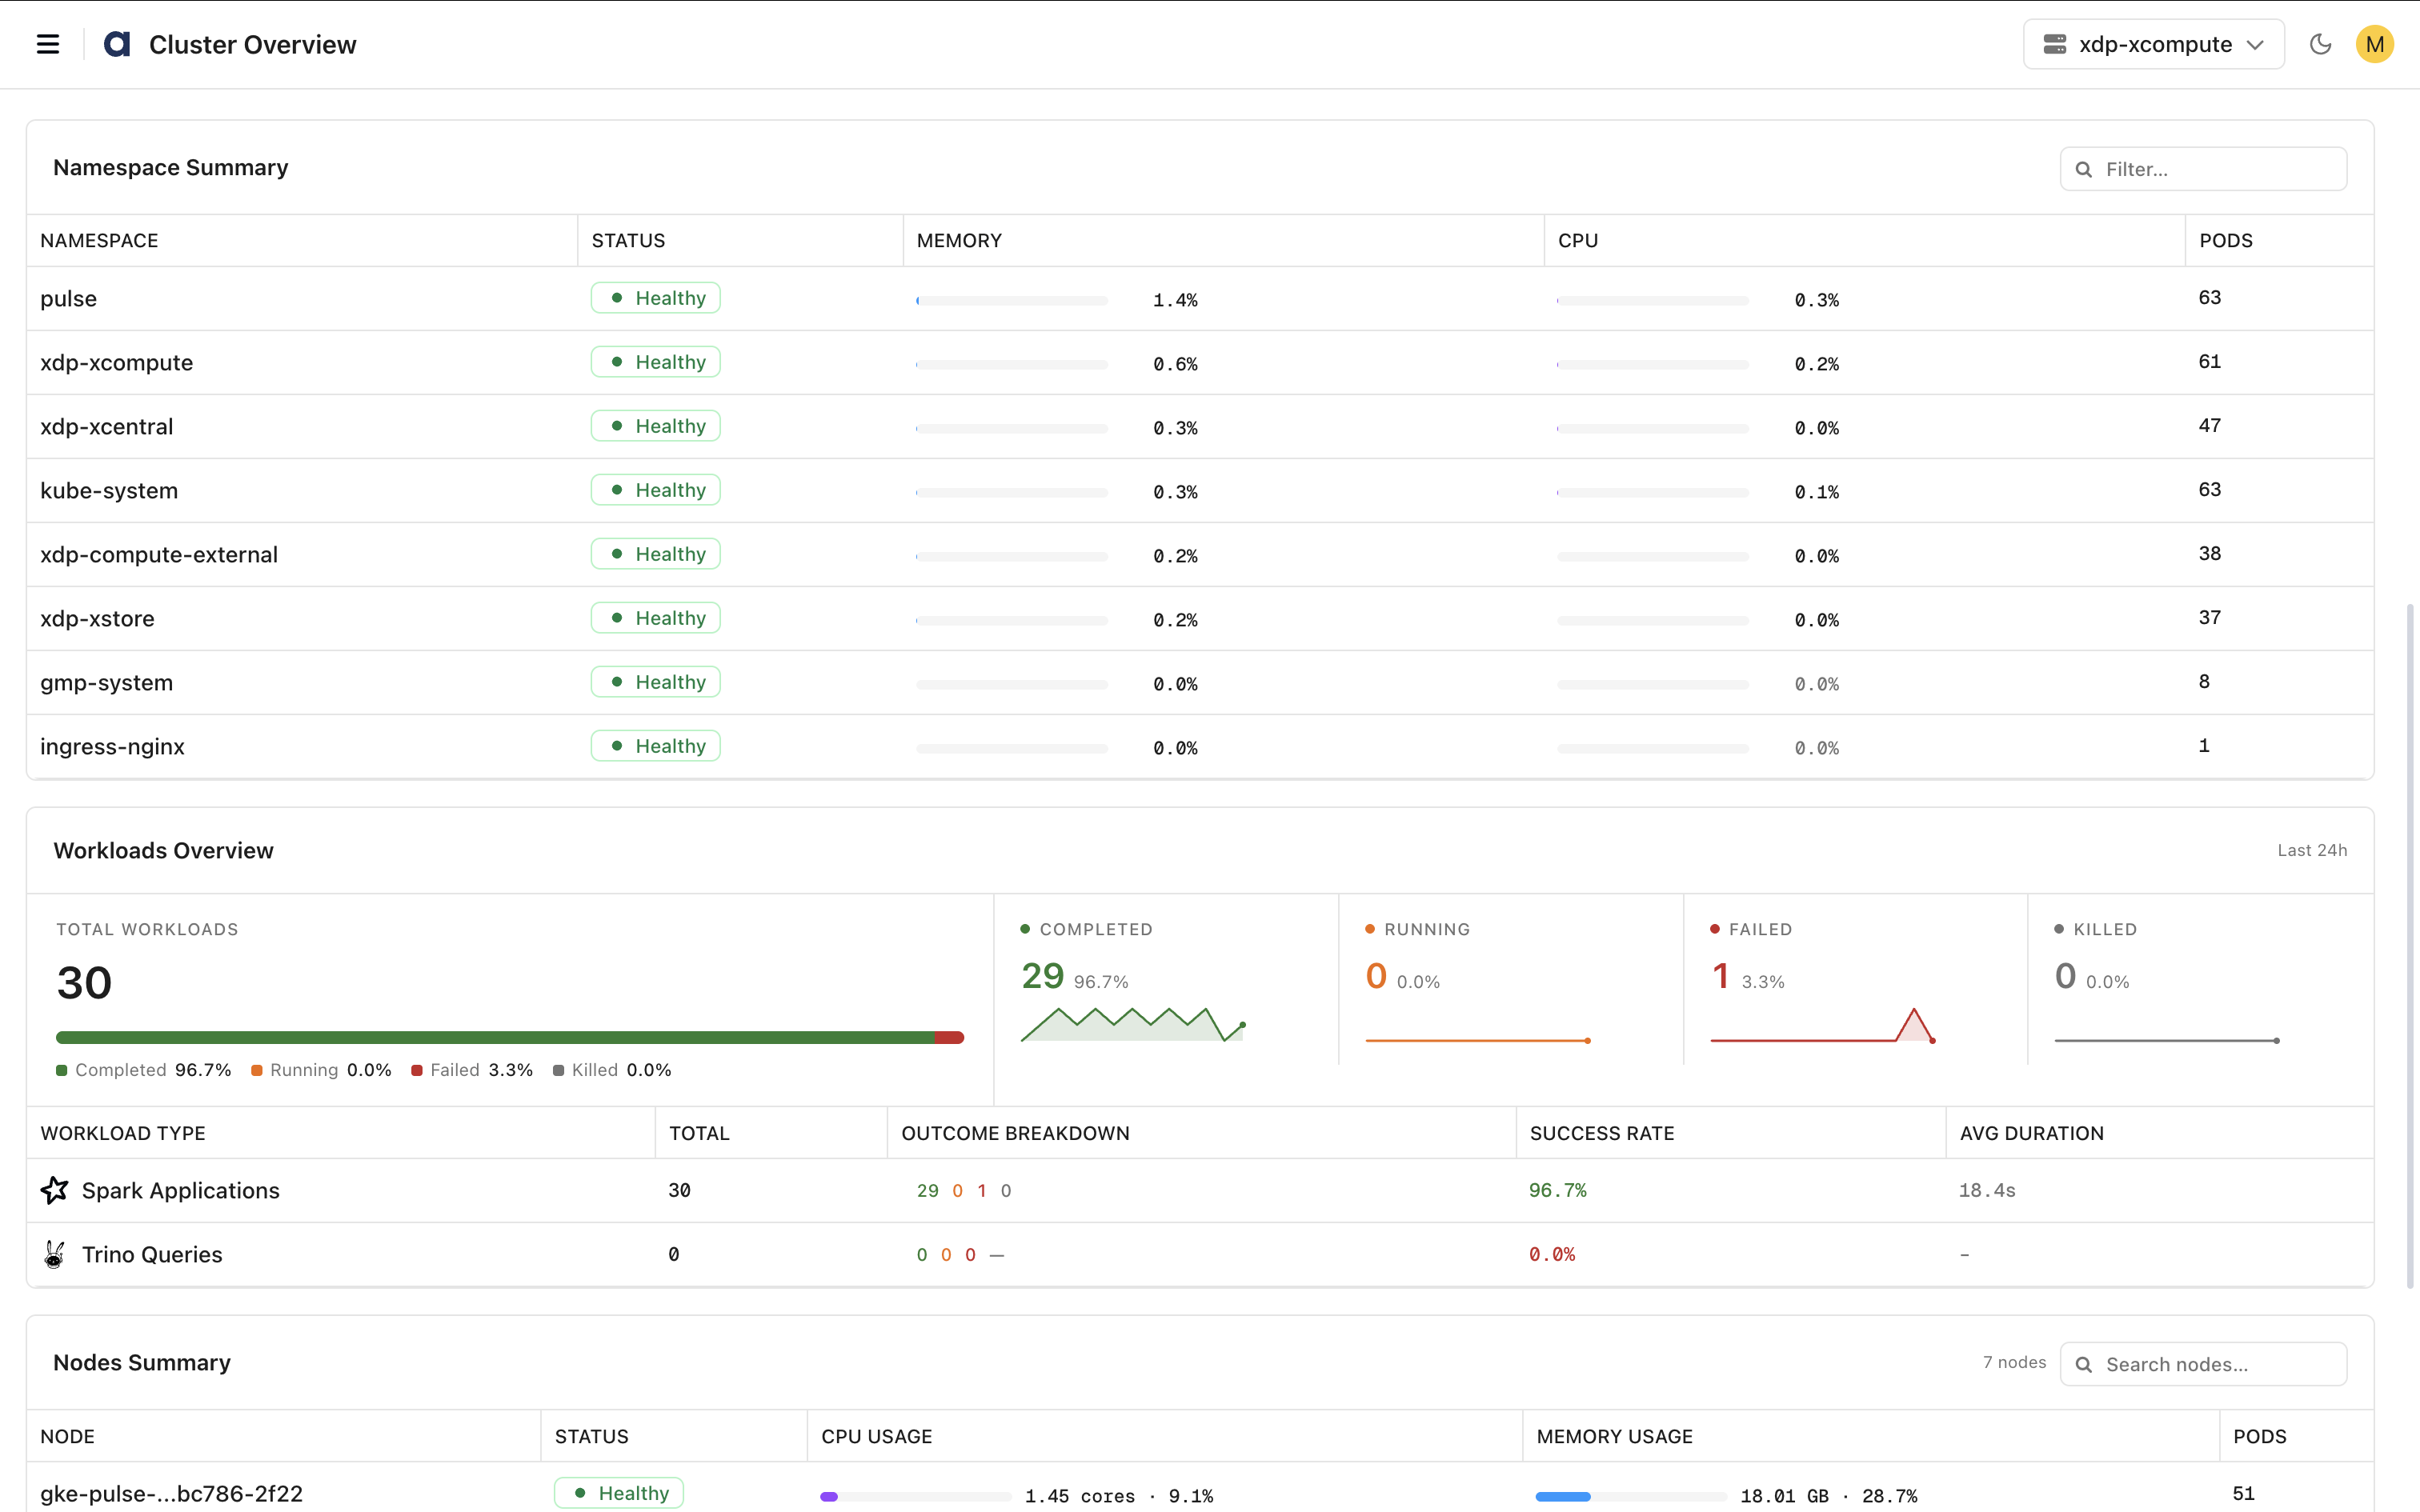
Workloads Overview
Provides visibility into workload execution and operational health.
Workload Summary
Displays:
Total Workloads – Total workloads executed during the selected time period.
Completed – Successfully completed workloads.
Running – Currently active workloads.
Failed – Failed workloads.
Killed – Terminated workloads.
Workload Type Breakdown
Displays workload statistics by workload type.
For each workload type, the dashboard shows:
Workload Type – Type of workload (for example, Spark Applications or Trino Queries).
Total – Total number of workloads executed.
Outcome Breakdown – Count of completed, running, failed, and killed workloads.
Success Rate – Percentage of successful workload executions.
Average Duration – Average workload execution time.
Use this information to identify workload trends, execution reliability, and performance patterns.
Nodes Summary
Provides node-level health and resource utilization details.
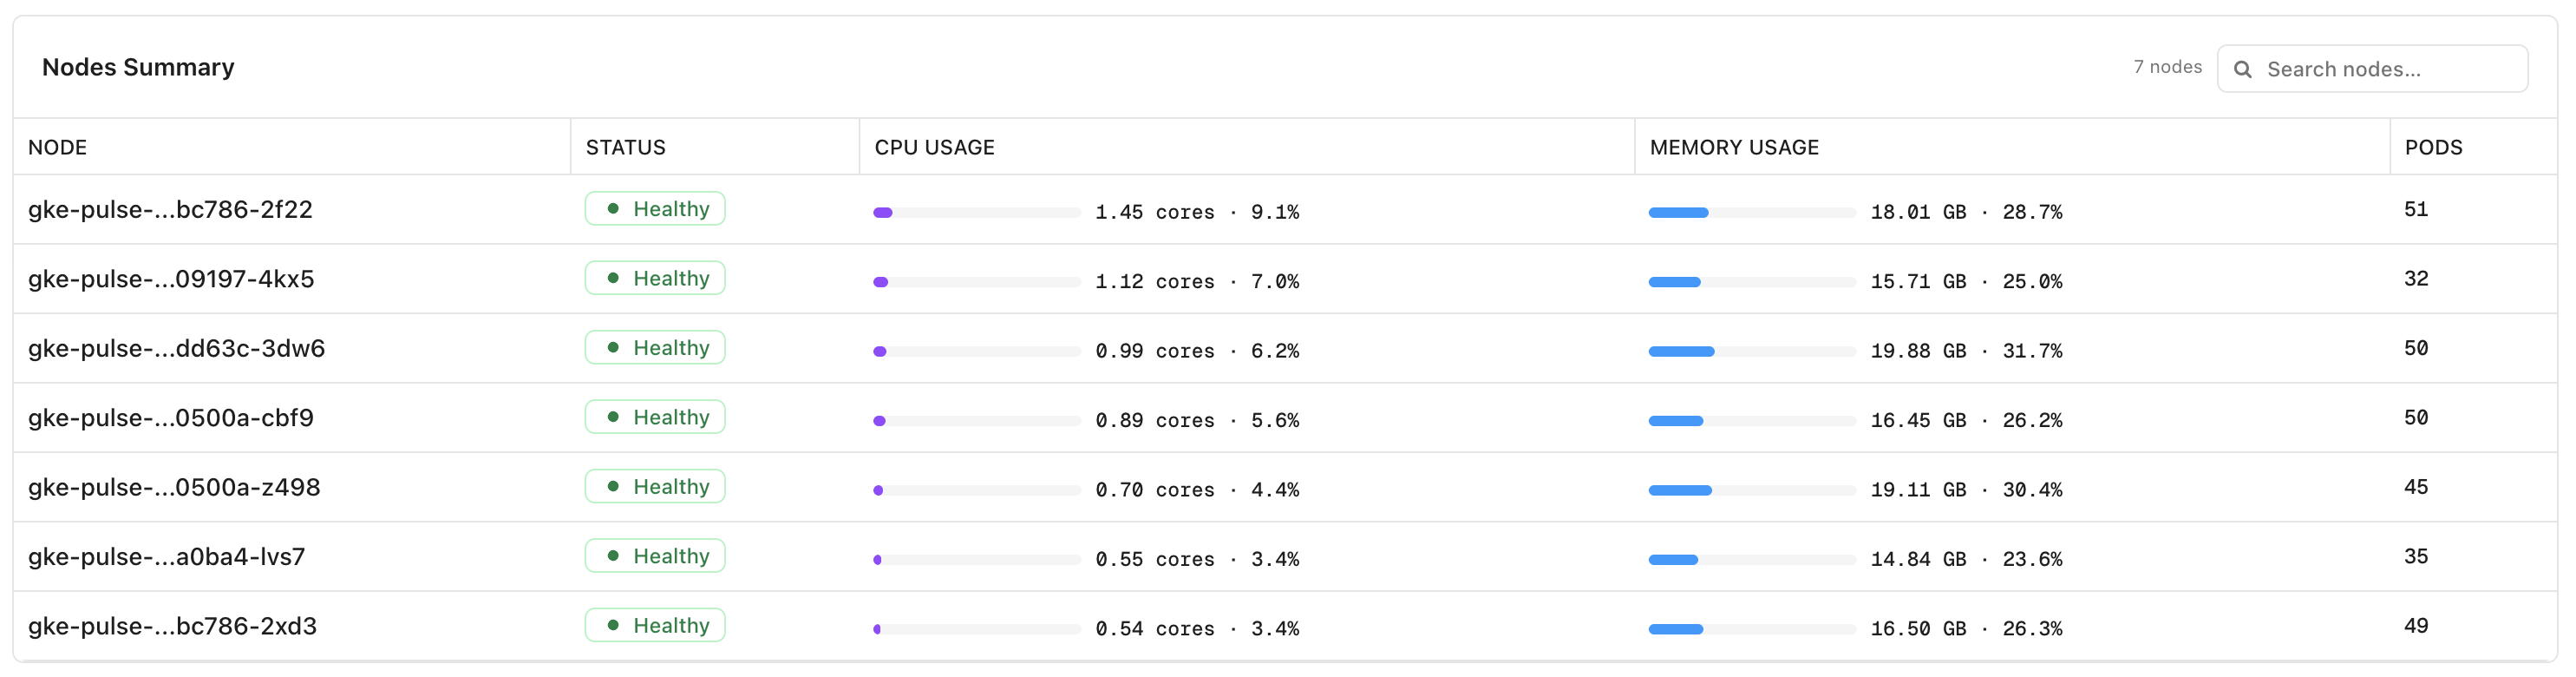
The table displays:
Node – Node name.
Status – Current node health.
CPU Usage – CPU utilization by the node.
Memory Usage – Memory consumption by the node.
Pods – Number of pods running on the node.
Use the search field to locate specific nodes.
Node metrics help administrators:
Monitor node health and availability.
Identify resource-intensive nodes.
Detect workload imbalances across the cluster.
Troubleshoot capacity and performance issues.