xObserve provides centralized log monitoring and analysis across applications, platform services, containers, and cluster infrastructure components.
Use logs to investigate failures, troubleshoot performance issues, analyze workload execution, and perform root cause analysis from a single interface.
With xObserve, you can:
Search logs across applications, services, containers, and hosts.
Filter logs by service, host, severity, and workload identifiers.
Visualize log activity to identify trends, spikes, and anomalies.
Investigate detailed log messages and related events.
Correlate logs with workloads and infrastructure resources.
Export log data for reporting and offline analysis.
Navigation Steps
In the xObserve UI, navigate to Logs from the left navigation pane.
On the Logs page, select a time range to analyze log data. Available options include:
Today
Last 12 Hours
Last 3 Months
Custom Time Range
Click Apply.
Features and Functionality
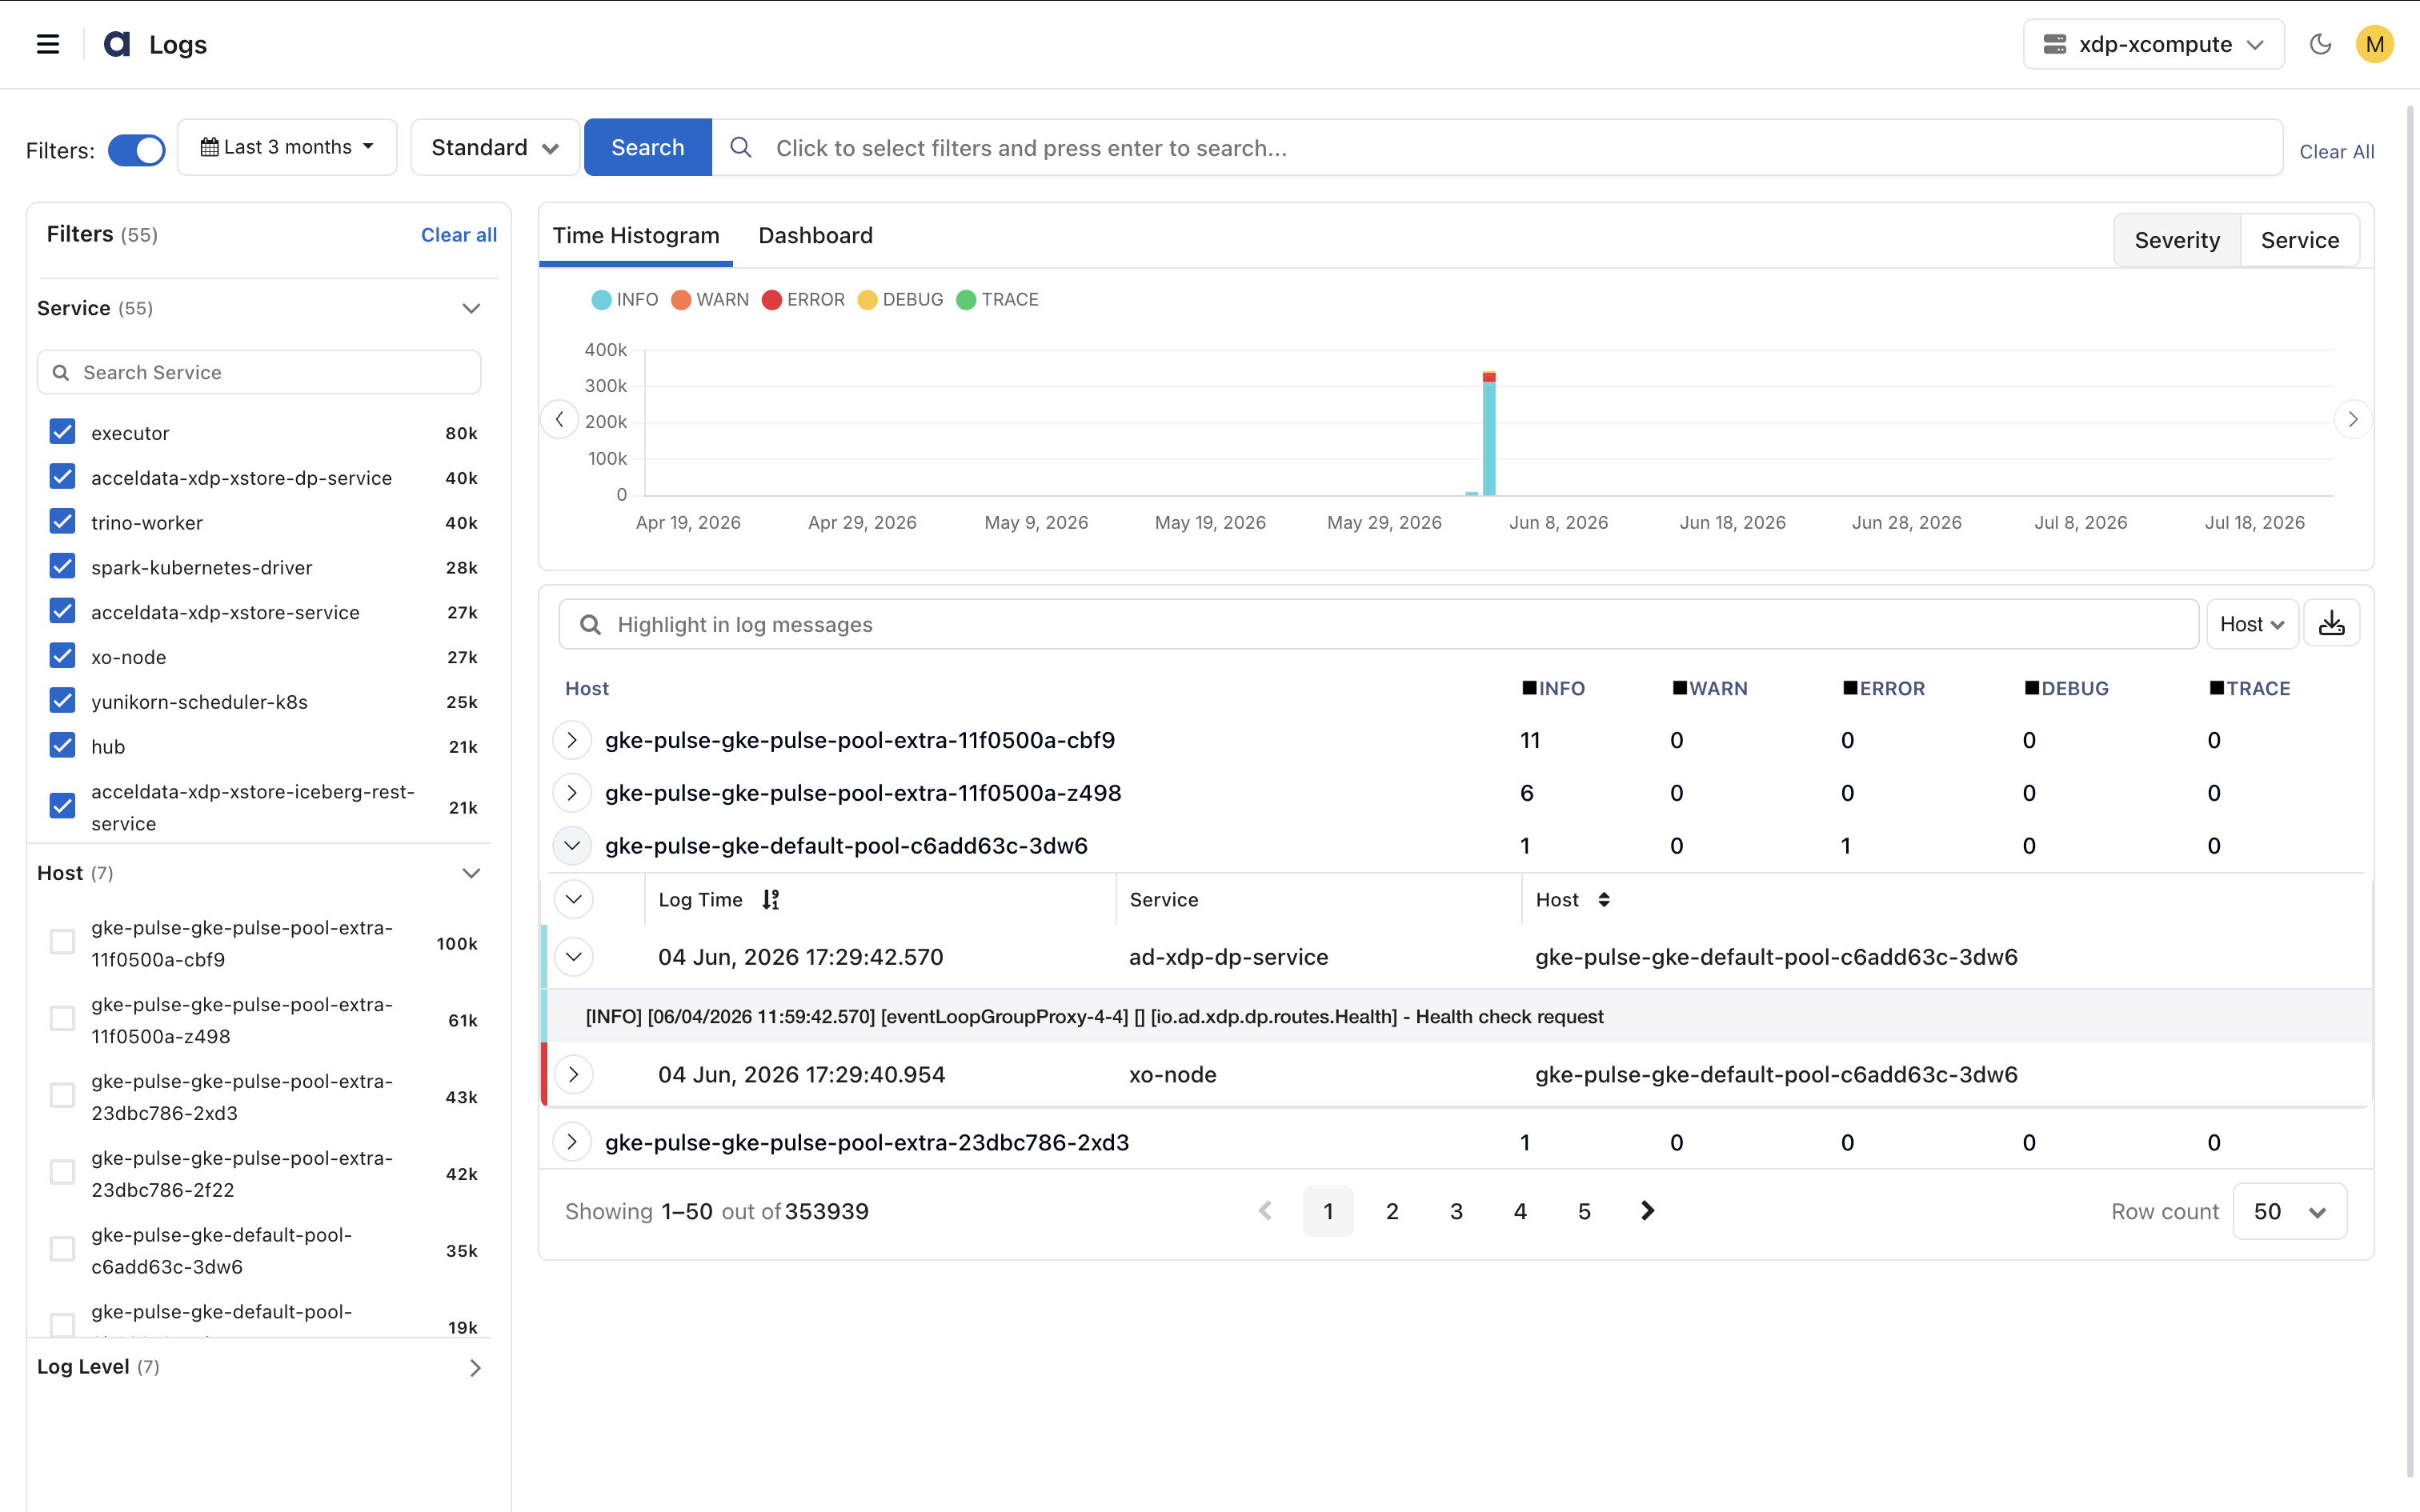
Search Logs
Search logs across applications, services, containers, and infrastructure components deployed in your environment.
The Logs page supports the following search methods:
Standard Search
Use built-in filters such as:
Service
Host
Log Level
Message
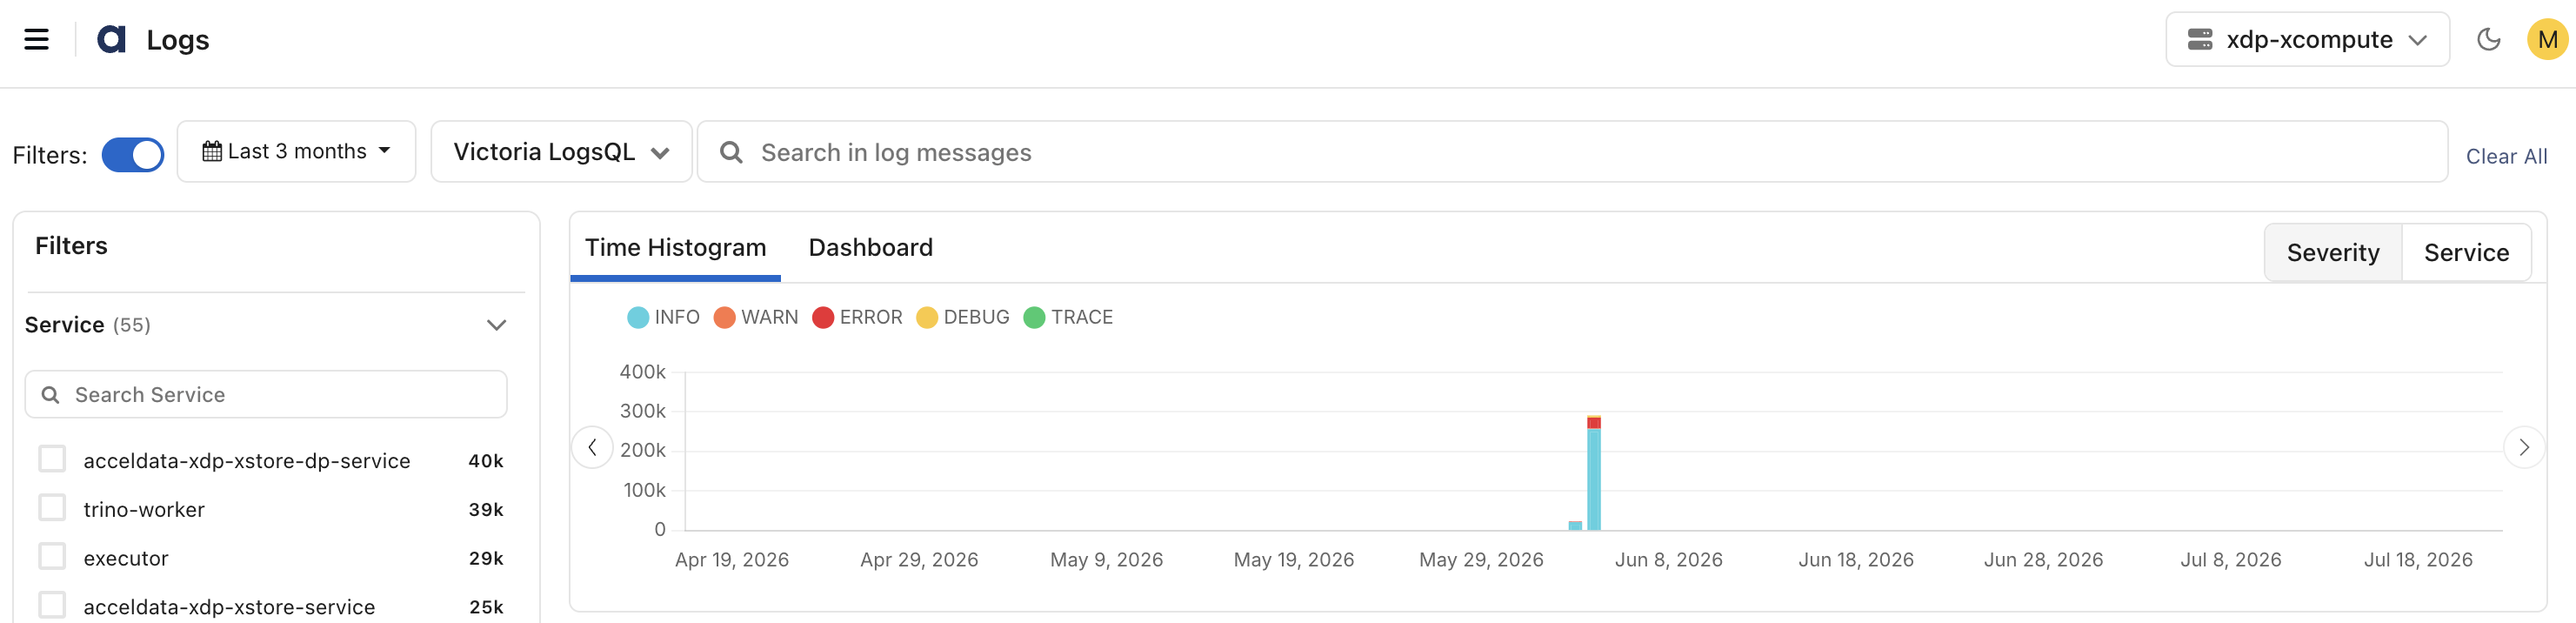
Victoria LogsQL Search
Use Victoria LogsQL to perform advanced log searches and analysis.
Enter a LogsQL query to perform advanced filtering and log analysis.
Use LogsQL when standard search filters are insufficient for your troubleshooting or investigation needs.
For information about creating LogsQL queries, see Victoria Logs Documentation.
Best Practices
Use exact values for accurate results.
Combine multiple parameters to narrow down results.
Apply filters to focus on specific services, hosts, or log levels.
Filter Logs
Refine log results using one or more filters.
Available filters include:
Service
Host
Log Level (Info, Warn, Error, Fatal)
You can apply multiple filters simultaneously to narrow down results.
Filtered results automatically update all visualizations and log details displayed on the page.
Visual Log Insights
xObserve provides interactive visualizations to help identify trends and analyze log activity.
Time Histograms
Display the number of log events generated over time.
You can visualize logs by:
Severity
Service
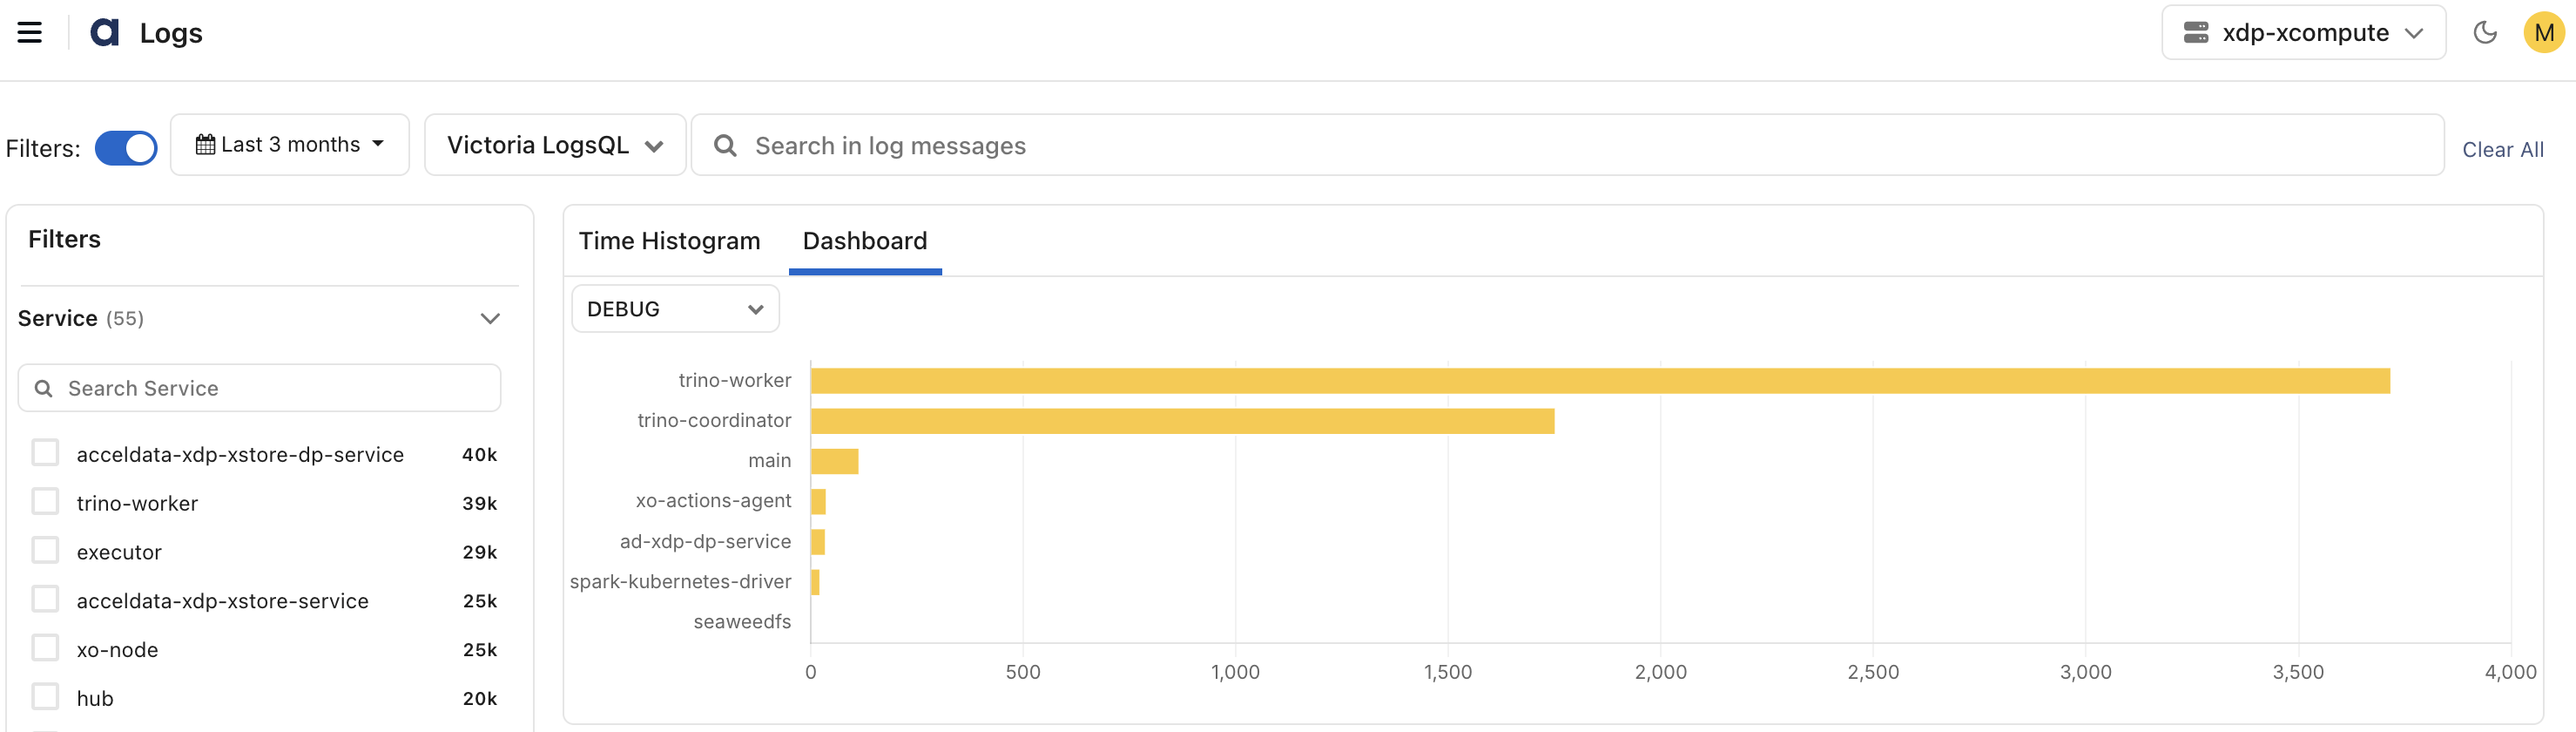
Dashboard View
Provides a summary of log counts grouped by severity levels across services.
You can group logs by:
Service
Host
Log Level
Use these visualizations to quickly identify spikes, recurring issues, and abnormal behavior across the cluster.
Visualizations update automatically as filters and search criteria change.
Detailed Log Messages
Review detailed log information for troubleshooting and investigation.
Message Details
The message details pane displays information such as:
Log Time (Timestamp)
Service
Hostname
Log Entry Details
The Messages pane displays detailed information about the selected log entry.
These details help correlate log events with applications, services, containers, and infrastructure resources, making troubleshooting and root cause analysis more efficient.
View in Context
View log entries that occurred before and after the selected event to understand the surrounding activity and sequence of events.
Copy Messages
Copy log messages for reporting, collaboration, or offline analysis.
Search Messages
Search within log messages to quickly locate specific events, errors, or patterns.
Detailed log views update automatically based on applied filters and search criteria.
Group and Export Logs
Organize and export logs for analysis and reporting.
Group Logs
Group log records by:
Trace
Log Level (Severity)
Host
Grouping related log events helps simplify analysis and troubleshooting.
Export Logs
Export filtered log results in:
xlsx
.logs
Exported files include all applied filters and search criteria, ensuring that only relevant log data is downloaded for analysis, reporting, or compliance purposes.
A maximum of 10,000 records can be exported in a single operation. Exporting all available records at once is not supported.
To export additional records, refine your search criteria and perform multiple export operations.
Job/Query-Specific Logs
Available only from the Spark Jobs listing page. Click the Logs icon next to the Status column to view logs for a specific job or query.