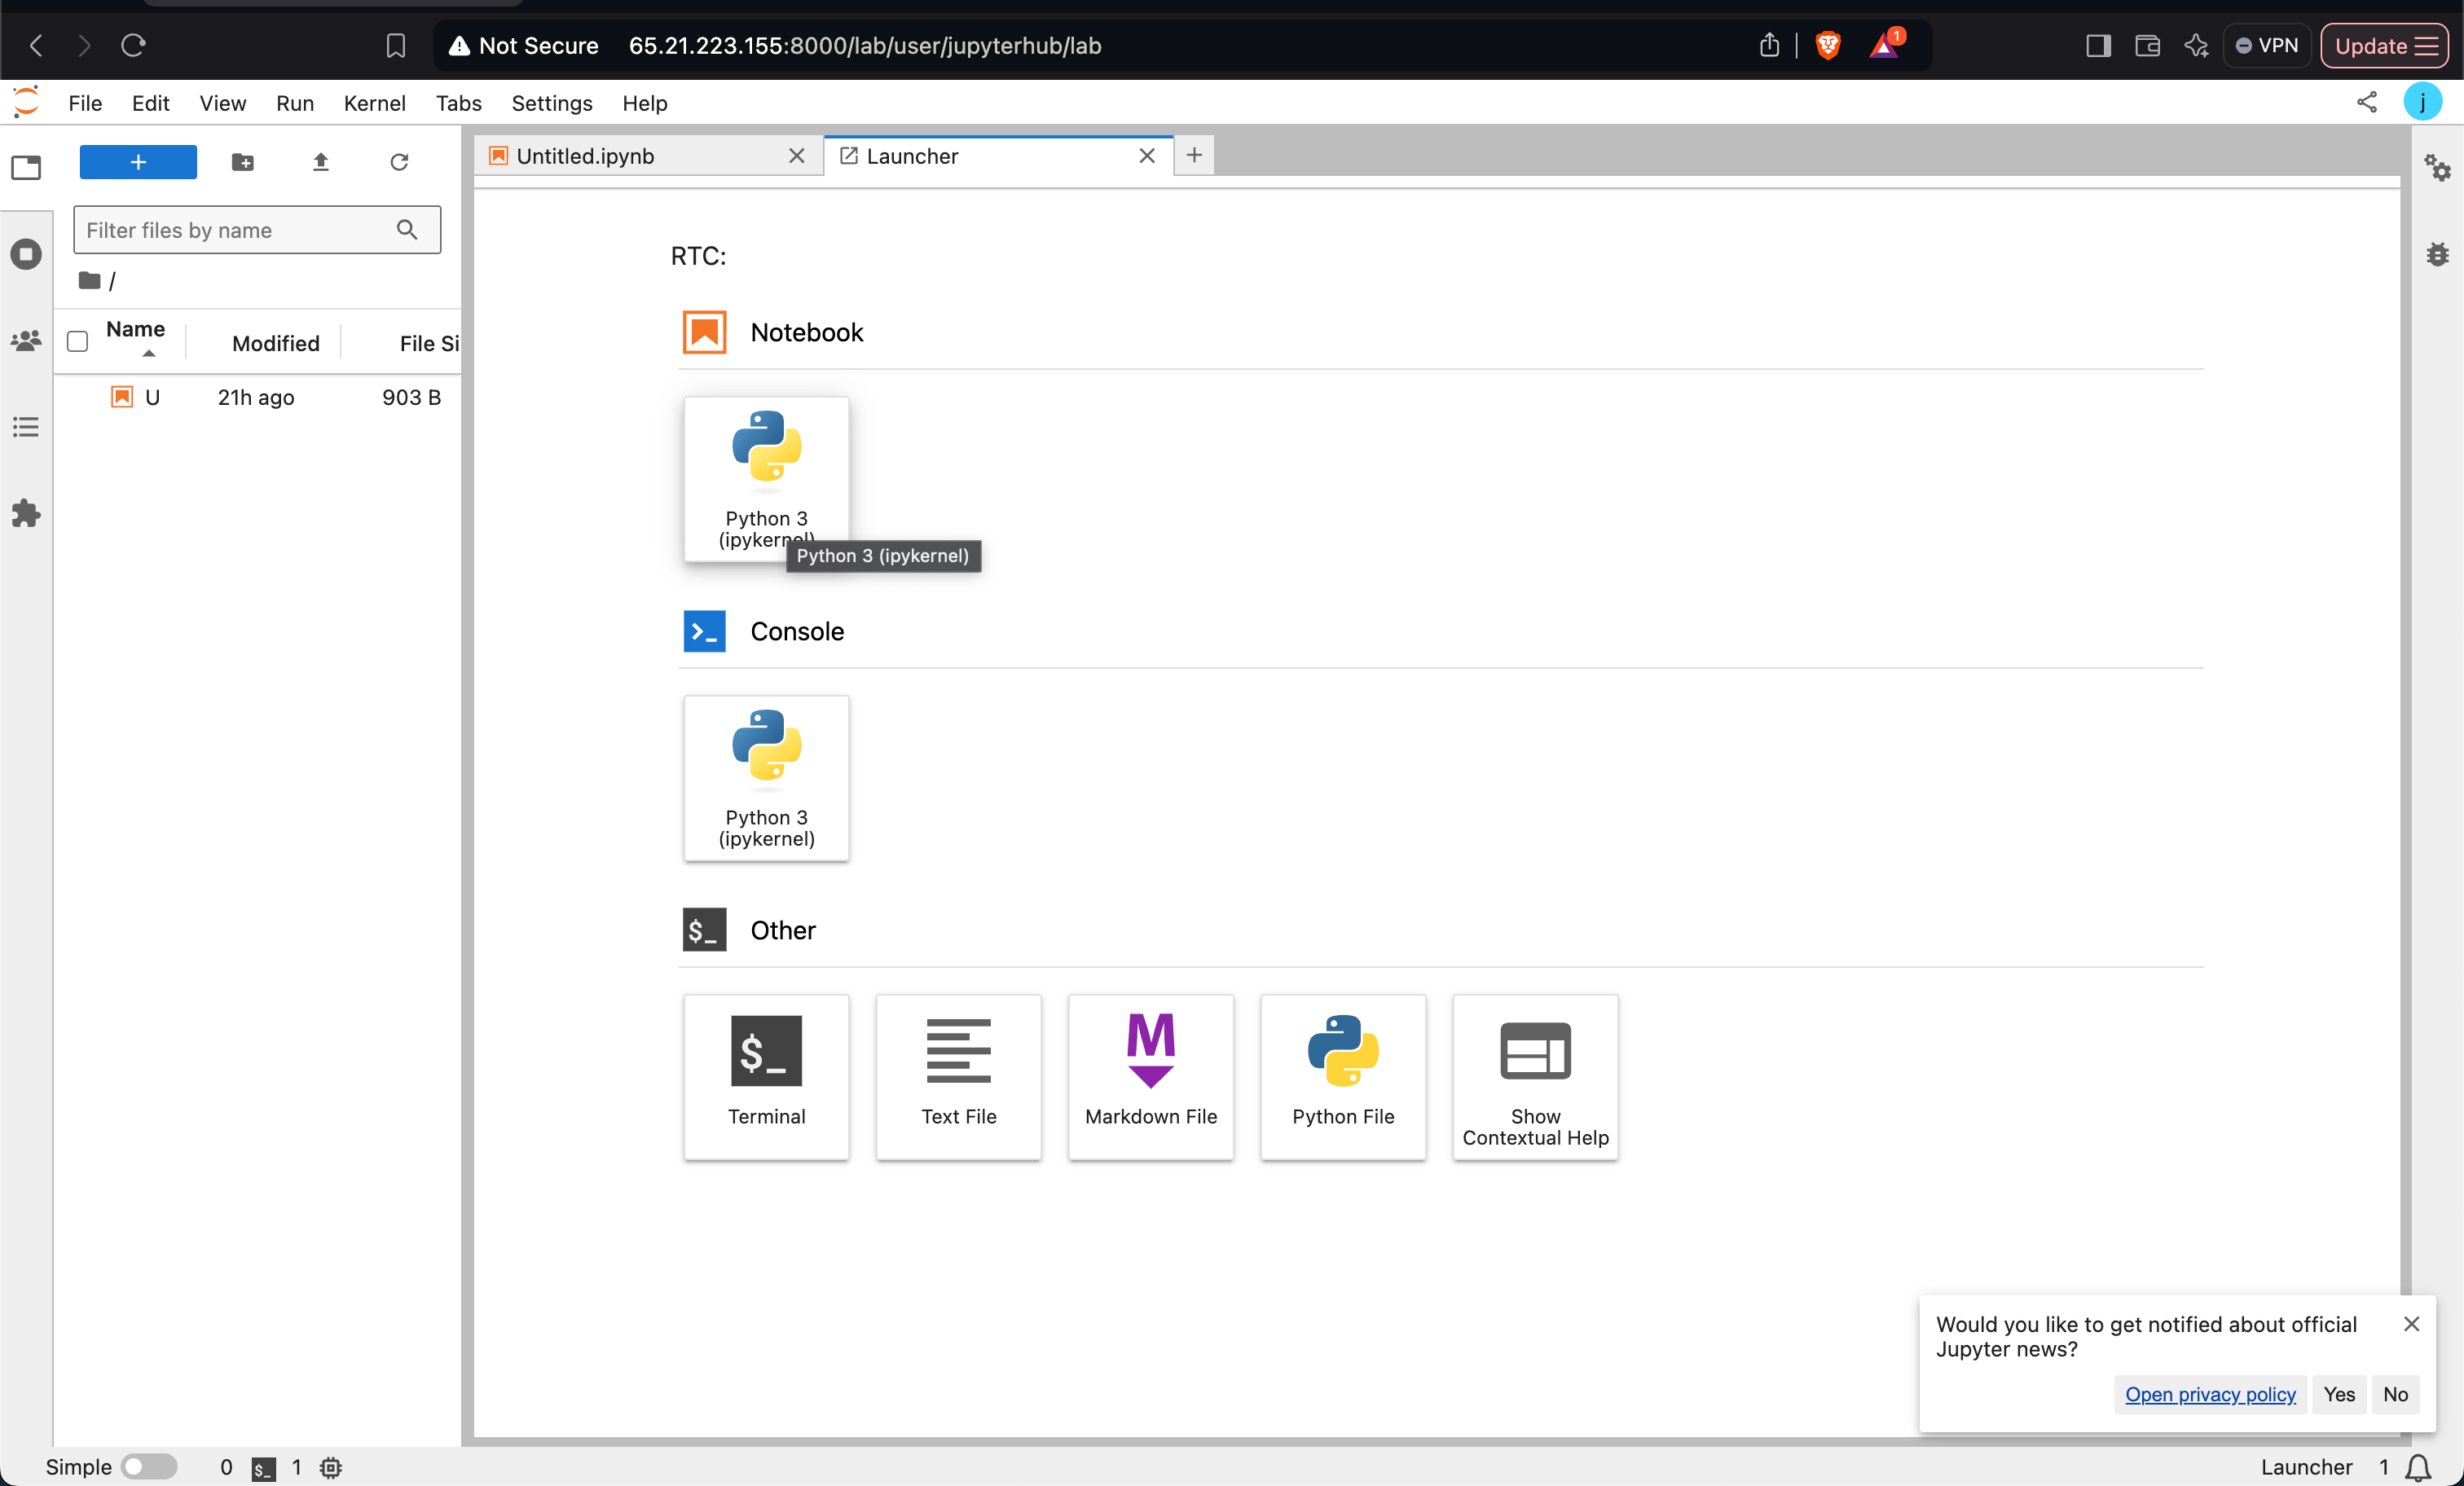
This page demonstrates how to use Jupyter notebooks with Spark, including Python 3 kernel options and related development tools.

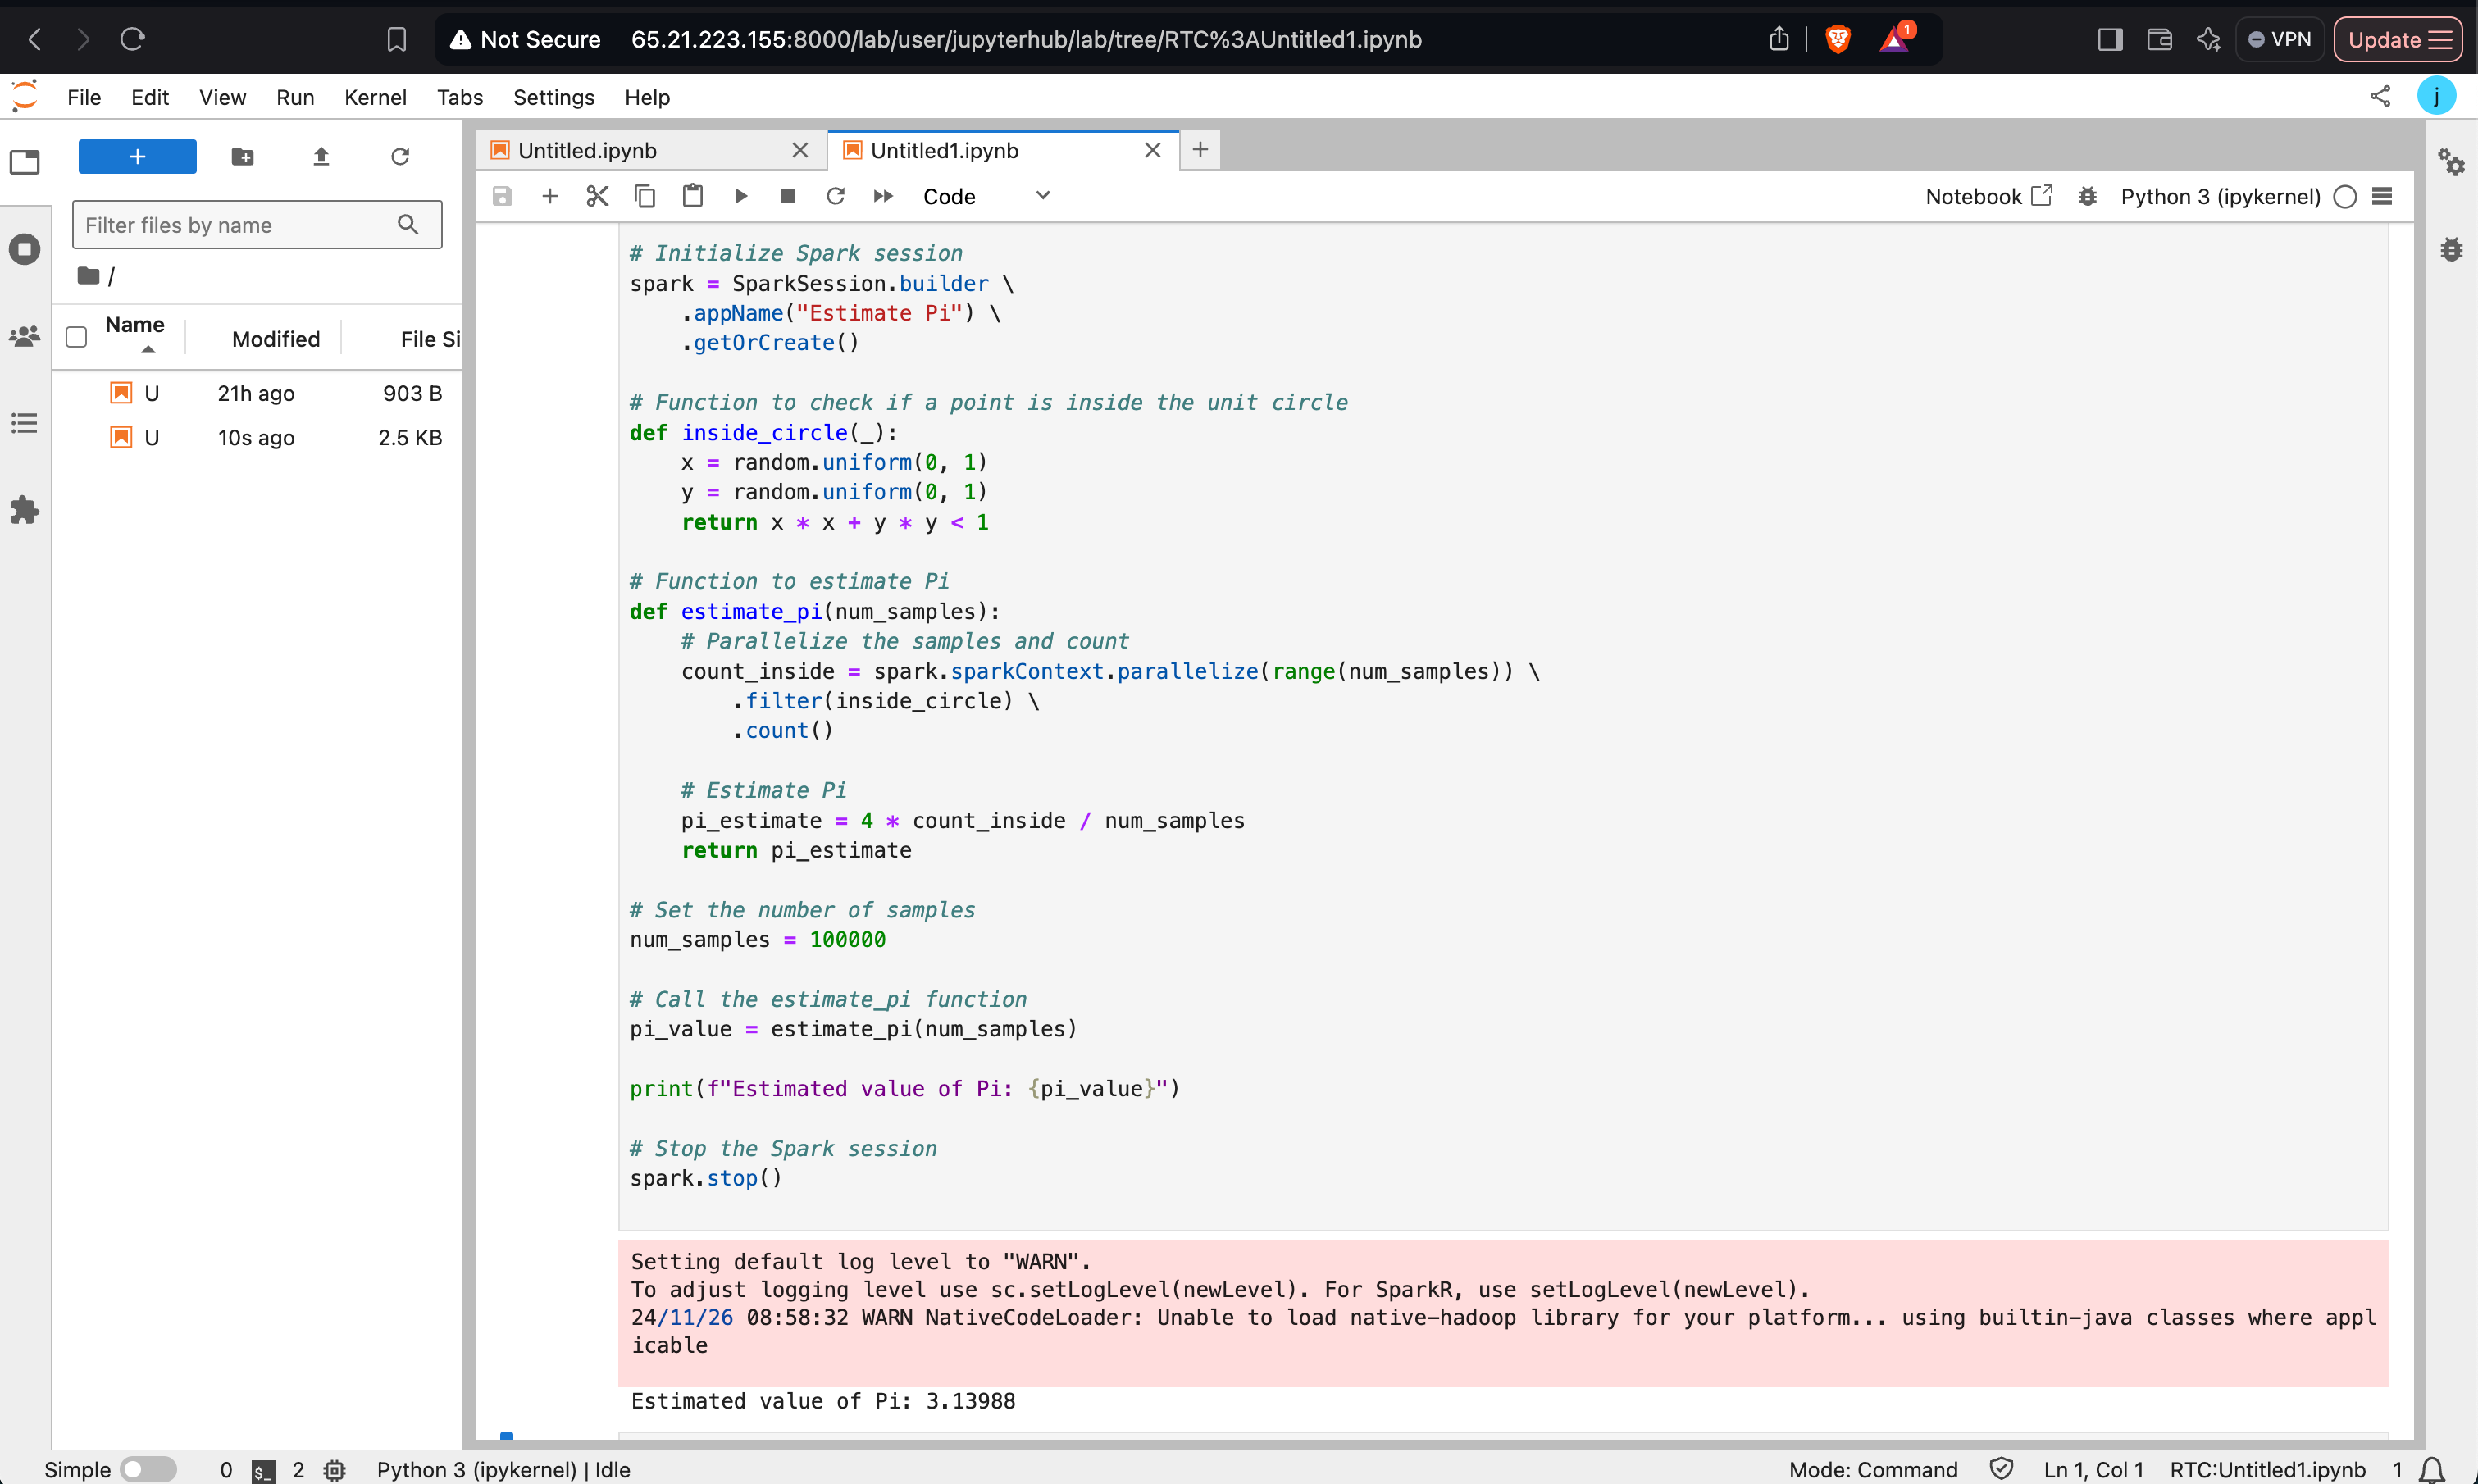
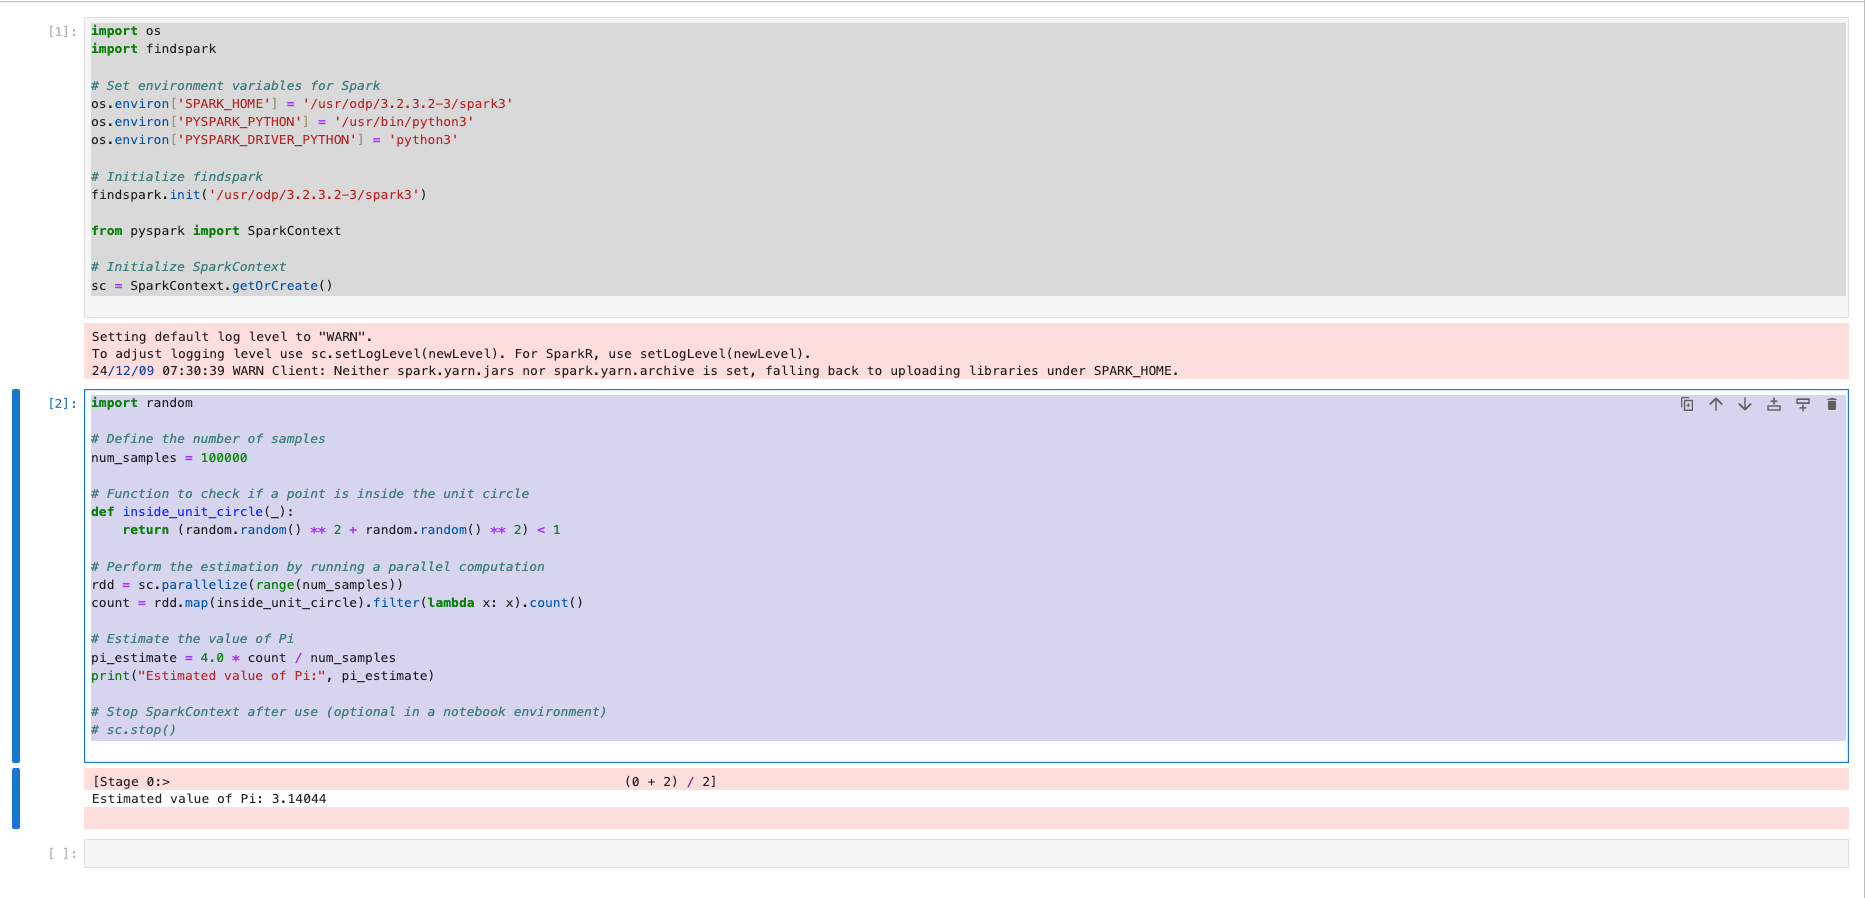
Estimating Pi Using PySpark
This program uses the Monte Carlo method to estimate the value of Pi. It demonstrates how to use PySpark to parallelize computations.
x
from pyspark.sql import SparkSessionimport random# Initialize Spark sessionspark = SparkSession.builder \\ .appName("Estimate Pi") \\ .getOrCreate()# Function to check if a point is inside the unit circledef inside_circle(_): x = random.uniform(0, 1) y = random.uniform(0, 1) return x * x + y * y < 1# Function to estimate Pidef estimate_pi(num_samples): count_inside = spark.sparkContext.parallelize(range(num_samples)) \\ .filter(inside_circle) \\ .count() pi_estimate = 4 * count_inside _ num_samples return pi_estimate# Run estimationnum_samples = 100000pi_value = estimate_pi(num_samples)print(f"Estimated value of Pi: {pi_value}")# Stop the Spark sessionspark.stop()
Creating and Displaying a DataFrame
This example showcases creating a Spark DataFrame using a list of Row objects and displaying it.
from pyspark.sql import SparkSessionfrom datetime import datetime, datefrom pyspark.sql import Row# Initialize Spark sessionspark = SparkSession.builder \\ .appName("MySparkApp") \\ .getOrCreate()# Create a DataFramedf = spark.createDataFrame([ Row(a=1, b=2.0, c='string1', d=date(2000, 1, 1), e=datetime(2000, 1, 1, 12, 0)), Row(a=2, b=3.0, c='string2', d=date(2000, 2, 1), e=datetime(2000, 1, 2, 12, 0)), Row(a=4, b=5.0, c='string3', d=date(2000, 3, 1), e=datetime(2000, 1, 3, 12, 0))])df.show()
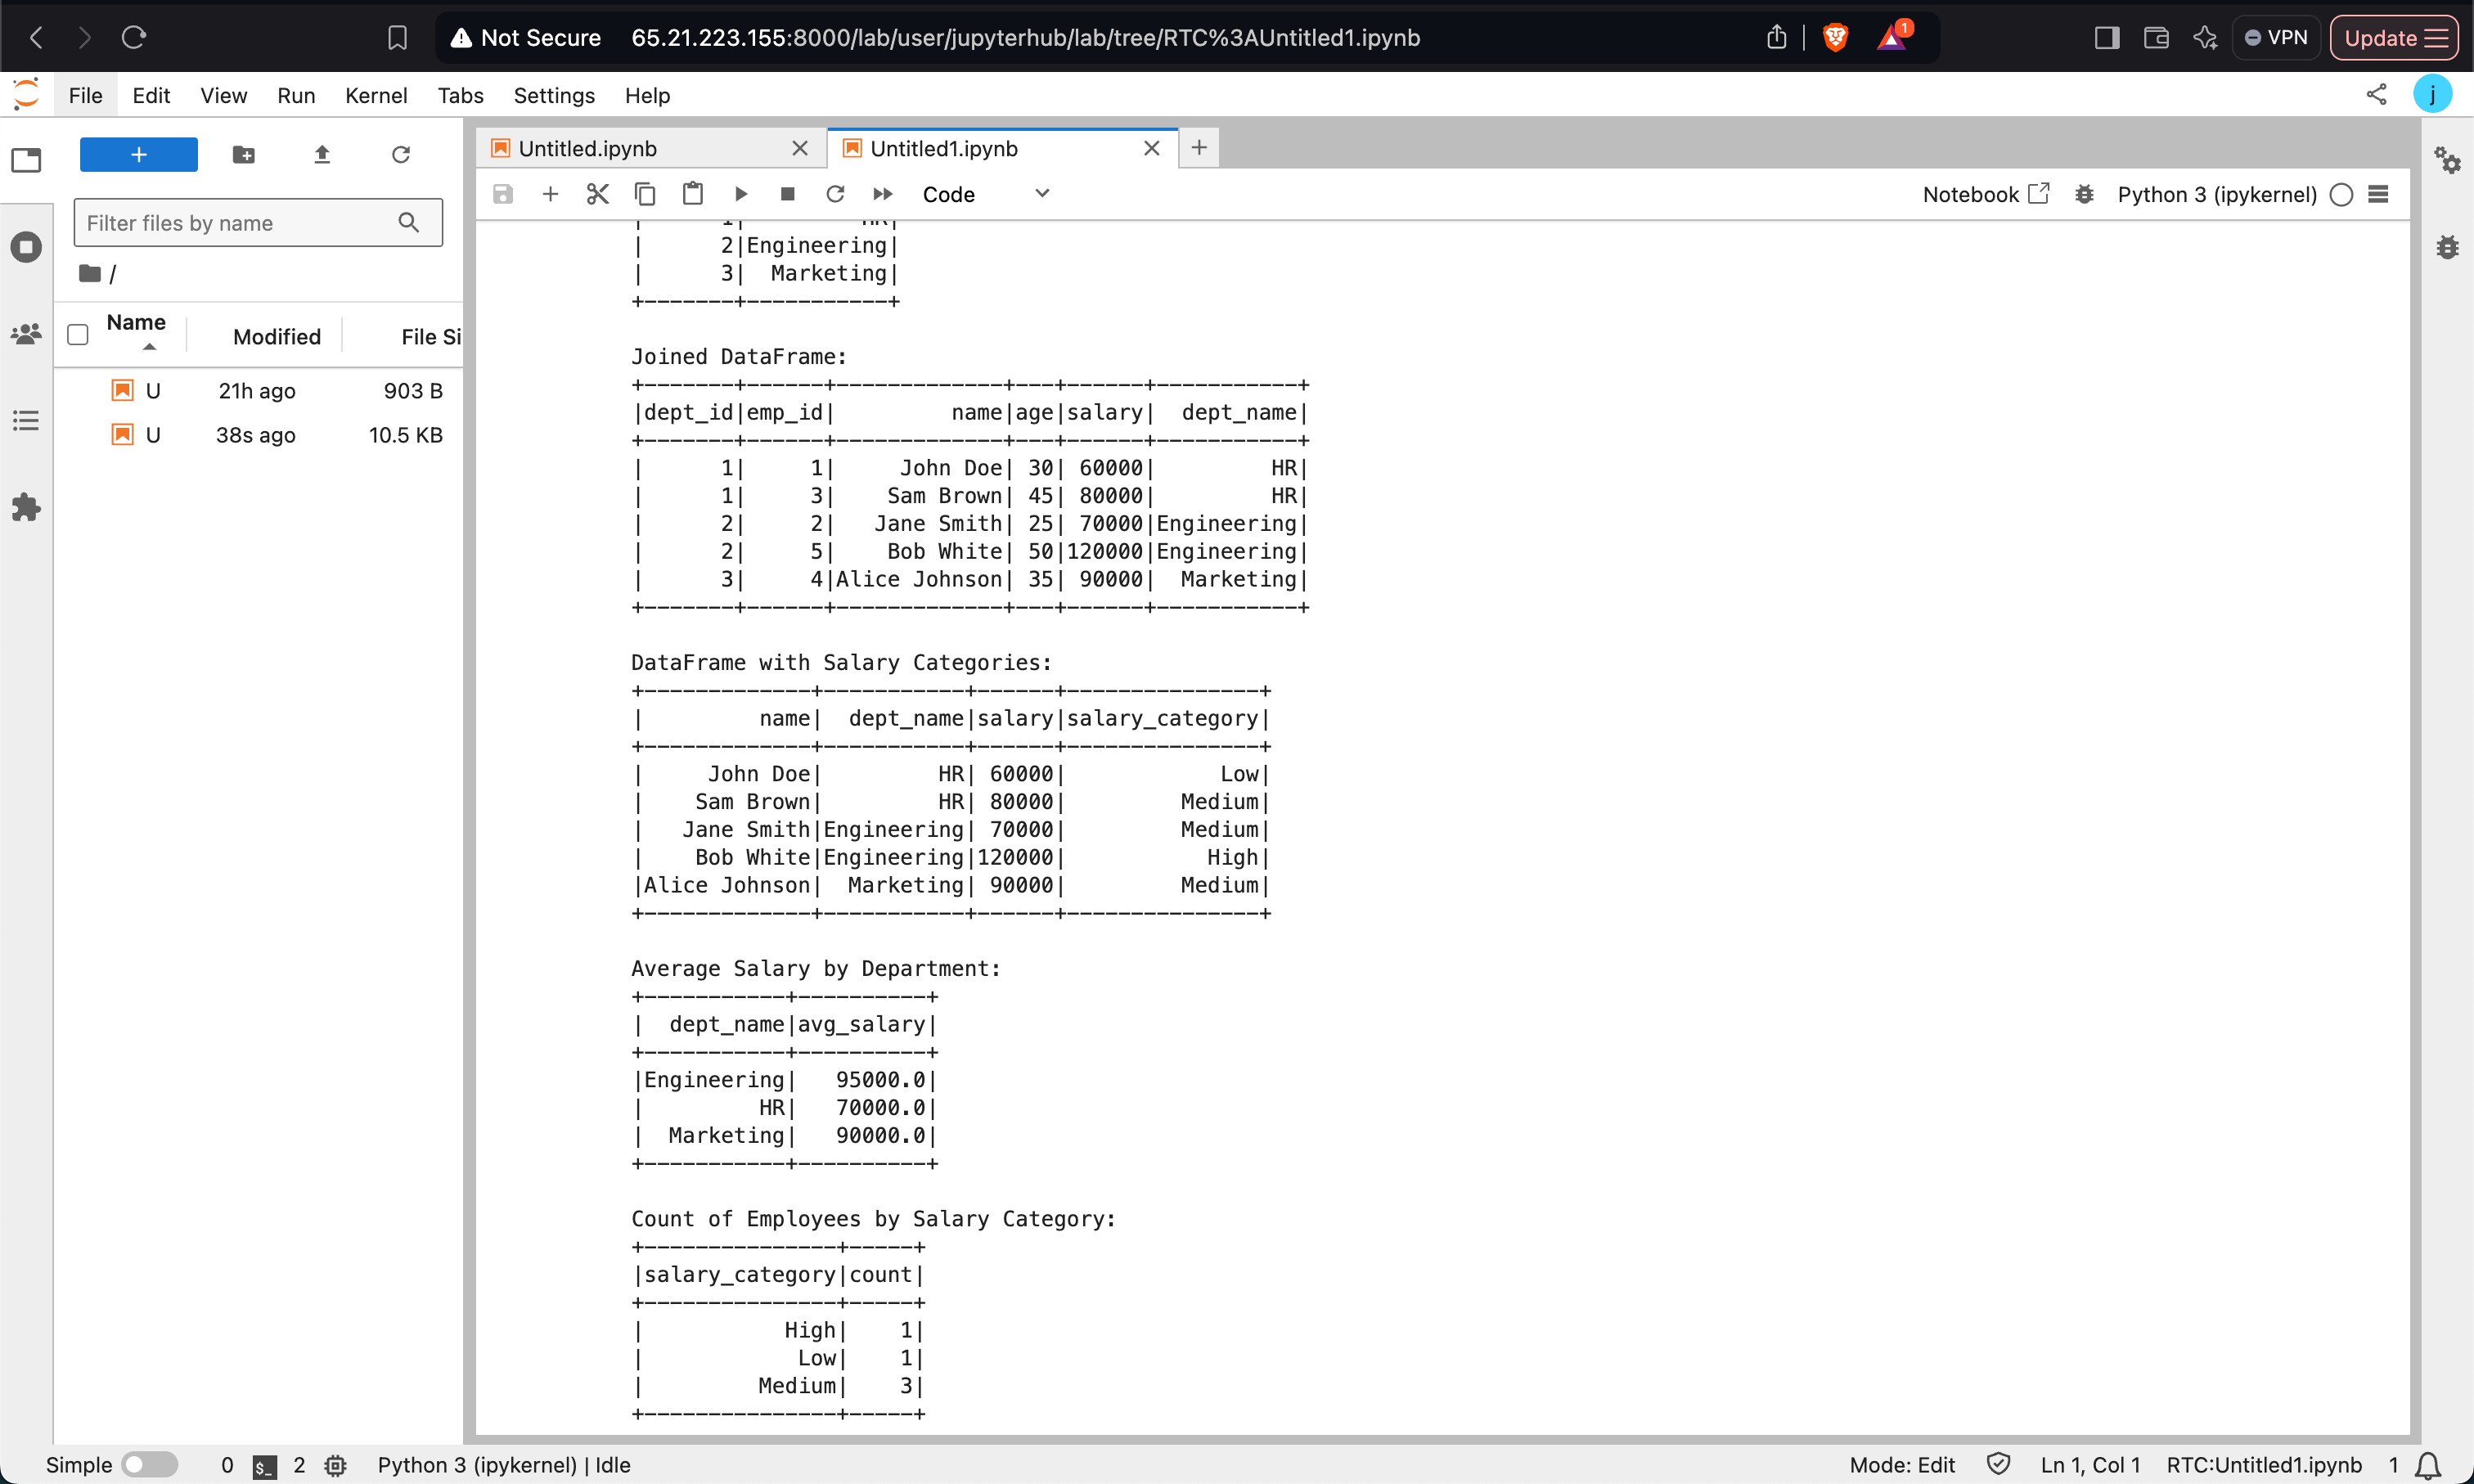
Complex Operations with PySpark
This example demonstrates joining DataFrames, applying User-Defined Functions (UDFs), and executing SQL queries.
Data Preparation and Joining:
from pyspark.sql import SparkSession, Rowspark = SparkSession.builder \\ .appName("Complex Spark Example") \\ .master("yarn") \\ .config("spark.executor.memory", "2g") \\ .config("spark.driver.memory", "1g") \\ .getOrCreate()# Sample dataemployee_data = [ Row(emp_id=1, name='John Doe', age=30, dept_id=1, salary=60000), Row(emp_id=2, name='Jane Smith', age=25, dept_id=2, salary=70000), Row(emp_id=3, name='Sam Brown', age=45, dept_id=1, salary=80000),]department_data = [ Row(dept_id=1, dept_name='HR'), Row(dept_id=2, dept_name='Engineering'),]employee_df = spark.createDataFrame(employee_data)department_df = spark.createDataFrame(department_data)joined_df = employee_df.join(department_df, on='dept_id', how='inner')joined_df.show()Using UDFs:
from pyspark.sql.functions import colfrom pyspark.sql.types import StringTypedef salary_category(salary): if salary < 70000: return 'Low' elif 70000 <= salary < 100000: return 'Medium' else: return 'High'salary_category_udf = spark.udf.register("salary_category", salary_category, StringType())categorized_df = joined_df.withColumn("salary_category", salary_category_udf(col("salary")))categorized_df.select("name", "dept_name", "salary", "salary_category").show()SQL Queries:
categorized_df.createOrReplaceTempView("employee_view")avg_salary_query = spark.sql(""" SELECT dept_name, AVG(salary) AS avg_salary FROM employee_view GROUP BY dept_name""")avg_salary_query.show()
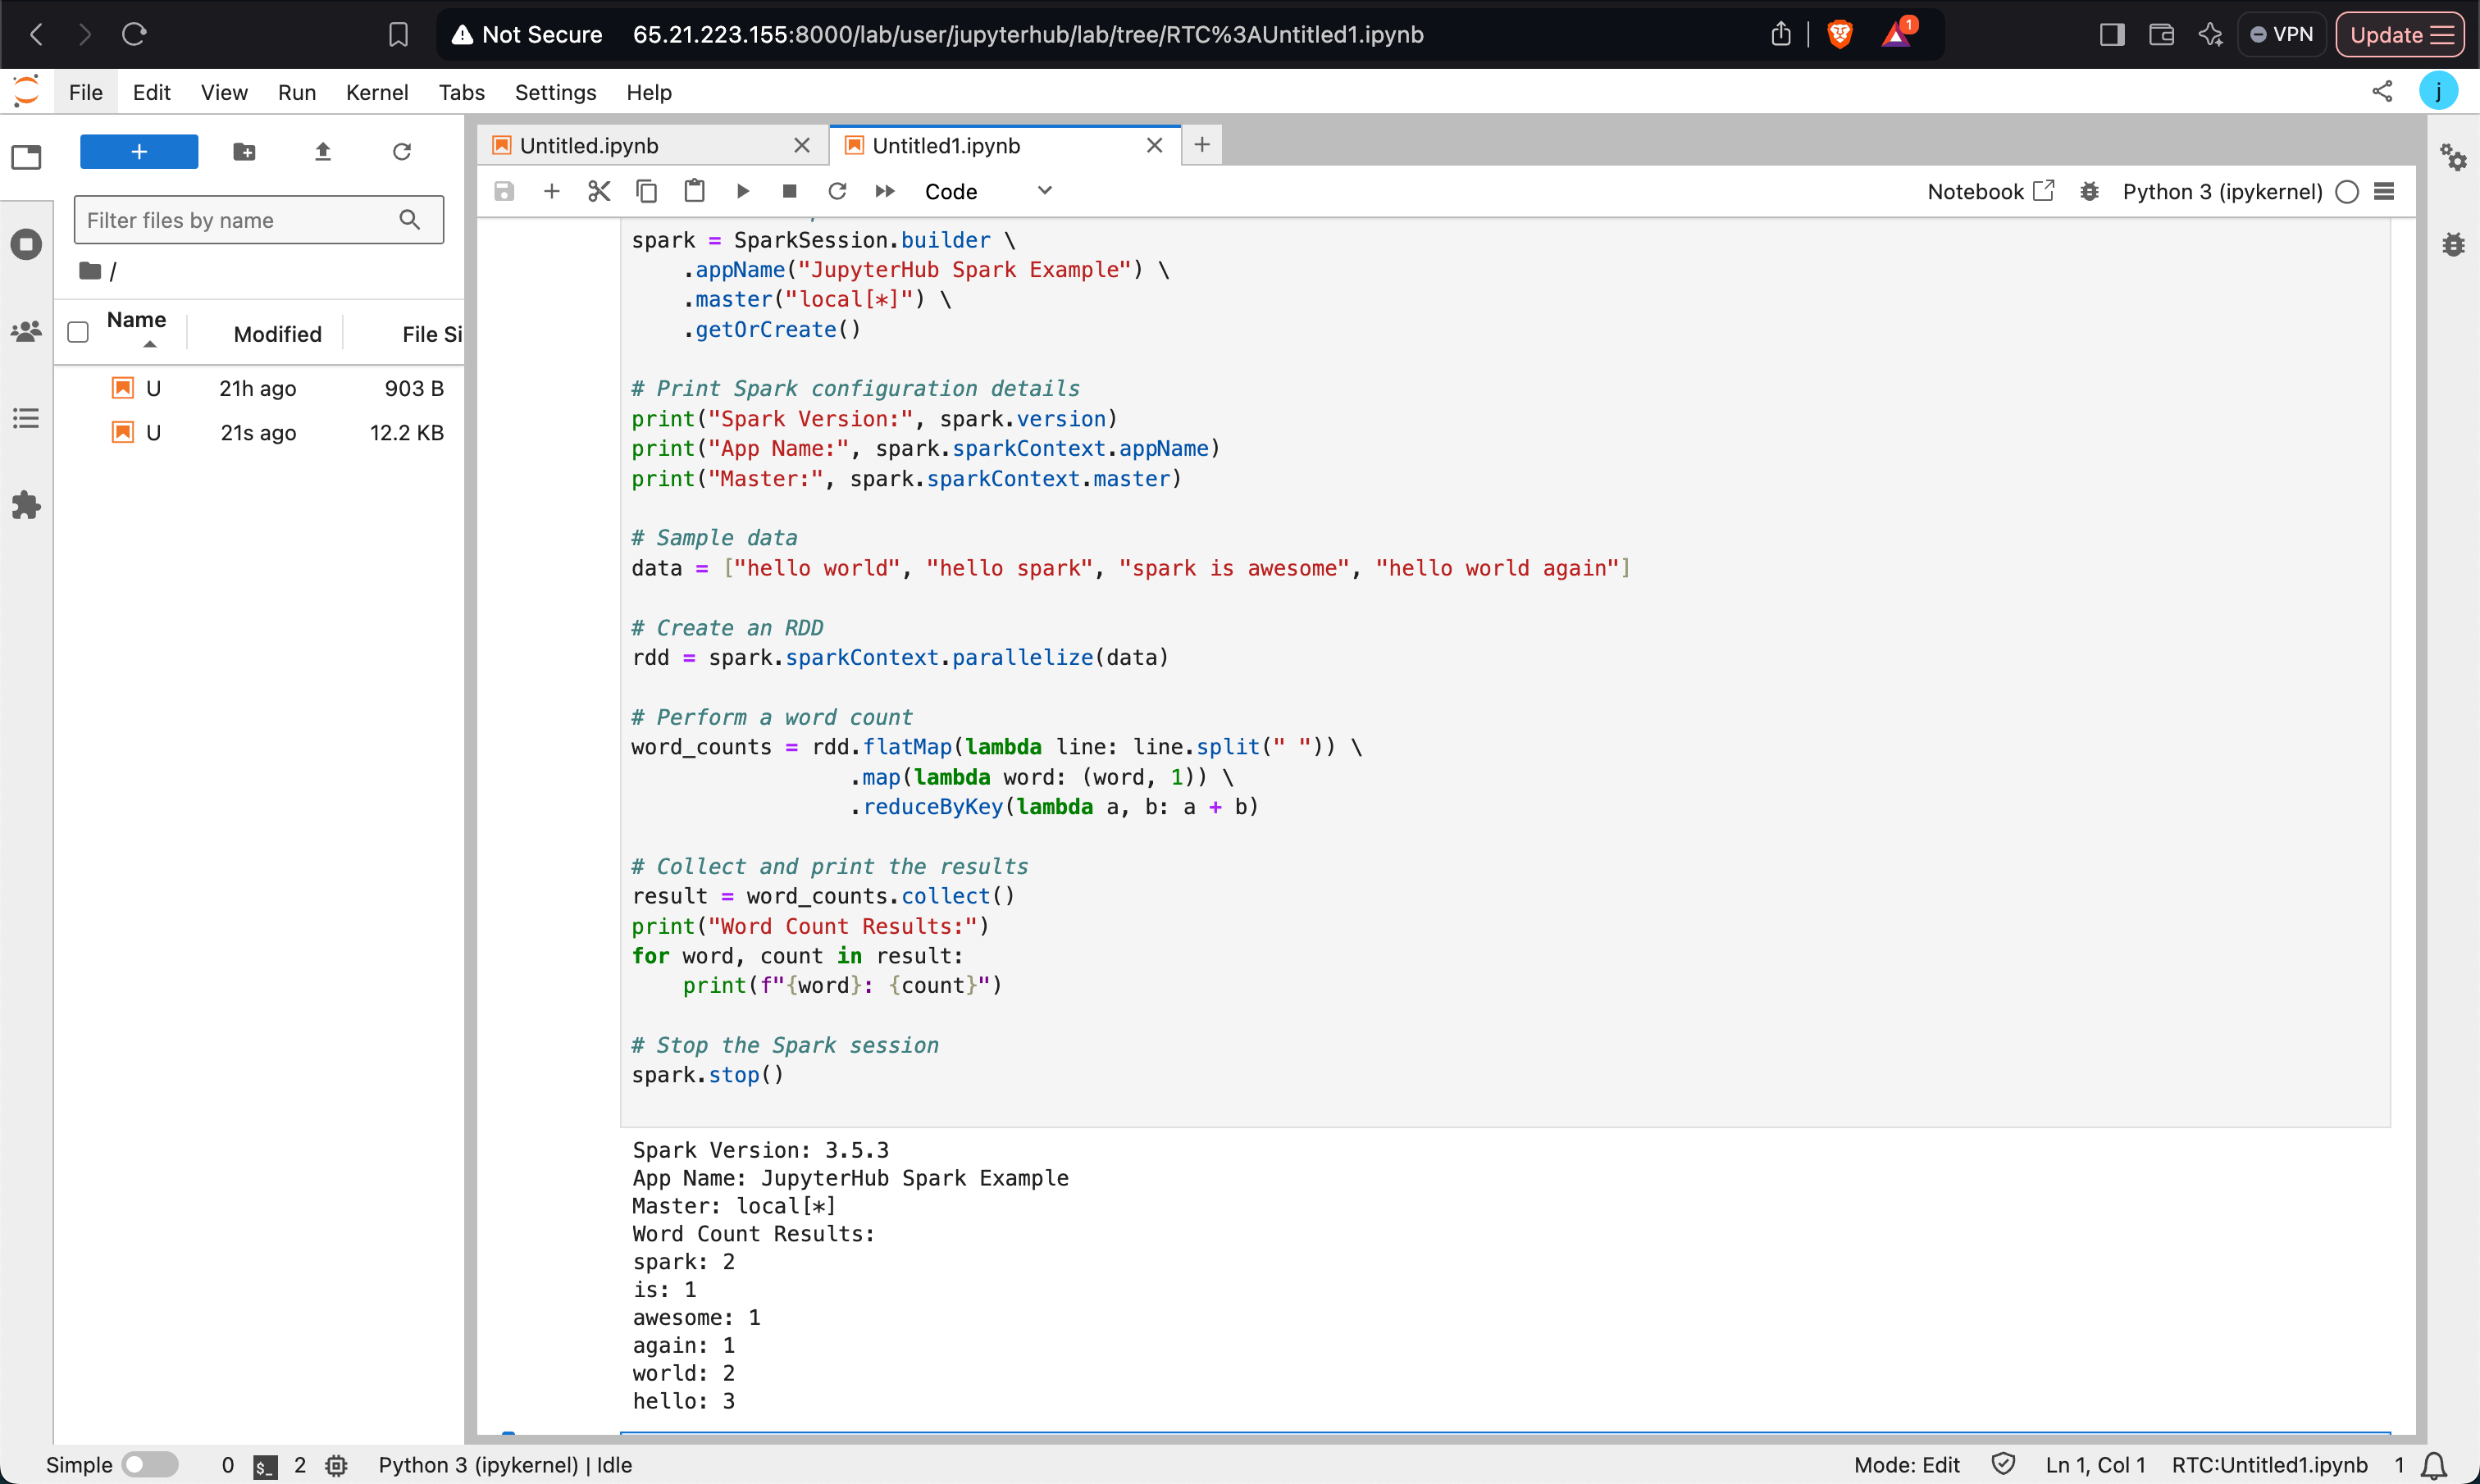
Performing Word Count
A simple word count example demonstrating Spark RDD transformations.
from pyspark.sql import SparkSessionspark = SparkSession.builder \\ .appName("Word Count Example") \\ .master("local[*]") \\ .getOrCreate()# Sample datadata = ["hello world", "hello spark", "spark is awesome", "hello world again"]# Word count using RDDrdd = spark.sparkContext.parallelize(data)word_counts = rdd.flatMap(lambda line: line.split(" ")) \\ .map(lambda word: (word, 1)) \\ .reduceByKey(lambda a, b: a + b)# Display resultsresult = word_counts.collect()for word, count in result: print(f"{word}: {count}")spark.stop()
Using ODP’s Spark version
import osimport findspark# Set environment variables for Sparkos.environ['SPARK_HOME'] = '_usr_odp_3.2.3.2-3_spark3'os.environ['PYSPARK_PYTHON'] = '_usr_bin_python3'os.environ['PYSPARK_DRIVER_PYTHON'] = 'python3'# Initialize findsparkfindspark.init('_usr_odp_3.2.3.2-3_spark3')from pyspark import SparkContext# Initialize SparkContextsc = SparkContext.getOrCreate()import random# Define the number of samplesnum_samples = 100000# Function to check if a point is inside the unit circledef inside_unit_circle(_): return (random.random() ** 2 + random.random() ** 2) < 1# Perform the estimation by running a parallel computationrdd = sc.parallelize(range(num_samples))count = rdd.map(inside_unit_circle).filter(lambda x: x).count()# Estimate the value of Pipi_estimate = 4.0 * count _ num_samplesprint("Estimated value of Pi:", pi_estimate)# Stop SparkContext after use (optional in a notebook environment)# sc.stop()Submit the Job to a Cluster (Optional)
If you’re using a cluster manager like YARN with JupyterHub, you need to adjust the configurations accordingly:
from pyspark import SparkConf, SparkContextconf = SparkConf() \\ .setAppName("Pi Estimation") \\ .setMaster("yarn") \\ .set("spark.executor.memory", "4g") \\ .set("spark.executor.cores", "2")sc = SparkContext(conf=conf)
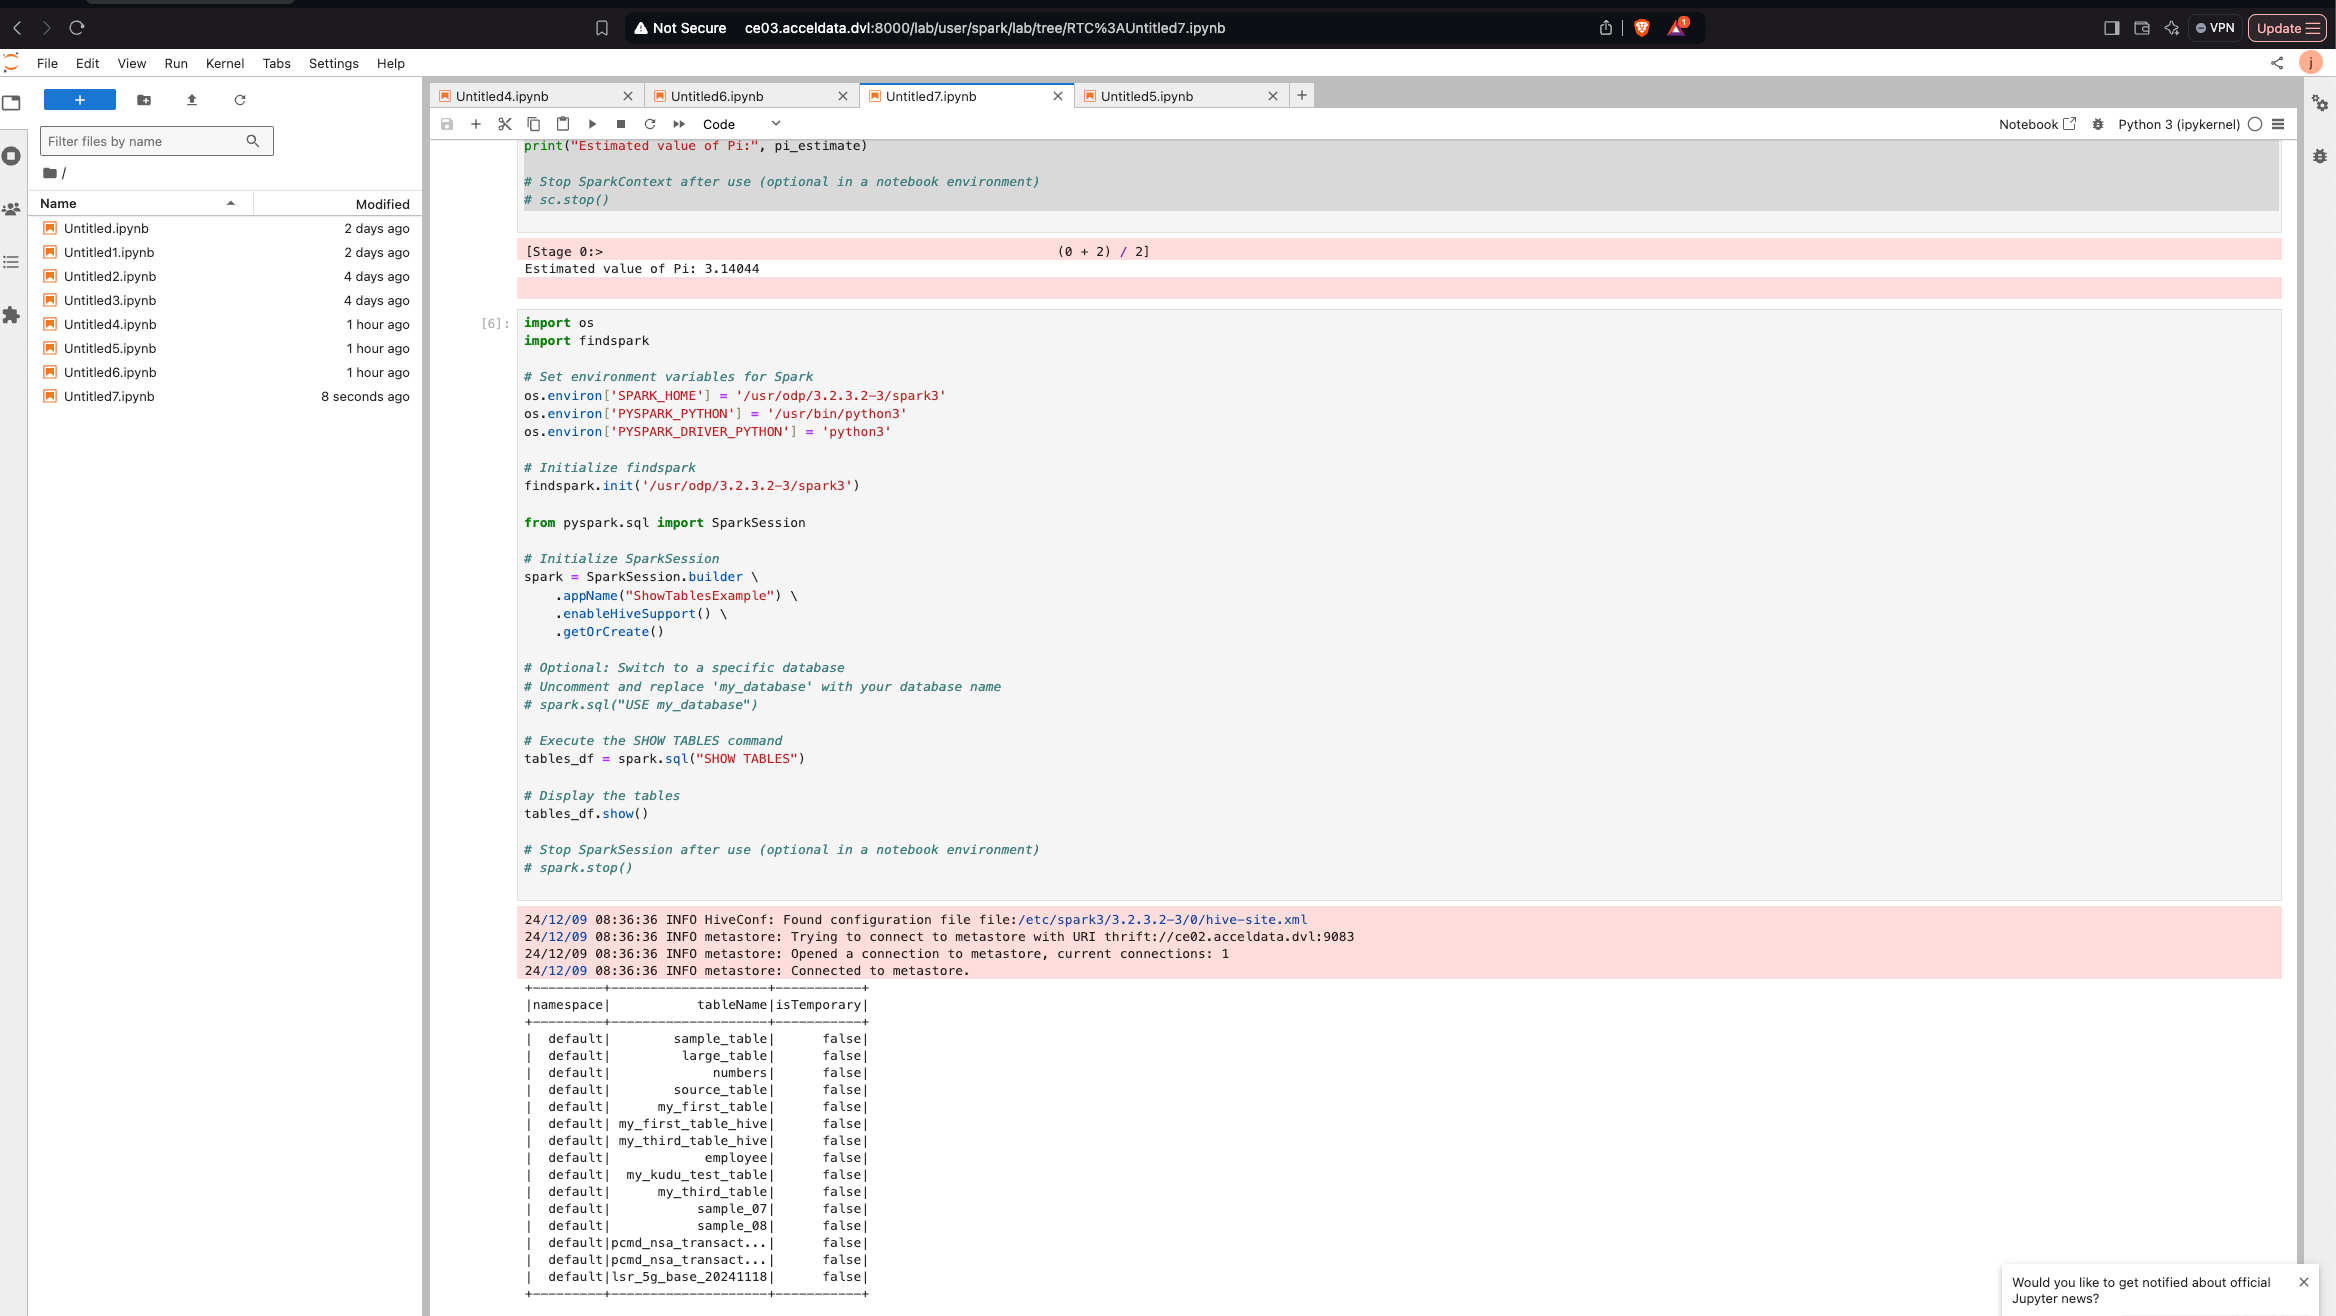
Show Hive Tables in Spark
import osimport findspark# Set environment variables for Sparkos.environ['SPARK_HOME'] = '_usr_odp_3.2.3.2-3_spark3'os.environ['PYSPARK_PYTHON'] = '_usr_bin_python3'os.environ['PYSPARK_DRIVER_PYTHON'] = 'python3'# Initialize findsparkfindspark.init('_usr_odp_3.2.3.2-3_spark3')from pyspark.sql import SparkSession# Initialize SparkSessionspark = SparkSession.builder \\ .appName("ShowTablesExample") \\ .enableHiveSupport() \\ # Optional if you use Hive .getOrCreate()# Optional: Switch to a specific database# Uncomment and replace 'my_database' with your database name# spark.sql("USE my_database")# Execute the SHOW TABLES commandtables_df = spark.sql("SHOW TABLES")# Display the tablestables_df.show()# Stop SparkSession after use (optional in a notebook environment)# spark.stop()How It Works:
- Environment Setup: Configures the necessary Spark environment variables.
- SparkSession: Initializes a
SparkSessionwith Hive support (if needed). - Switch Database (Optional): You can switch to a specific database if you want to list tables from it.
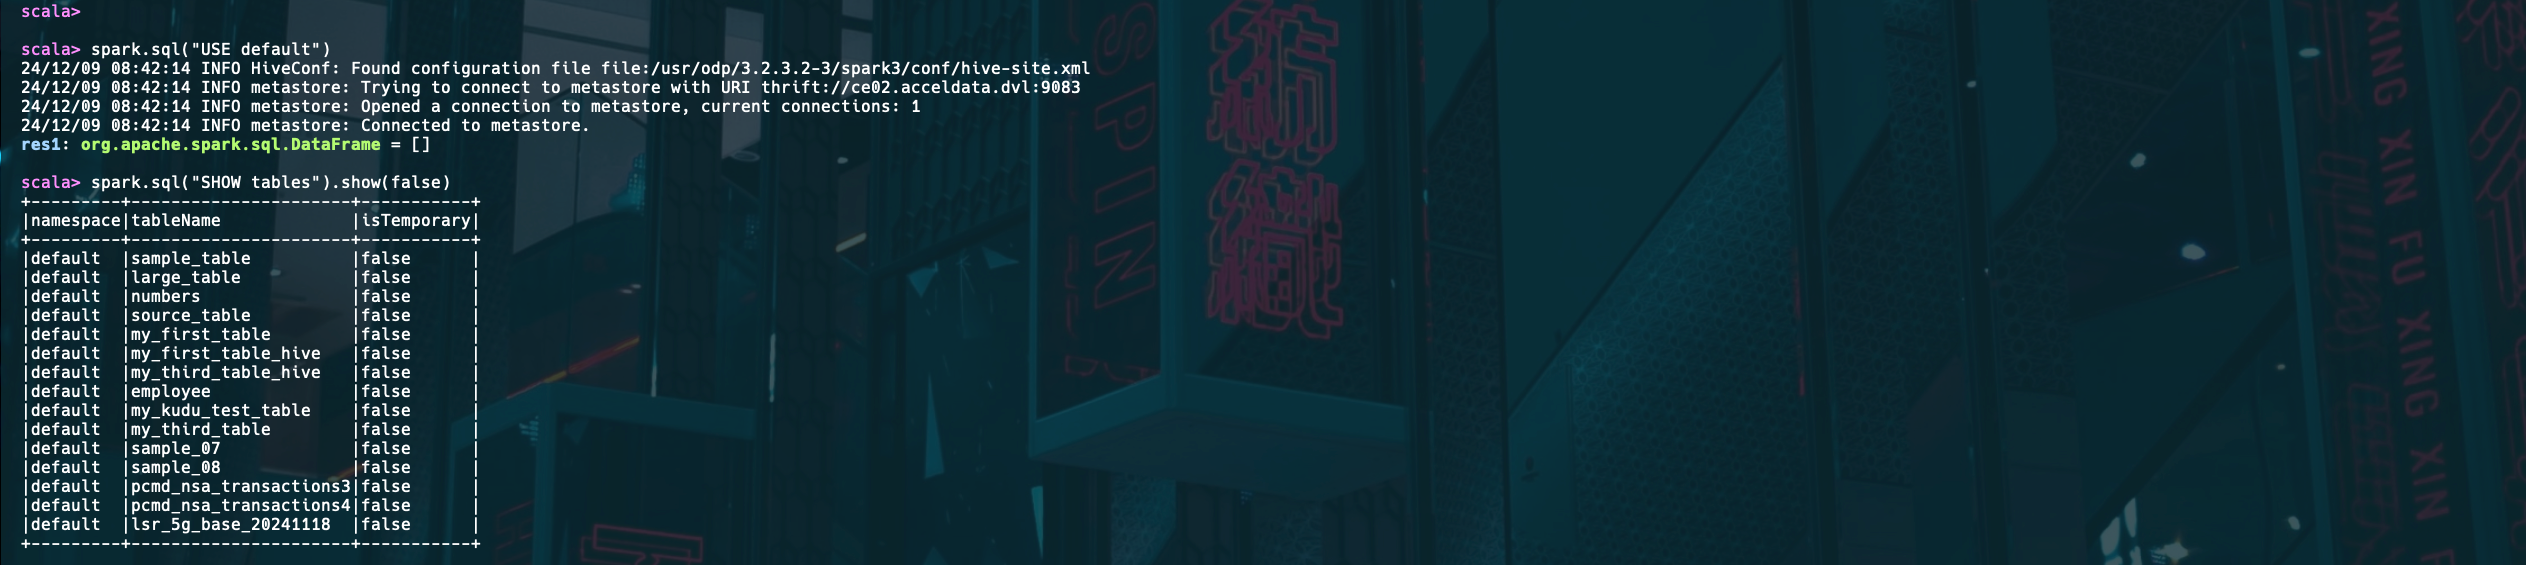
- Show Tables: Executes the SQL command
SHOW TABLES, which returns a DataFrame of tables. - Display Output: Displays the list of tables in the output.
Expected Output:


Note
- Dependencies: Ensure Spark is correctly set up and configured for
localoryarnmode depending on the example. - UDFs: Register user-defined functions (UDFs) as required for custom transformations.
- SQL Queries: Use
createOrReplaceTempViewto run SQL queries on DataFrames. - Data Source: Replace hardcoded data with external sources like HDFS, databases, or files for real-world applications.
- Resource Configurations: Tune
spark.executor.memoryandspark.driver.memorybased on the cluster size and workload requirements.
Was this page helpful?