Alerts
You can use Alerts to monitor your system infrastructure. You can monitor key modules of your infrastructure like CPU, memory, database health, HDFS and so on. Pulse provides you metrics for every module. You can apply filters on metrics as per your organization’s requirements to create an alert.
Alert Notification: Every Alert is associated with a notification and an action. You can configure notifications and actions for an alert. When you configure notifications for an alert, the configured person or team receives a notification that the alert has been triggered. Pulse provides you six notification channels to configure a notification.
Alert Action: You can configure an action when an alert is triggered. An action is a playbook which is executed to get the system back to normal operation.
Alert Incidents: If an alert is triggered multiple times in a specific time-period, an incident is raised for the alarm. You can view incidents from the notification icon on the top-right corner or navigate to Alerts > Incidents. For more information about Incidents, see Incidents.
Alert Use Cases: You can create an alert for all the YARN MapReduce jobs. You can set this alert to monitor the number of mappers, or the number of reducers. If there is an abnormality, you can configure the alert to trigger an alarm. You can also create an alarm that monitors the Spark jobs. If a spark job is not completed within the stipulated time, you can configure the alert to trigger an alarm.
You can create alerts related to CPU, Disk, Network, YARN Applications, etc. Acceldata also ships with a set of stock alerts.
Types of Alerts
Pulse provides you with two types of alerts.
- Stock Alerts: These are out of the box alerts provided by Pulse. All the filters and actions are pre-configured in these alerts. You can choose to enable or disable a stock alert, as required. If you enable the alert, and if the alert condition is matched, the alert triggers notifications and the action associated with the alert.
- Custom Alerts: Any alert which you create in pulse is a custom alert. You must set the alert filters and configure the alert notifications and actions for these alerts from scratch.
- Predefined Alerts: Predefined alerts are a special type of Stock alerts provided by Pulse. These alerts have multiple queries and you can edit these alerts.
Understanding the Alerts Page Options
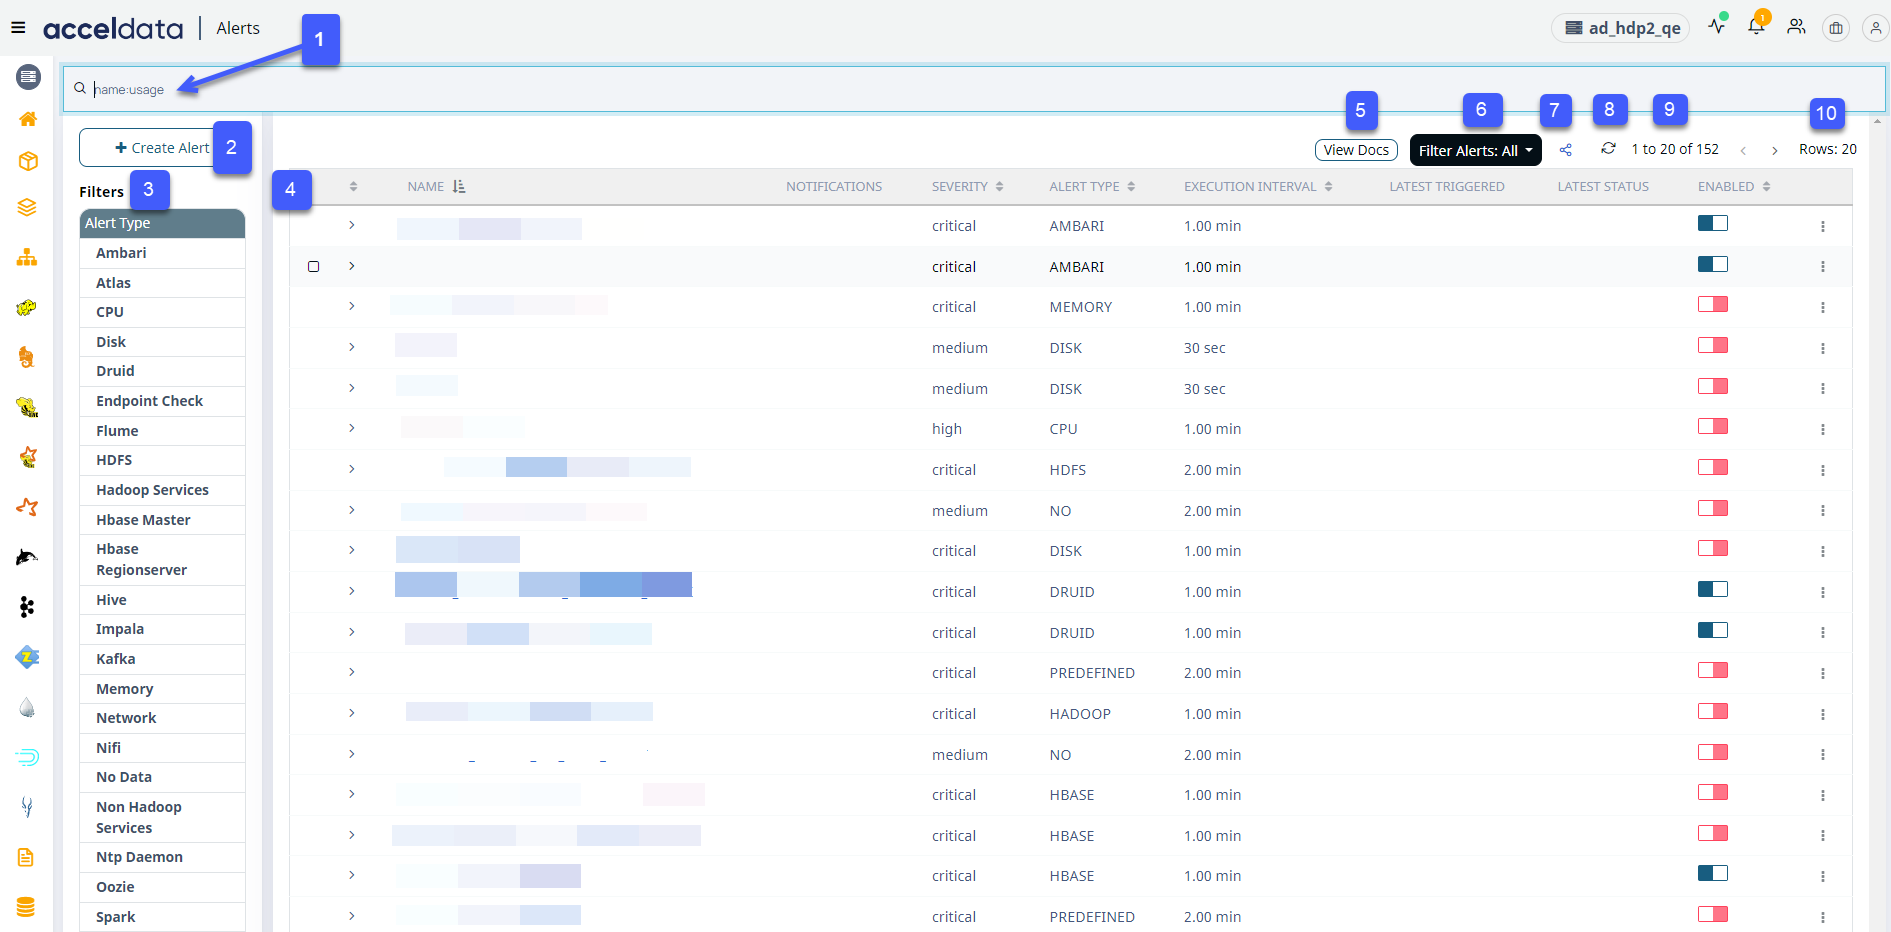
The Alerts page has multiple components, as displayed in the following image.

Every component in the image is labeled with a number to help you identify it. The components are described in the following table.
| ID | UI Component Name | Description |
|---|---|---|
| 1 | Search Bar | You can use the search bar to search alerts quickly. |
| 2 | Create Alert | Click here to create a new custom alert. |
| 3 | Filters | Filter and view alerts specific to a service. When you select a specific metric, alerts configured for the selected metric are displayed in the alert list view table |
| 4 | Alert List View Table | This table lists all the alerts. You can view the alert and some of its fields as listed in the columns. |
| 5 | View Docs | Click here to view alert documentation for alert Category. |
| 6 | Filter Alerts | You can filter the alerts based on the following criteria;
|
| 7 | Export/Import Alerts | Click here to export or import alerts. Pulse exports alerts as a JSON file. You can also import a JSON file and create an alert from the same. |
| 8 | Refresh | Click here to refresh the alert list view. You can view the latest status of each alert after a refresh. |
| 9 | Switch to Next/Previous Alerts | Click the > or < buttons to view the next or previous set of alerts, respectively. |
| 10 | Number of Alerts Displayed | Click here to set the number of alerts displayed in the alert list view. You can set the value to either 10, 20, 50 or 100. |
Maintenance Mode
Turning on the Maintenance Mode allows you to suppress the alerts during the planned activities.
Use this functionality for scheduled maintenance.
You can now disable notifications at the global level by using this functionality. It will have an effect on all alerts in a cluster. The evaluation results are generated by Pulse based on the groupby field (if provided). The evaluation results will then be examined by alerts, and it will be skipped for subsequent meter checks.
Follow the steps to enable the maintenance mode on Alerts:
- Find in each cluster a file similar to this:
work/clusterName>/alerts/maintenance/maintenanceConfig.json.
- Structure the following structure in the
maintenanceConfig.json
{ groupingBased: { "host": ["<host name>"], "app": ["llap"] }}groupingBased field, multiple keys (strings) and values (arrays of Strings) can be specified for each group by key.
- Restart the alert container.
To disable the maintenance mode, perform the following steps:
- Navigate to the cluster where the file was created:
Example: work/clusterName>/alerts/maintenance/maintenanceConfig.json.
- Remove the file added in the
maintenanceConfig.json. - Restart the alert container.
Log Search Alert String Regex Rules
Pulse utilizes the Elastic Search Query's Simple_Query_String function.
Pulse uses the default AND(+) operator.
Example: if you search for 'ApplicationMaster: Exception from Reporter thread'.
Then Elastic will search for 'ApplicationMaster: + Exception + from + Reporter + thread,' which means it will look for any documents that contain all of the terms in the string.
The following special characters are supported by simple query string:
| Special Characters | |
|---|---|
| denotes the AND operation. | |
| denotes an OR operation. | |
| negates a single token | |
| (and) | signifies precedence |
In order to find any of these special characters, click