Info
The Druid Service Integration feature is only compatible with the latest version of Acceldata’s Open Source Data Platform.
Cluster Configuration
To activate Druid JMX and SYS metrics, you must specify where the data should be sent by informing the Druid Service Components.
Proceed with the following steps to enable Druid Metrics:
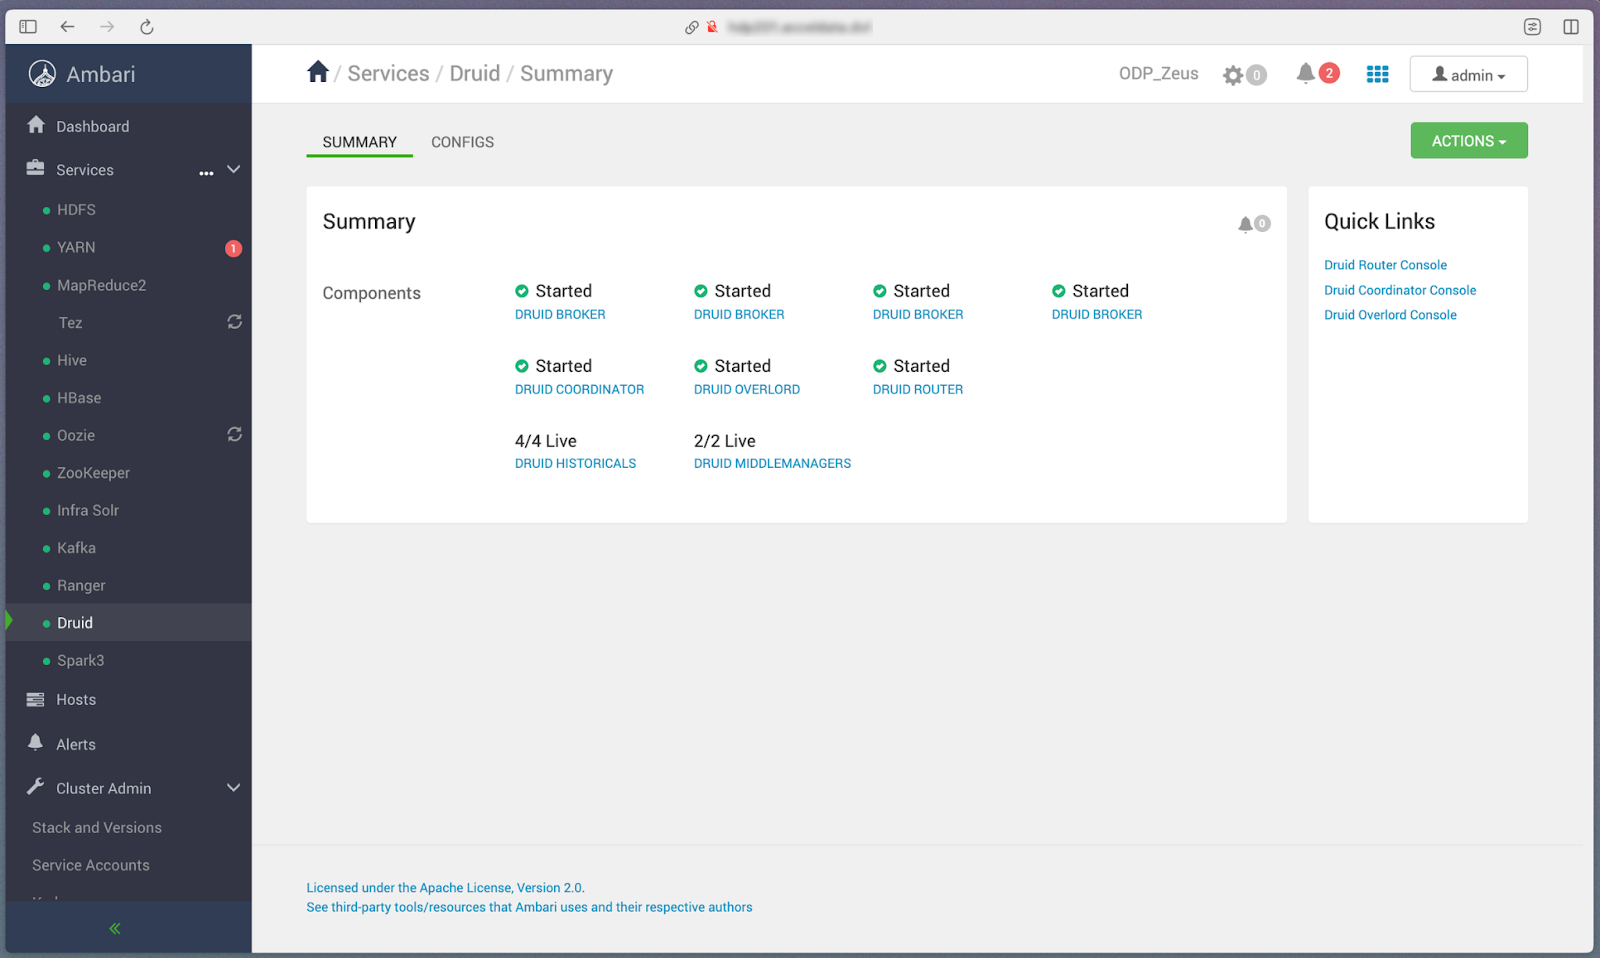
Launch Ambari.
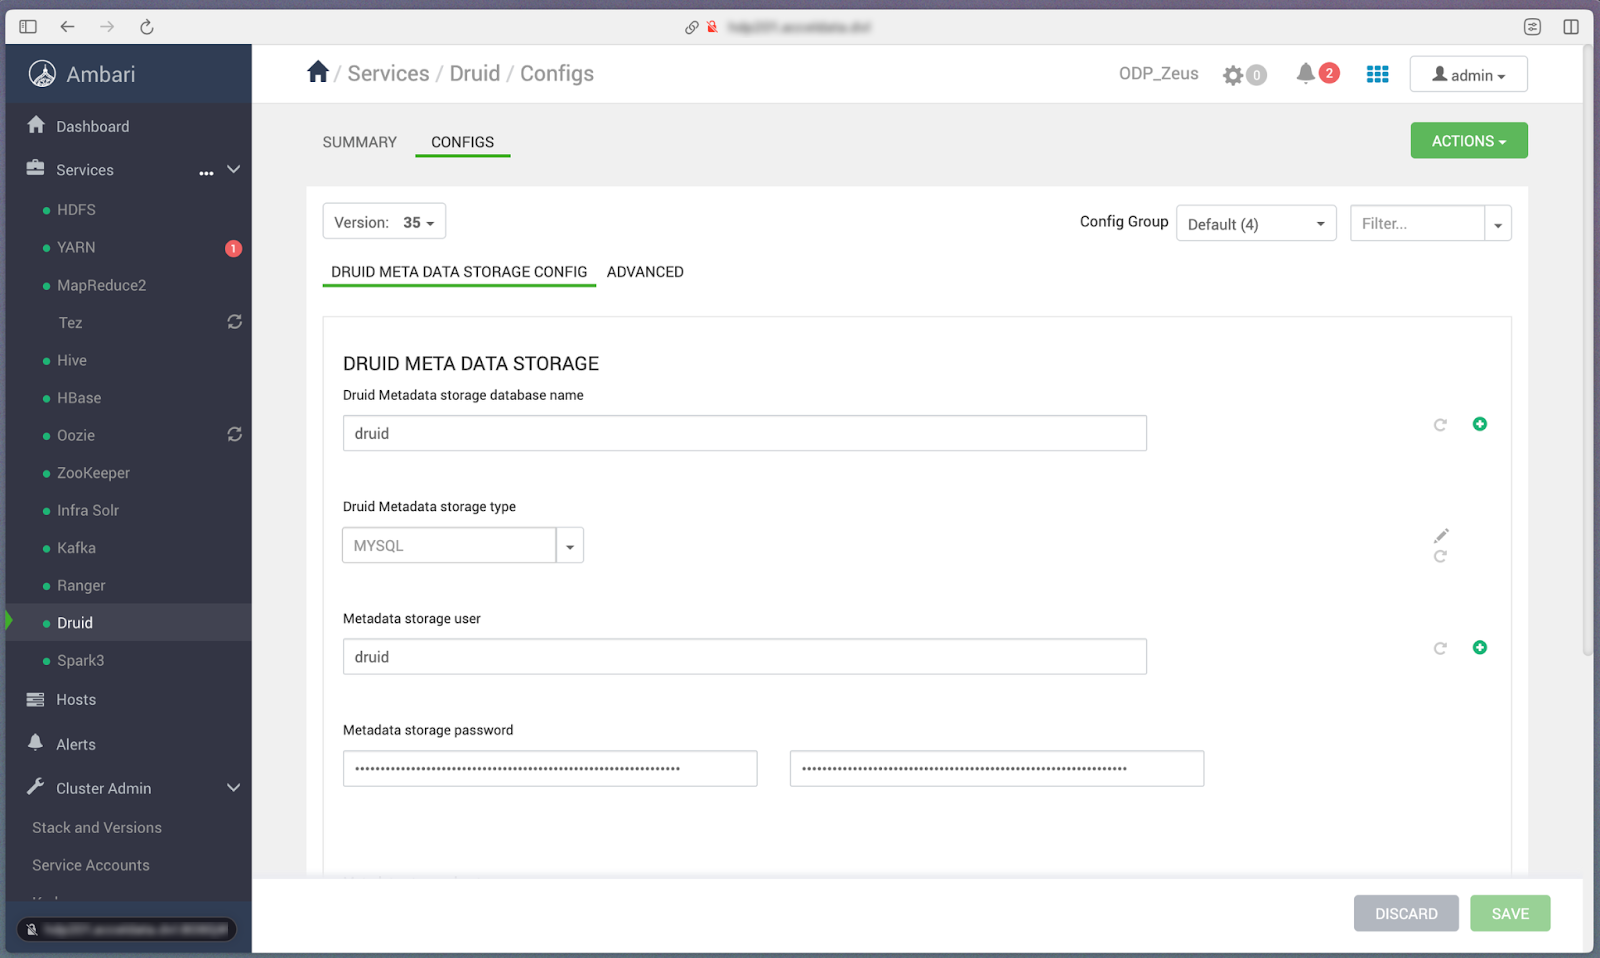
Navigate to Configs:
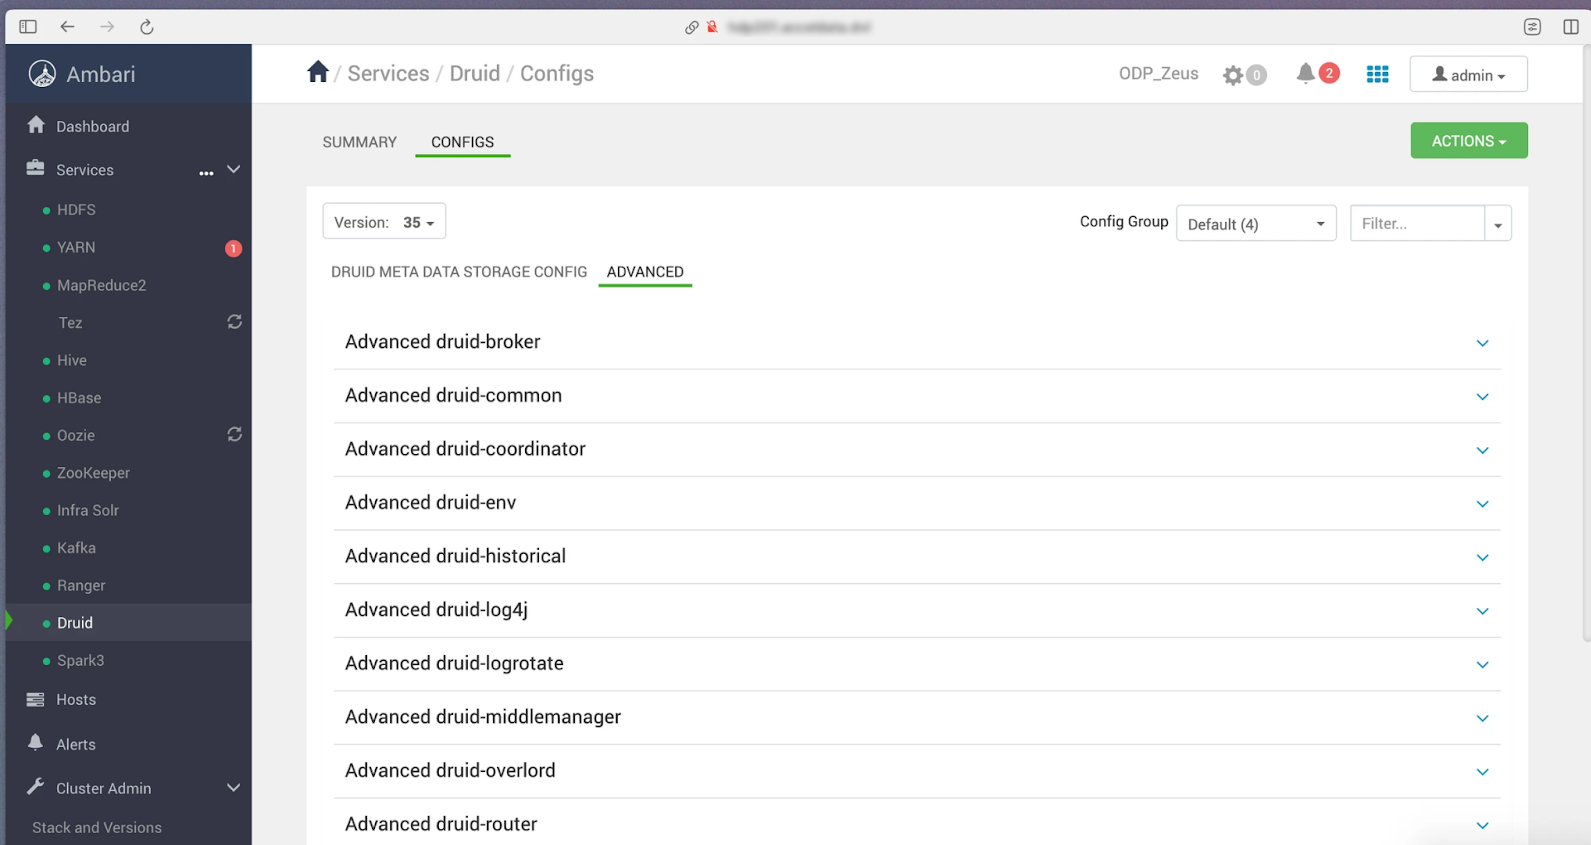
Access the Advanced Settings.
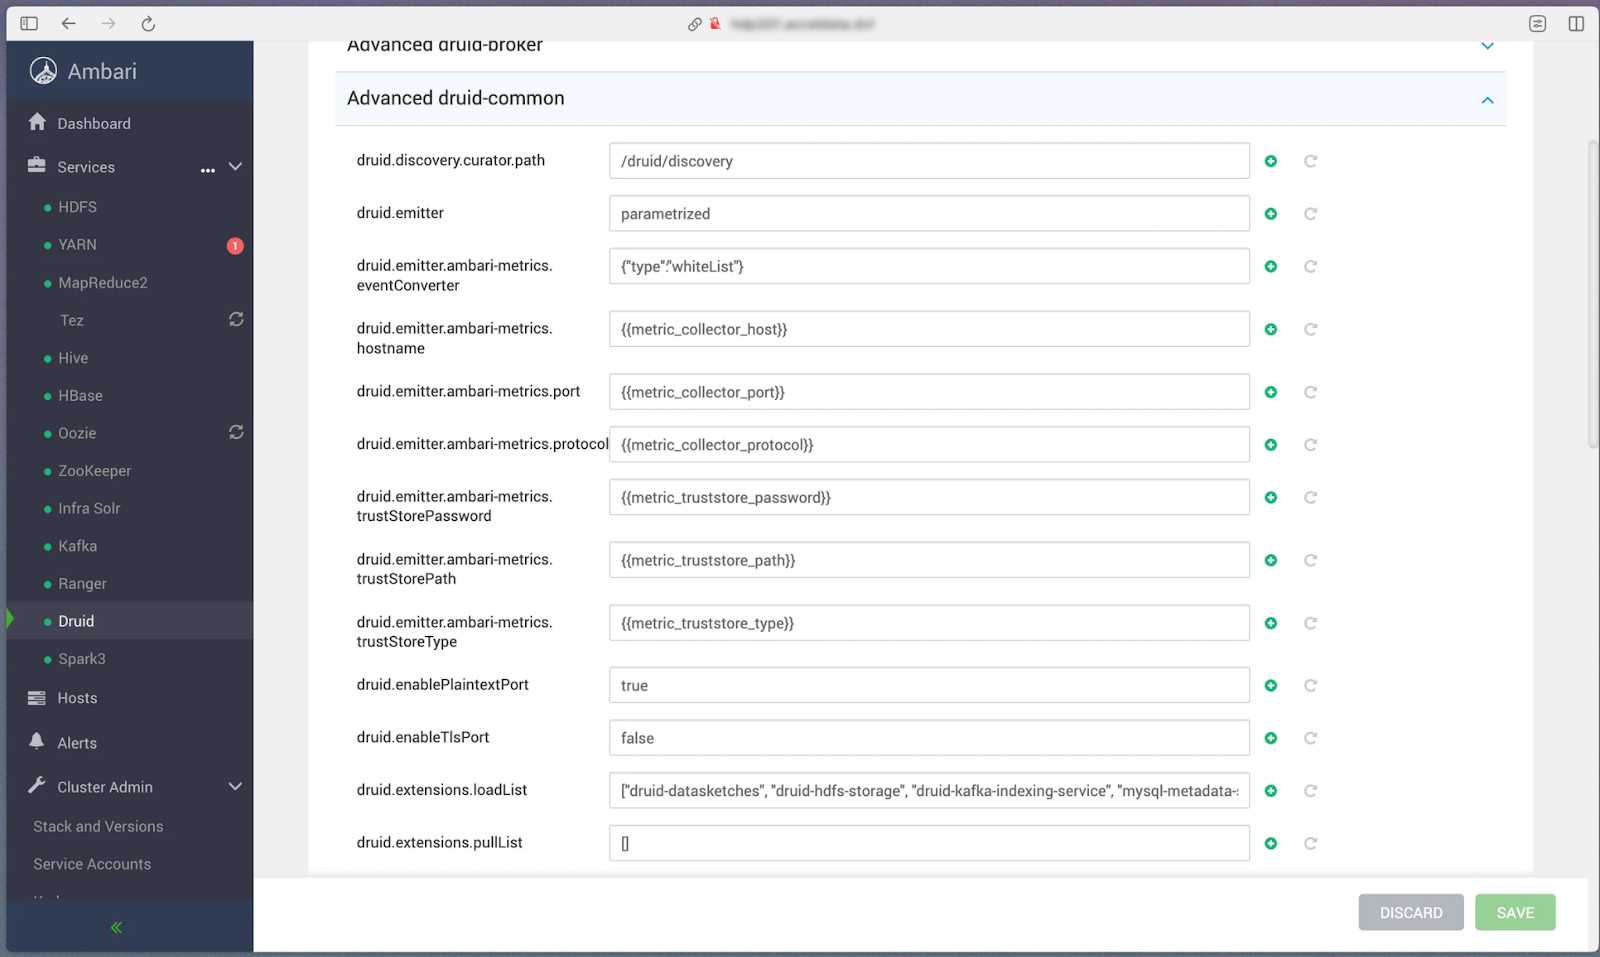
Navigate to the Advanced druid-common section.
Within druid.monitoring.metrics, include the following classes:
["org.apache.druid.java.util.metrics.JvmMonitor", "org.apache.druid.java.util.metrics.JvmThreadsMonitor", "org.apache.druid.java.util.metrics.SysMonitor"]
In the druid.emitter field, add the parameterized option:
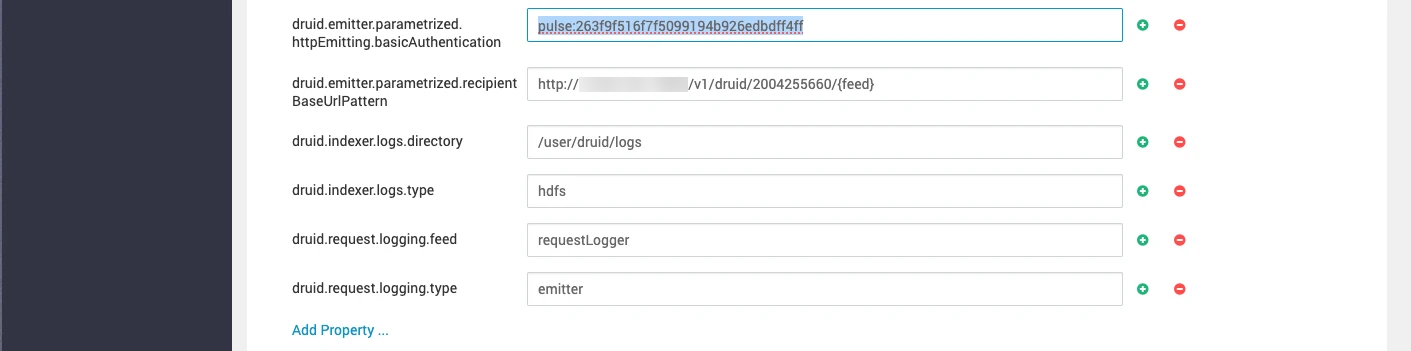
In the Custom Druid Common section, append the following fields and values:
druid.emitter.parametrized.recipientBaseUrlPattern = http://<Pulse Server Hostname>:19090/v1/druid/<ClusterHash>/{feed}
Replace the <> with appropriate values.
druid.request.logging.feed = requestLogger
druid.request.logging.type = emitter
druid.emitter.parametrized.httpEmitting.basicAuthentication=pulse:263f9f516f7f5099194b926edbdff4ff
For the Kubernetes based deployment, append the following field and value:
druid.emitter.parametrized.recipientBaseUrlPattern = http://<Pulse server hostname>:30000/ad-druid-analyzer/v1/druid/<ClusterHash>/{feed}
Save the configurations.
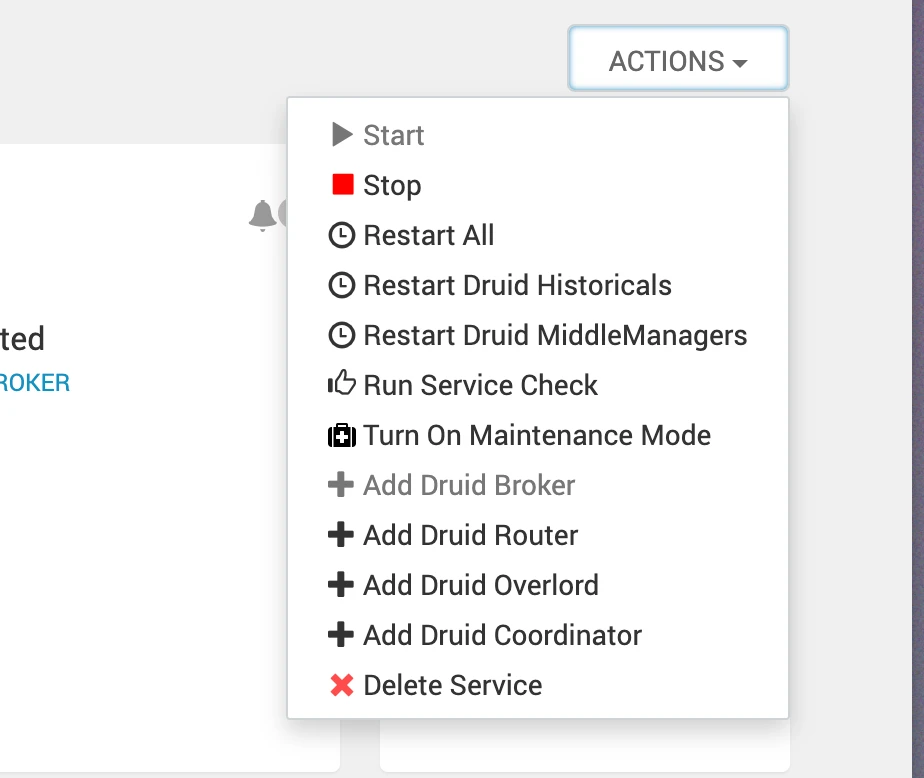
Restart the Druid Service.
Pulse Server Changes
To deploy the Druid Analyzer in the Pulse server node, perform the following:
Run accelo deploy addons and select Druid Analyzer:
[root@sac04:~ (ad-default)]$ accelo deploy addons
WARN: Gauntlet is running in dry run mode. Disable this to delete indices from elastic and purge data from mongo DB
INFO: Active Cluster: zeus
? Select the components you would like to install: [Use arrows to move, space to select, <right> to all, <left> to none, type to filter]
[x] Core Connectors
[x] Dashplot
[x] Director (Agents MUST be configured)
> [x] Druid Analyzer
[ ] FS Analytics V2
[ ] FS Elastic
[x] Facelift UI
Expected Output:
[root@sac04:~ (ad-default)]$ accelo deploy addons
WARN: Gauntlet is running in dry run mode. Disable this to delete indices from elastic and purge data from mongo DB
INFO: Active Cluster: zeus
? Select the components you would like to install: Actions Service, Core Connectors, Dashplot, Director (Agents MUST be configured), Druid Analyzer, Facelift UI, HYDRA, LogSearch
Now, trying to logon to the AccelData registry... : SUCCESS ✓
Starting the deployment ..
Completed [========================================================================================================================================] 100.00% 20s
✓ Done, Addons deployment completed.
Check the Docker logs by running docker logs -f ad-druid-analyzer_default:
[root@sac04:~ (ad-default)]$ docker logs -f ad-druid-analyzer_default
2024-04-23 00:07:21,480 INFO supervisord started with pid 1
2024-04-23 00:07:21,480 INFO supervisord started with pid 1
2024-04-23 00:07:22,485 INFO spawned: 'druid-analyzer' with pid 7
2024-04-23 00:07:22,485 INFO spawned: 'druid-analyzer' with pid 7
2024-04-23 00:07:22,524 DEBG 'druid-analyzer' stdout output:
2024-04-23T00:07:22.523+0530 INFO app/app.go:48 Loading config from env
2024-04-23 00:07:22,524 DEBG 'druid-analyzer' stdout output:
2024-04-23T00:07:22.523+0530 INFO app/app.go:48 Loading config from env
2024-04-23 00:07:22,525 DEBG 'druid-analyzer' stdout output:
2024-04-23T00:07:22.524+0530 INFO app/app.go:114 Druid Analyser Starting!!
2024-04-23 00:07:22,525 DEBG 'druid-analyzer' stdout output:
2024-04-23T00:07:22.524+0530 INFO app/app.go:114 Druid Analyser Starting!!
2024-04-23 00:07:22,532 DEBG 'druid-analyzer' stdout output:
2024-04-23T00:07:22.532+0530 INFO app/app.go:192 Starting metrics consumers
2024-04-23 00:07:22,532 DEBG 'druid-analyzer' stdout output:
2024-04-23T00:07:22.532+0530 INFO app/app.go:192 Starting metrics consumers
2024-04-23 00:07:22,533 DEBG 'druid-analyzer' stdout output:
2024-04-23T00:07:22.532+0530 INFO app/app.go:153 Starting producers
2024-04-23T00:07:22.532+0530 INFO producer/producer.go:24 Druid Analyser Producer Starting!!
Miscellaneous
To generate the Docker yaml config for ad-druid-analyzer, run the following command:
accelo admin makeconfig ad-druid-analyzer_default
Expected Output:
[root@sac04:~ (ad-default)]$ accelo admin makeconfig ad-druid-analyzer
WARN: Gauntlet is running in dry run mode. Disable this to delete indices from elastic and purge data from mongo DB
✓ Done, Configuration file generated
IMPORTANT: Please edit/verify the file '/data01/acceldata/config/docker/addons/ad-druid-analyzer.yml'.
If the addon is already up and running, use './accelo deploy addons' to remove and recreate the addon service.
The Docker yaml file should like as shown below:
[root@sac04:~ (ad-default)]$ cat /data01/acceldata/config/docker/addons/ad-druid-analyzer.yml
version: "2"
services:
ad-druid-analyzer:
image: ad-druid-analyzer
container_name: ""
environment:
- STREAM_NAME=druid_metrics
- VMDB_URL=http://ad-vminsert:8480/insert
- NATS_URL=http://ad-events:4222
- DRUID_ANALYSER_PORT=19090
- POLL_DURATION_TIME=20
- MAX_BATCH_SIZE=1000
- FLUSH_INTERVAL=60
- LOG_LEVEL=error
volumes:
- /etc/localtime:/etc/localtime:ro
ulimits: {}
ports:
- 19090:19090
depends_on: []
opts: {}
restart: ""
extra_hosts: []
network_alias: []
label: Druid Analyzer
View Druid on Pulse UI
To view the Druid dashboard on the Pulse UI, perform the following:
Select Druid while generating the license file for the required version of Pulse:
Place the license file in the correct location:
Restart the ad-graphql service:
accelo restart ad-graphql
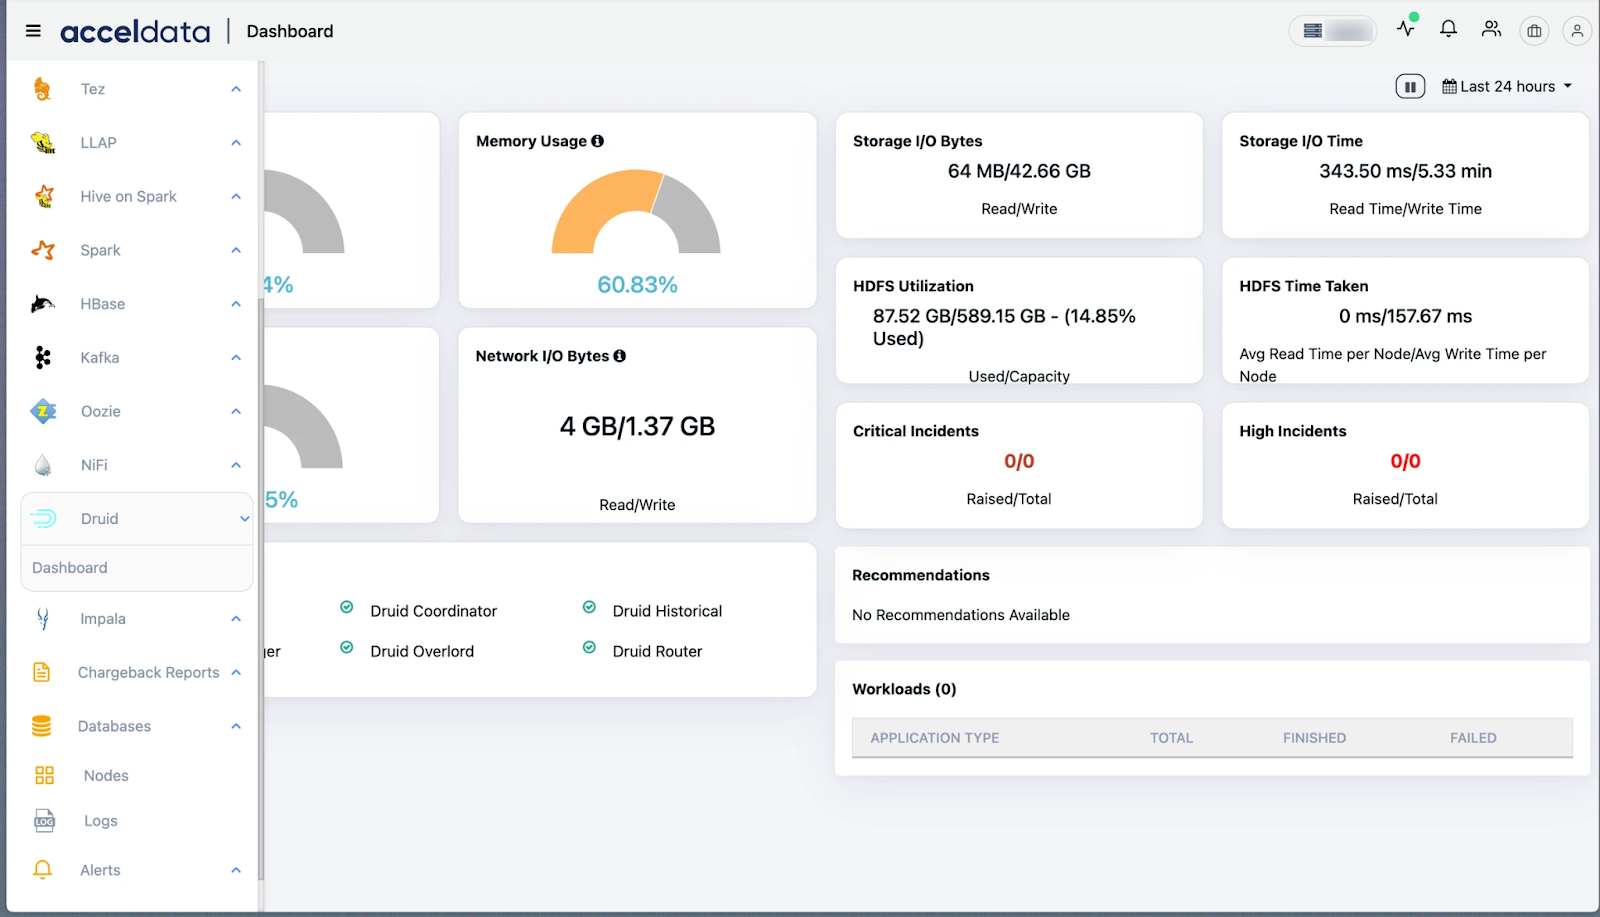
Login to the Pulse UI and navigate to the left menu bar to see the Druid Dashboard option.
Druid Dashboard
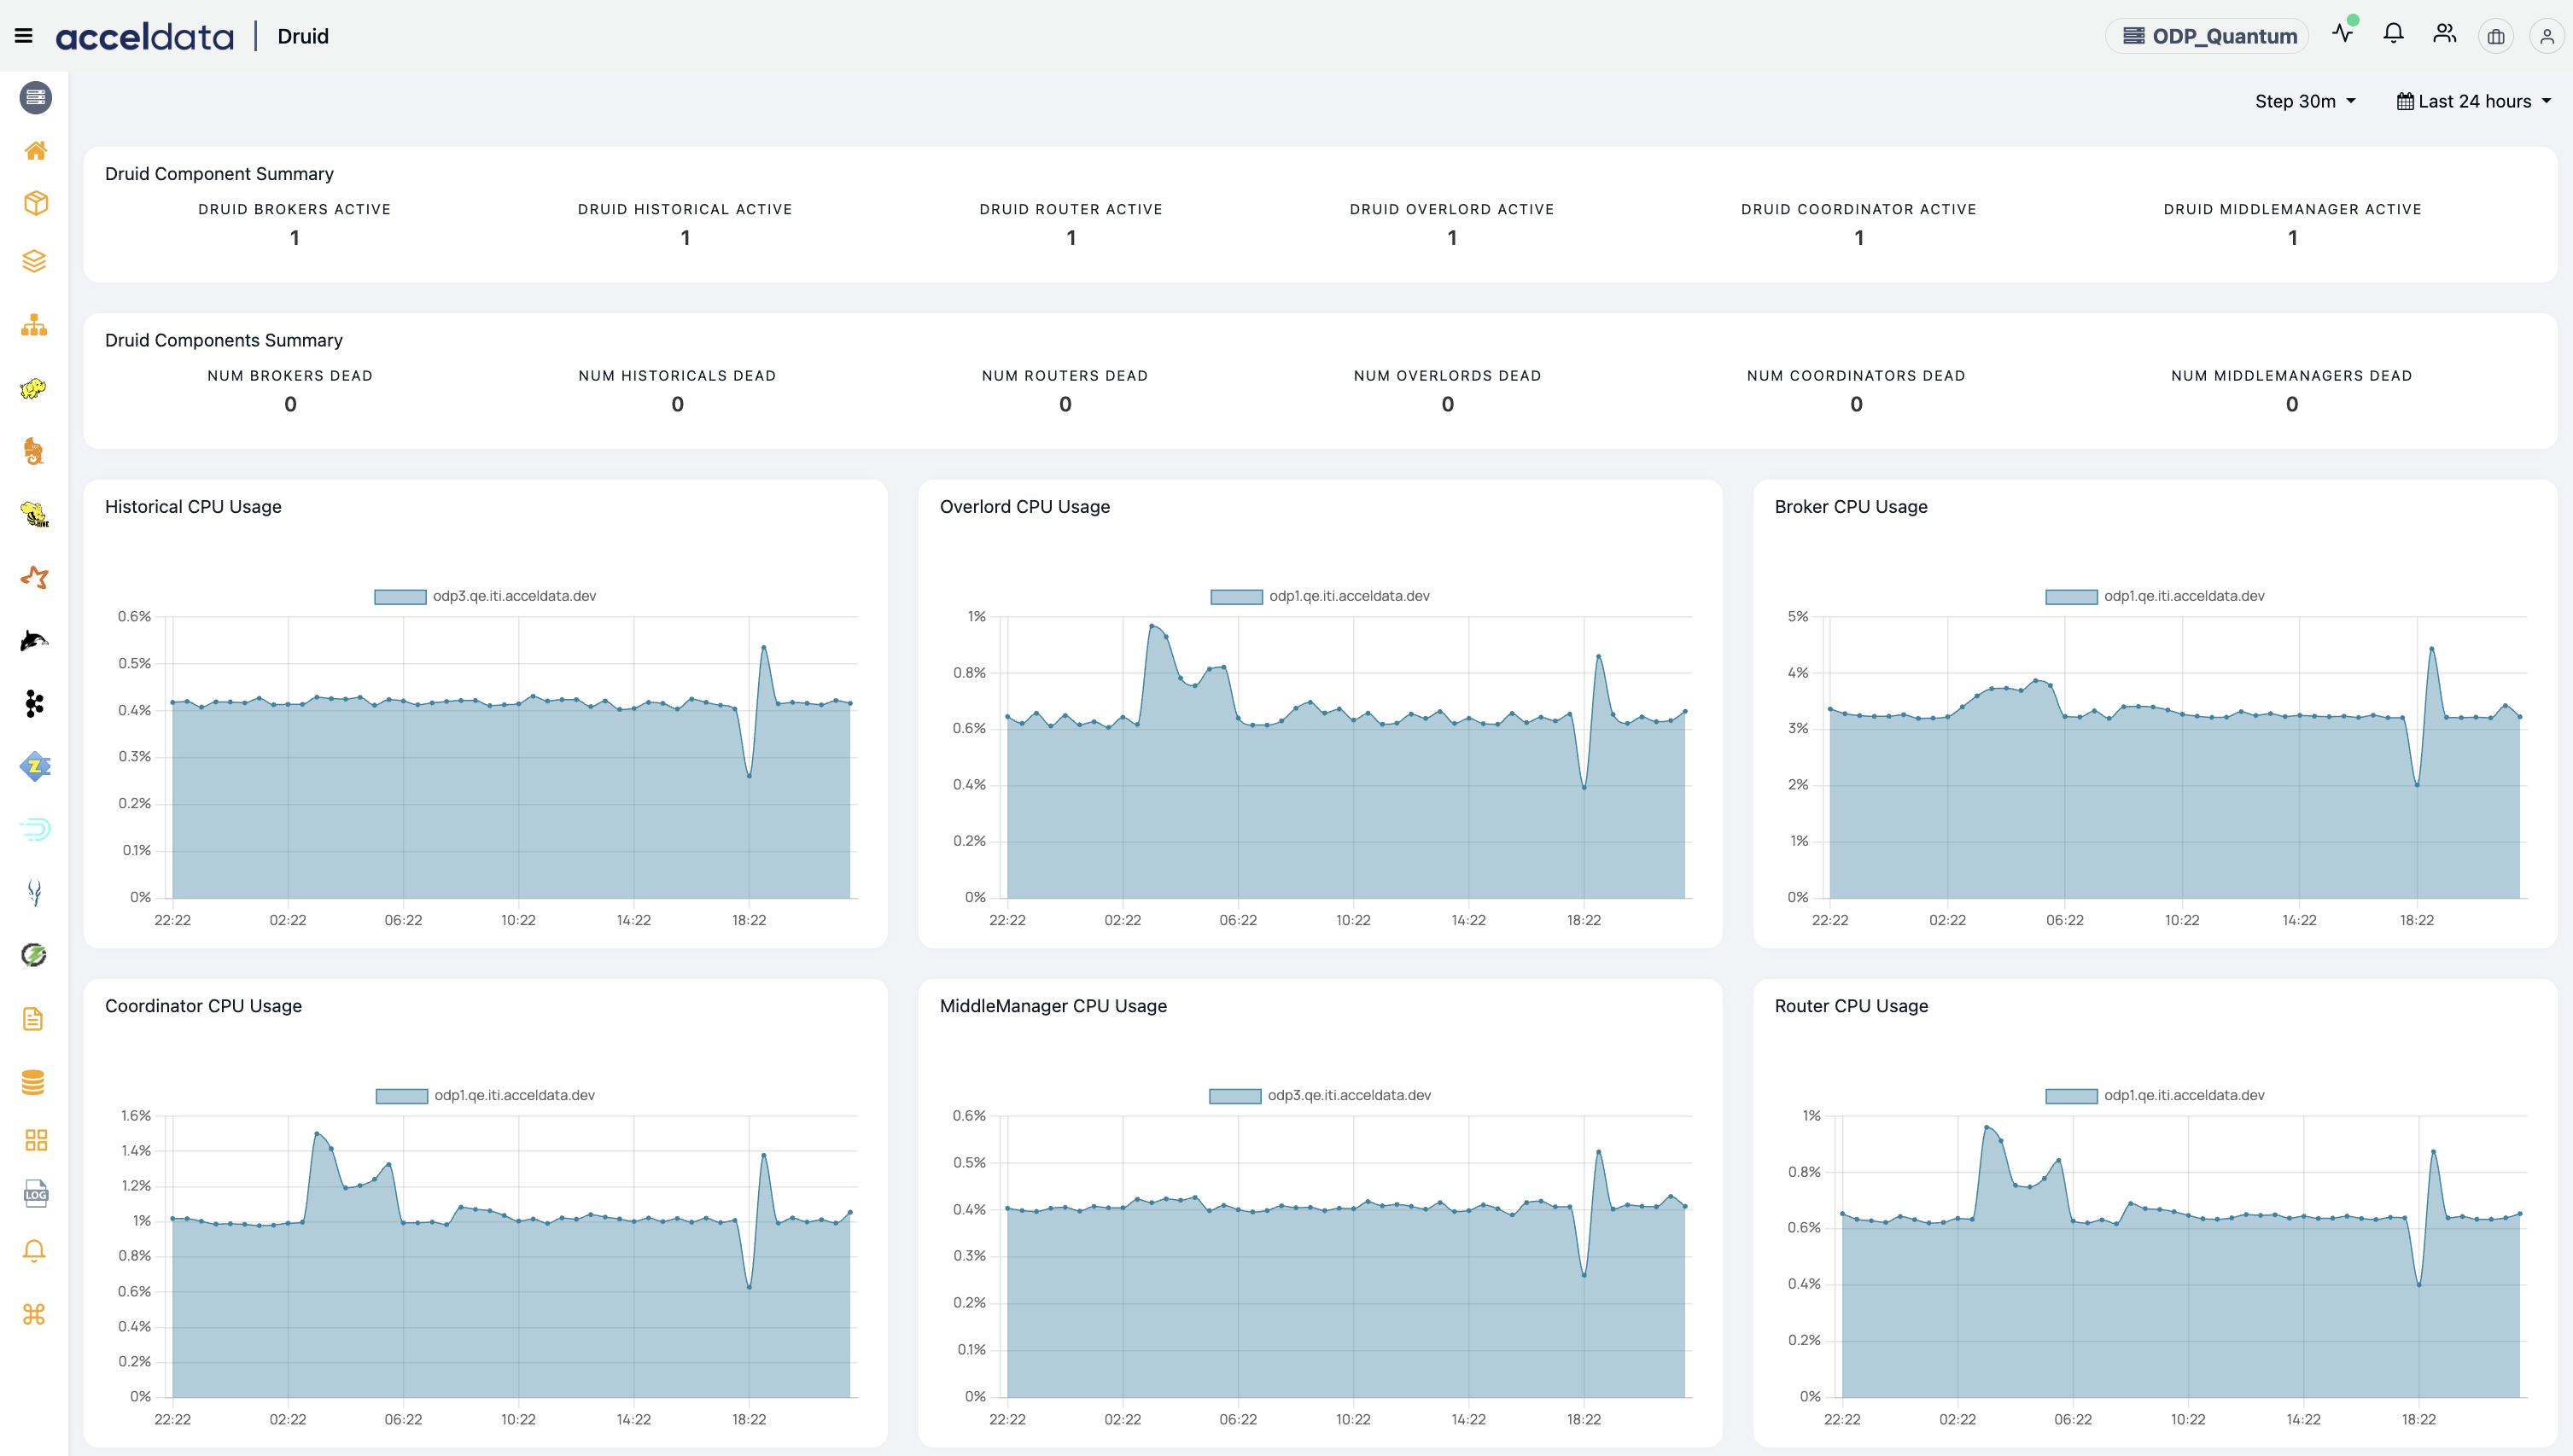
The following charts are displayed in the Druid Dashboard:
Chart Name | Description |
|---|
Druid Component Summary (Active) | Shows the summary of all active Druid components (e.g., Brokers, Historicals, Router, Overlord). |
Druid Component Summary (Dead) | Shows the summary of all dead Druid components (e.g., Brokers, Historicals, Router, Overlord). |
Historical CPU Usage | Displays the CPU usage for the Historical node over time. |
Overlord CPU Usage | Displays the CPU usage for the Overlord node over time. |
Broker CPU Usage | Displays the CPU usage for the Broker node over time. |
Coordinator CPU Usage | Displays the CPU usage for the Coordinator node over time. |
MiddleManager CPU Usage | Displays the CPU usage for the MiddleManager node over time. |
Router CPU Usage | Displays the CPU usage for the Router node over time. |
Average Druid JVM Heap Memory | Shows the average JVM heap memory usage across different Druid services (e.g., Broker, Historical). |
Druid Connections Growth Percent | Displays the growth percentage of connections across various Druid components. |
Open Connections Count | Shows the count of open connections across different Druid services over time. |
Disk I/O Size | Shows the disk input/output size across various Druid components (e.g., Broker, Historical). |
Disk I/O Component | Displays the disk input/output operations for different Druid components (e.g., Router, Coordinator). |
Druid Endpoint Alerts
To enable Druid Endpoint alerts, perform the following:
Navigate to the left menu and click Alerts.
Filter the Alert type as Druid. The list of Druid alerts are displayed.
Select the checkboxes for the endpoints that you would like to enable the alert > Click the Action for Selected Alerts button > Enable Alerts option from the drop-down list.
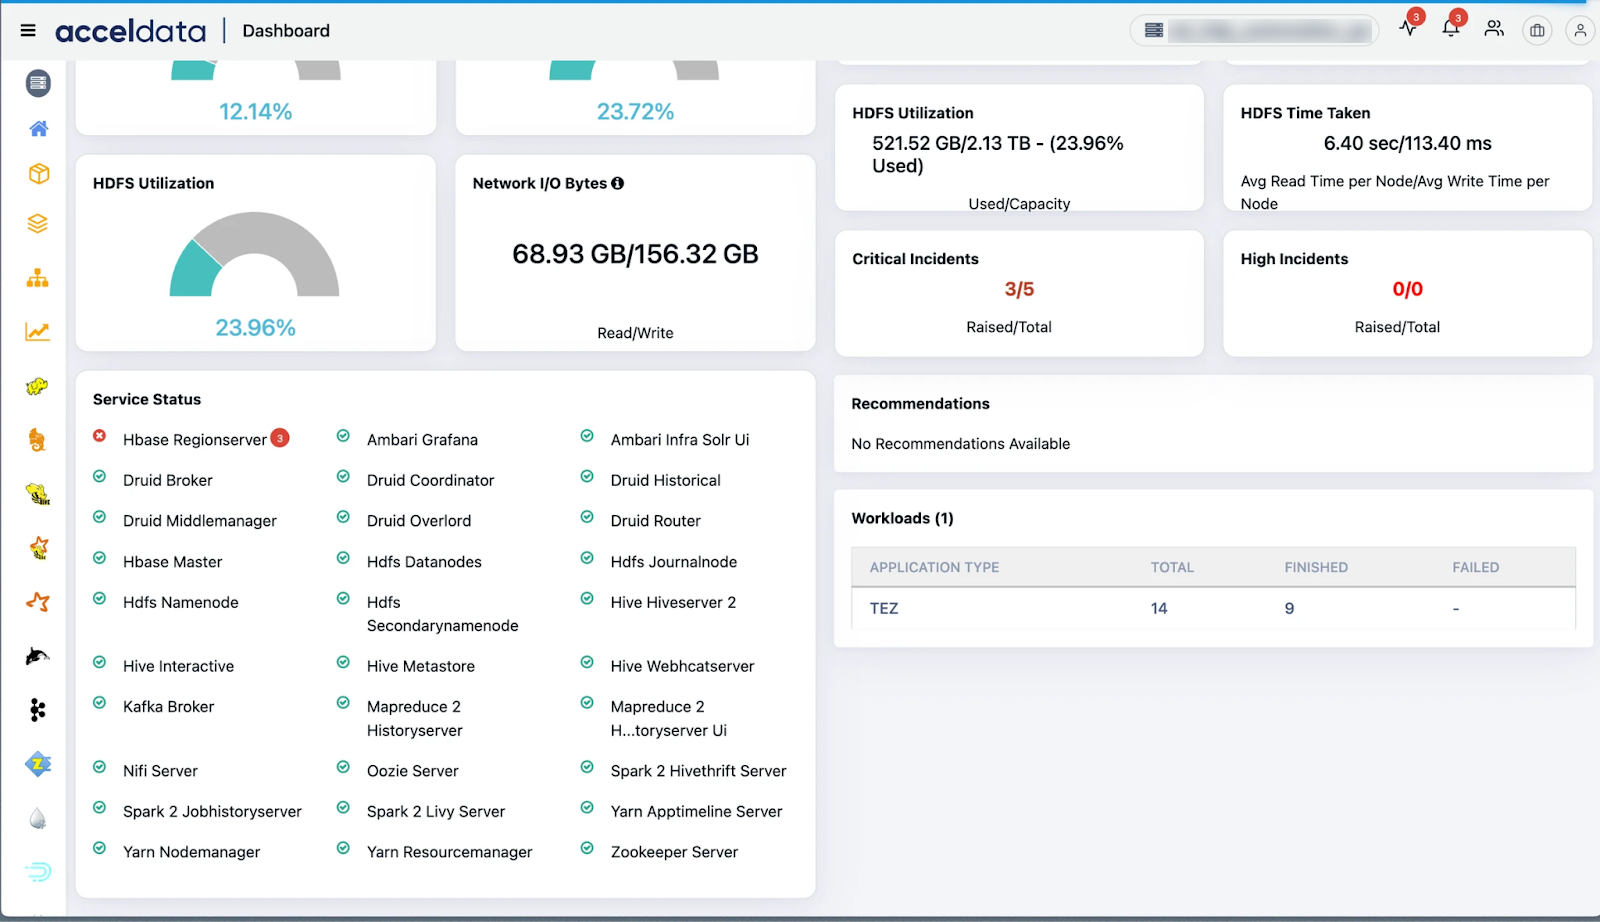
On enabling the alerts, the alerts are displayed in the Service Status section of the Dashboard page.