
Dashboard
Impala is a massively parallel process (MVP) SQL query execution engine that runs on the Hadoop platform. Pulse provides you with separate windows to view metrics and gain insights on Impala queries, tables, and daemons. Pulse also provides you with a dashboard that displays summary panels, Sankey diagrams with various metrics, and charts that display information about queries based on other criteria such as execution time.
Click Impala --> Dashboard in the left pane to access the Impala dashboard.
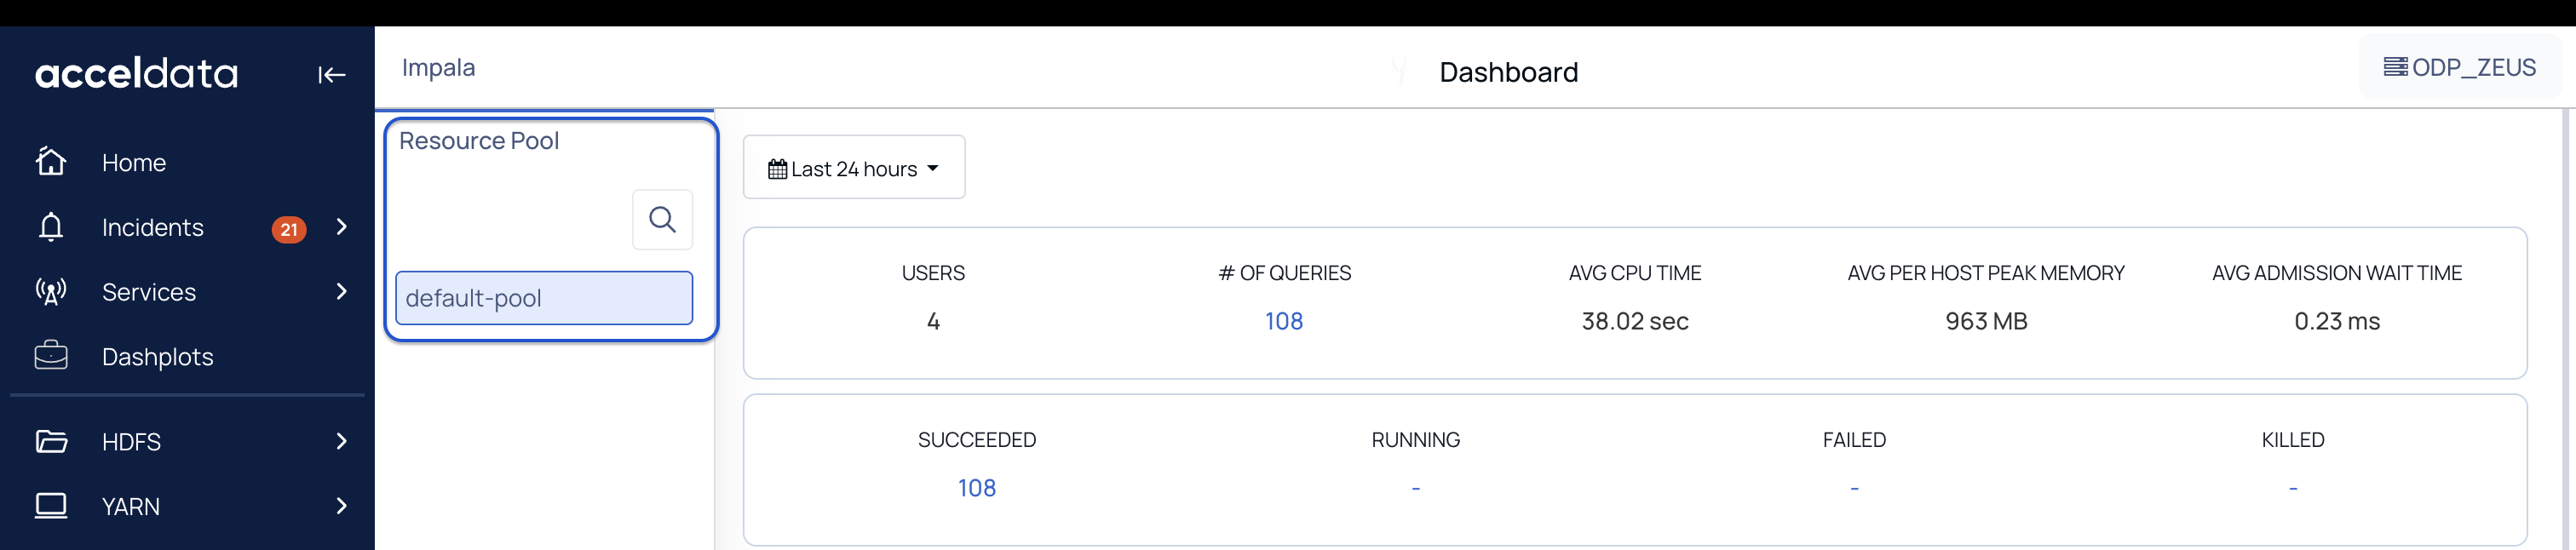
Note The default time range is Last 24 hrs. To change the time range, click the down arrow in the time selection menu.
Summary Panel
The summary tiles display several aggregated values. You can click the number on each field to view detailed information about that metric.
Metric Name | Description |
|---|---|
Users | The total number of users. To view Impala Query Details, click on the number. |
# of Queries | The number of queries being run during the selected timeframe. To view Impala Query Details, click on the number. |
Avg CPU Time | The average of CPU time across all queries. |
Avg per Host Peak Memory | The average peak memory usage per host. |
Avg Admission Wait Time | The average time elapsed from submission for admission to completion of the admission. |
Succeeded | The number of queries executed successfully. To view Impala Query Details, click on the number. |
Running | The number of queries that are in progress. To view Impala Query Details, click on the number. |
Failed | The number of queries that failed to execute. To view Impala Query Details, click on the number. |
Killed | The number of queries that were killed. To view Impala Query Details, click on the number. |
Context Metric Distributions
The Context Metric distributions panel displays the summary of jobs as a Sankey diagram. By default, the chart displays the distribution by Duration.
You can choose to display the distribution by the following metrics:
Metric Name | Description |
|---|---|
Duration | The time taken by the query. |
Threads Total Time | The sum of thread CPU time, storage wait, and network wait times used by all threads of the query. |
Thread CPU Time | The sum of the CPU time used by all threads of the query. |
Per Node Peak Mem Usage | The peak memory usage per node. |
HDFS Aggr Read Memory | The sum of HDFS bytes read from memory by the query. |
Impala Configuration Properties Summary Panel
The following table provides description of the details displayed in the Impala configuration properties summary panel:
Metric | Description |
|---|---|
Max Memory | The maximum memory allocated for a particular resource pool. Maximum amount of aggregate memory available across the cluster to all queries executing in this pool. |
Max Running Queries, | The maximum number of running queries allowed for a particular resource pool. Maximum number of concurrently running queries in this pool. |
Max Queued Queries | The maximum number of queries allowed to wait in the queue for a particular resource pool.(Maximum number of queries that can be queued in this pool. |
Queued Timeout | The amount of time, in milliseconds, that a query waits in the admission control queue for this pool before being canceled. |
Minimum Query Memory Limit | The minimum amount of aggregate memory allocated to all queries executing in a particular pool. minimum per-host memory limit that will be chosen by Impala Admission control for queries in this resource pool |
Maximum Query Memory Limit, | The maximum amount of aggregate memory allocated to all queries executing in a particular pool. maximum per-host memory limit that will be chosen by Impala Admission control for queries in this resource pool |
Clamp Memory Limit Query Option | By specifying the Clamp Memory Limit Query Option query parameter, a user can overrule Impala's decision on the memory limit. If the query parameter is set FALSE, then the memory limit will be overridden by the required memory by the pool. If the query parameter is set TRUE, the memory limit is bound by the Minimum Query Memory Limit and the Maximum Query Memory Limit. |
Other Impala Charts
The following charts are also displayed on the Impala Dashboard.
Chart Name | Description |
|---|---|
Query execution count | The number of queries executed on the overall Impala Cluster. |
Average query time | Displays average query execution time and total query execution time of queries executed on the overall Impala Cluster. |
Top 20 Users (by query) | The top 20 users that ran the highest number of queries within the selected timeframe. By default, you can see the top 20 users for the last 24 hours |
Top 20 Tables (by query) | The top 20 tables that were accessed within the selected timeframe. By default, you can see the top 20 tables for the last 24 hours |
Queries Chart | The chart displays the following metrics for a particular pool: Total Timed Out: The total number of queries timed out in the queue for a particular pool. Total Rejected: The total number of queries in the queue that were rejected for a particular pool. Total Admitted: The total number of queries admitted into the queue for a particular pool. |
Avg Wait Time in Queue Chart | The average waiting time of the queries in the queue for a particular pool. |
Resource Pools
You can view data, specific to a resource pool. To view data on the dashboard for the particular pool, perform the following:
Click to view the list of resource pools. Click to hide the pool.
Click on the name of the pool. The data corresponding to the selected pool is displayed in the dashboard.
(Optional) You can search for the name of the pool by using the search box.
Impala Metrics
You can use the following Impala coordinator metrics to create dashboards and alerts.
Metric | Description |
|---|---|
impala_thrift_server_beeswax_frontend_timedout_cnxn_requests | The number of Beeswax API connection requests to this Impala Daemon has been timed out and waiting to be set up. |
impala_thrift_server_beeswax_frontend_connection_setup_queue_size | The number of Beeswax API connections to this Impala Daemon have been accepted and are waiting to be set up. |
impala_thrift_server_hiveserver2_http_frontend_connection_setup_time | The amount of time clients of HiveServer2 HTTP API spent waiting for the connection to be set up. |
impala_thrift_server_hiveserver2_http_frontend_timedout_cnxn_requests | The number of HiveServer2 HTTP API connection requests to this Impala Daemon that have been timed out waiting to be set up. |
thread_manager_running_threads | The number of running threads in this process. |
catalog_server_client_cache_total_clients | The total number of clients in the Catalog Server client cache. |
tmp_file_mgr_scratch_space_bytes_used_dir_0 | The current total spilled bytes for a single scratch directory. |
impala_thrift_server_beeswax_frontend_svc_thread_wait_time | Amount of time clients of Beeswax API spent waiting for service threads. |
catalog_server_client_cache_clients_in_use | The number of clients currently in use by the Catalog Server client cache. |
impala_thrift_server_hiveserver2_frontend_total_connections | The total number of HiveServer2 API connections made to this Impala Daemon over its lifetime. |
impala_thrift_server_hiveserver2_http_frontend_svc_thread_wait_time | The amount of time clients of HiveServer2 HTTP API spent waiting for service threads. |
kudu_client_version | A version string identifying the Kudu client. |
tzdata_path | Path to the time_zone database |
mem_tracker_process_bytes_freed_by_last_gc | The amount of memory freed by the last memory tracker garbage collection. |
thread_manager_total_threads_created | Threads created over the lifetime of the process. |
tmp_file_mgr_active_scratch_dirs_list | The set of all active scratch directories for spilling to disk. |
impala_thrift_server_beeswax_frontend_connection_setup_time | The amount of time clients of Beeswax API spent waiting for the connection to be set up. |
tmp_file_mgr_scratch_space_bytes_used_high_water_mark | The high water mark for spilled bytes across all scratch directories. |
impala_thrift_server_hiveserver2_frontend_connection_setup_time | The amount of time clients of HiveServer2 API spent waiting for the connection to be set up. |
statestore_subscriber_registration_id | The most recent registration ID for this subscriber with the statestore_ Set to 'N/A' if no registration has been completed. |
mem_tracker_process_bytes_over_limit | The amount of memory by which the process was over its memory limit the last time the memory limit was encountered. |
mem_tracker_process_limit | The process memory tracker limit. |
external_data_source_class_cache_misses | Number of cache misses in the External Data Source Class Cache. |
process_start_time | The local start time of the process. |
statestore_subscriber_statestore_client_cache_total_clients | The total number of StateStore subscriber clients in Impala Daemon's client cache. These clients are for communication from this role to the StateStore. |
impala_thrift_server_hiveserver2_http_frontend_total_connections | The total number of HiveServer2 HTTP API connections made to this Impala Daemon over its lifetime. |
request_pool_service_resolve_pool_duration_ms | Time (ms) spent resolving request pools. |
impala_thrift_server_hiveserver2_http_frontend_connection_setup_queue_size | The number of HiveServer2 HTTP API connections to this Impala Daemon have been accepted and are waiting to be set up. |
tmp_file_mgr_active_scratch_dirs | The number of active scratch directories for spilling to disk |
tmp_file_mgr_scratch_space_bytes_used | The current total spilled bytes across all scratch directories. |