Enable xObserve integration for supported applications to collect observability data and stream it to xObserve on the associated xCentral cluster.
When enabled, xDP deploys the required xObserve connector for the application. The connector collects metrics, logs, traces, and operational telemetry and forwards them to xObserve for monitoring and analysis.
You can enable xObserve integration during application installation or later by editing the application configuration.
Steps
In the xDP UI, go to the application that you want to monitor.
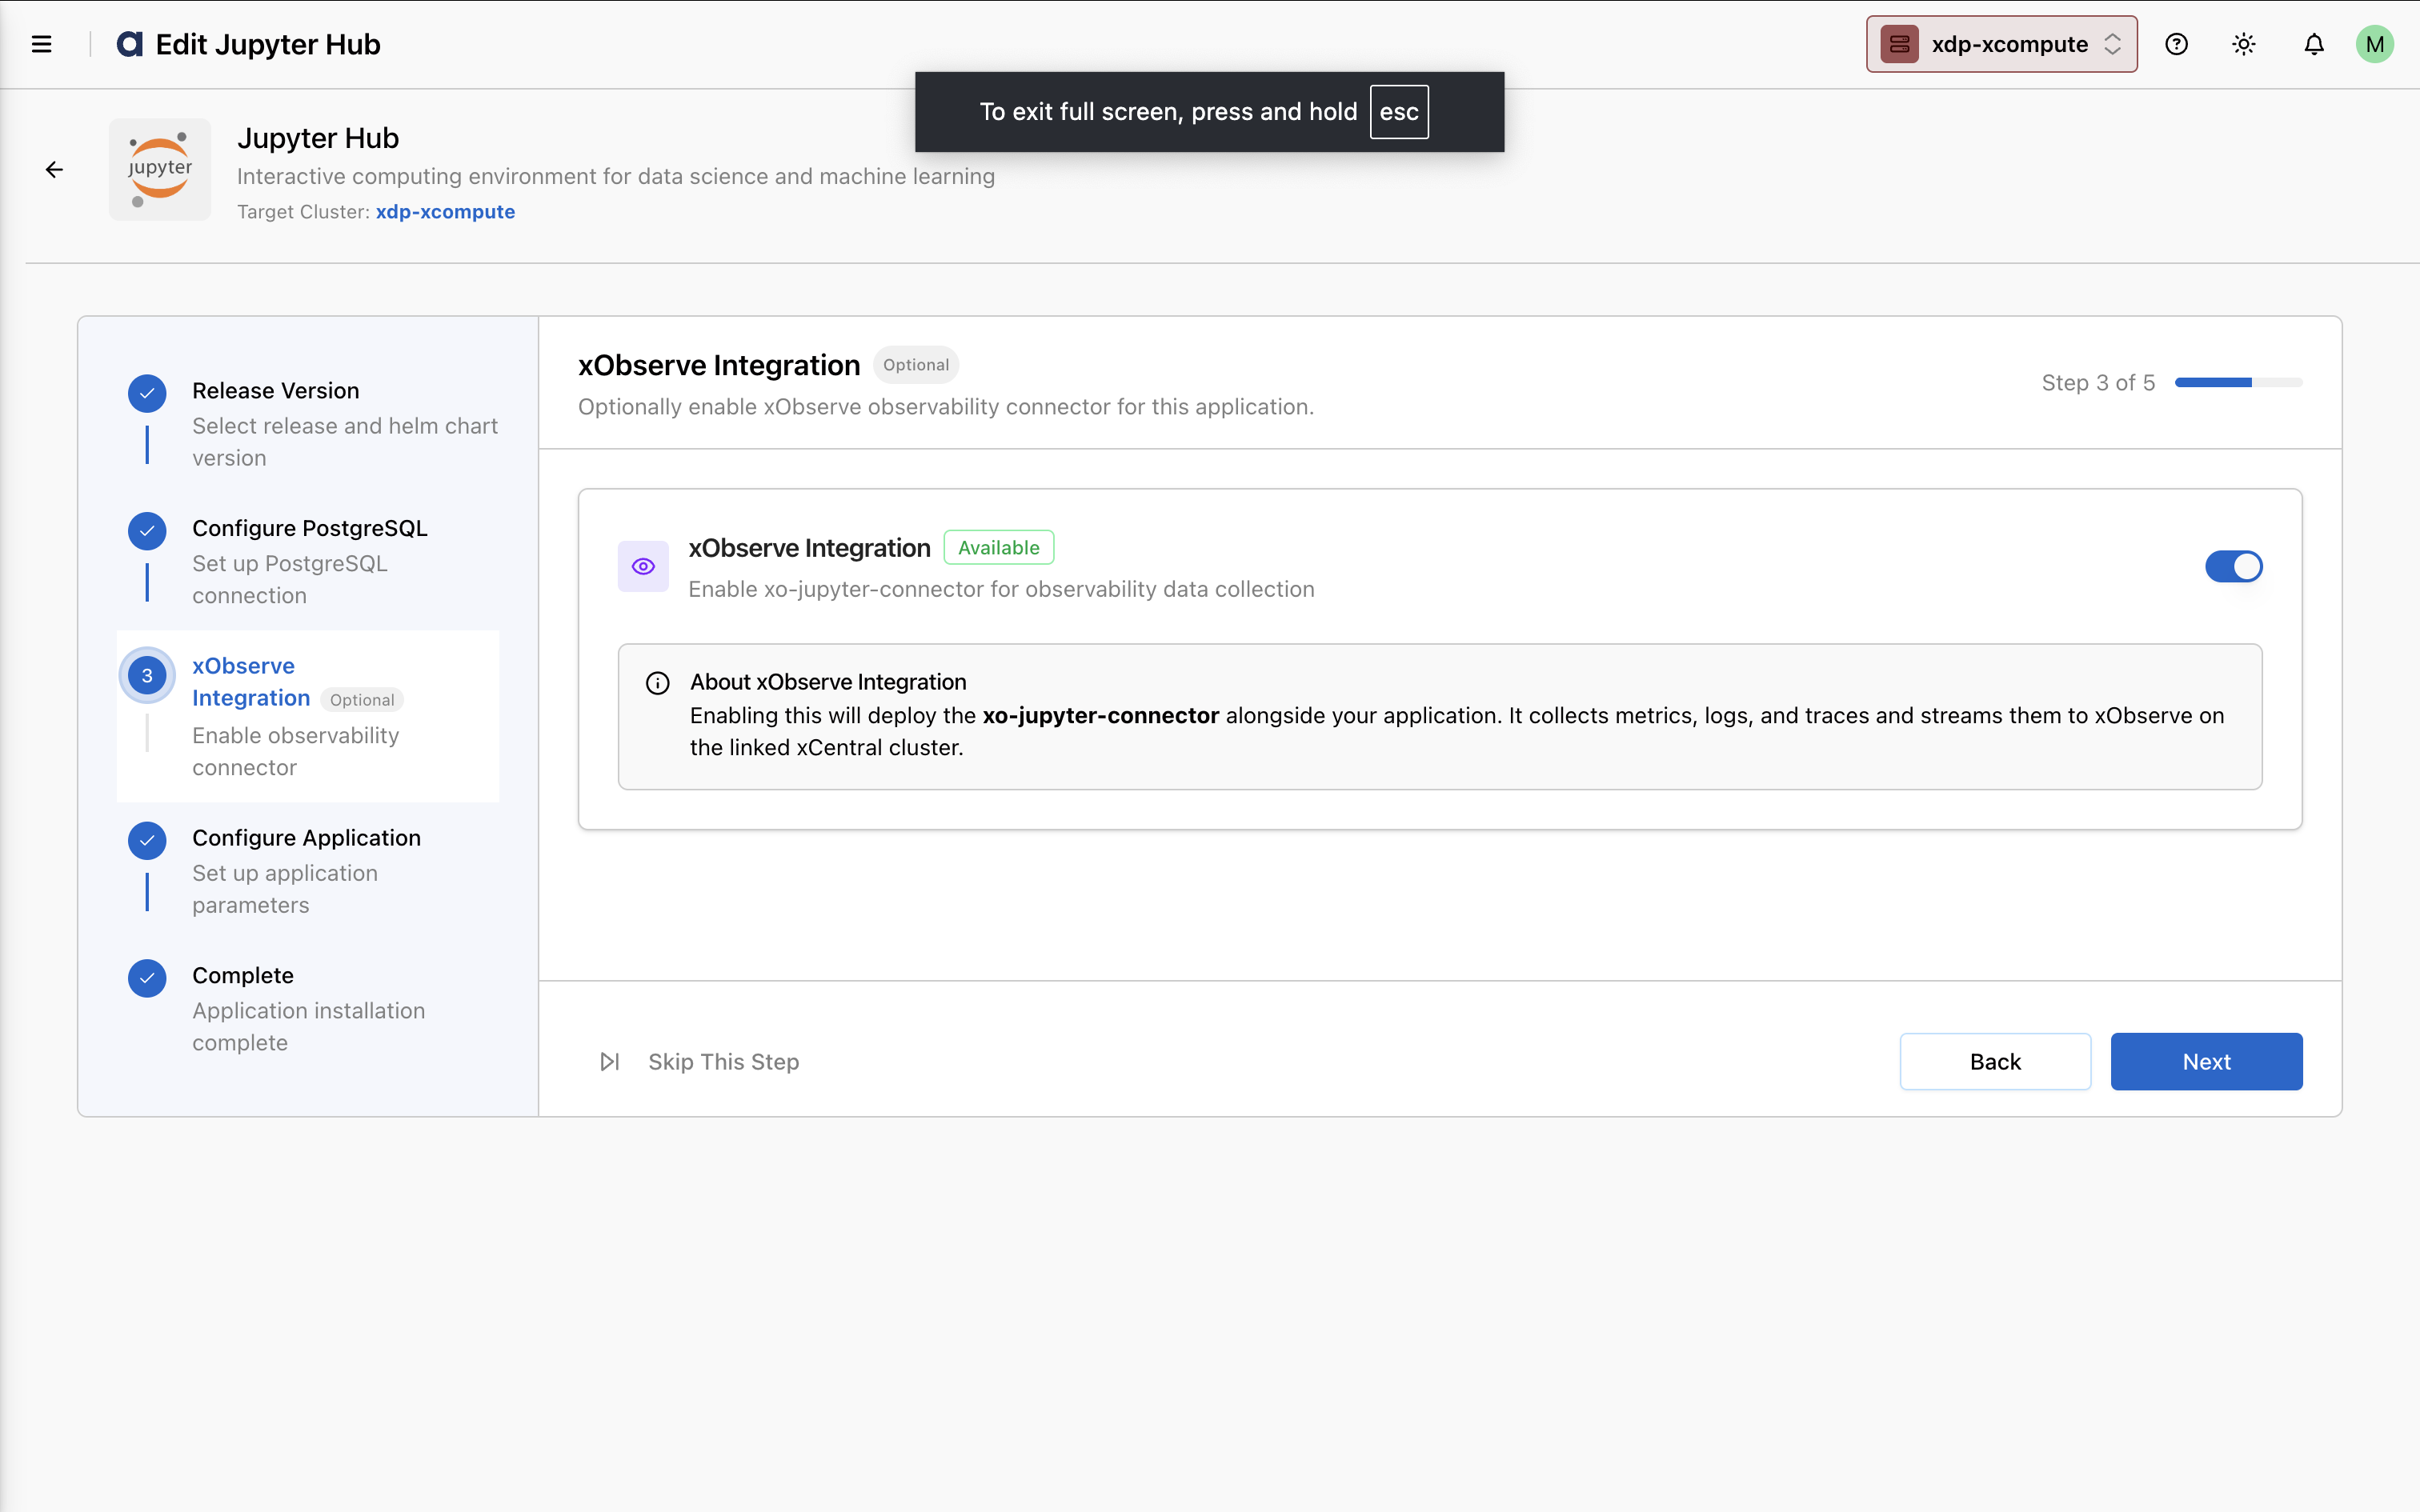
During installation or while editing an existing application, locate the xObserve Integration step.
Enable the xObserve Integration toggle. xDP deploys the required observability connector for the application and configures it to send observability data to xObserve on the linked xCentral cluster.
Complete the remaining application configuration steps and save your changes.
For example, in the JupyterHub apps, you can enable the xObserve Integration.
Verify the Configuration
After enabling xObserve integration:
Verify that the observability connector is successfully deployed alongside the application.
Open the xObserve UI.
Confirm that application metrics, logs, traces, and health information are being collected and displayed.
Next Steps
After enabling observability for an application, you can:
Monitor application health and performance.
Analyze application logs and traces.
Track resource utilization and operational metrics.
Configure alerts and dashboards.
Use xObserve Sense AI-powered diagnostics to investigate issues and identify performance bottlenecks.