User Guide
Pulse 4.1.x
Get Started
Architecture
Core Concepts
Monitor and Analyze
Manage Alerts and Actions
Optimize Resources
Generate Reports
Manage Users and Roles
Workflows
Title
Message
Create new category
What is the title of your new category?
Edit page index title
What is the title of the page index?
Edit category
What is the new title of your category?
Edit link
What is the new title and URL of your link?
Compare Nodes Resource Usage
Summarize Page
Copy Markdown
Open in ChatGPT
Open in Claude
Connect to Cursor
Connect to VS Code
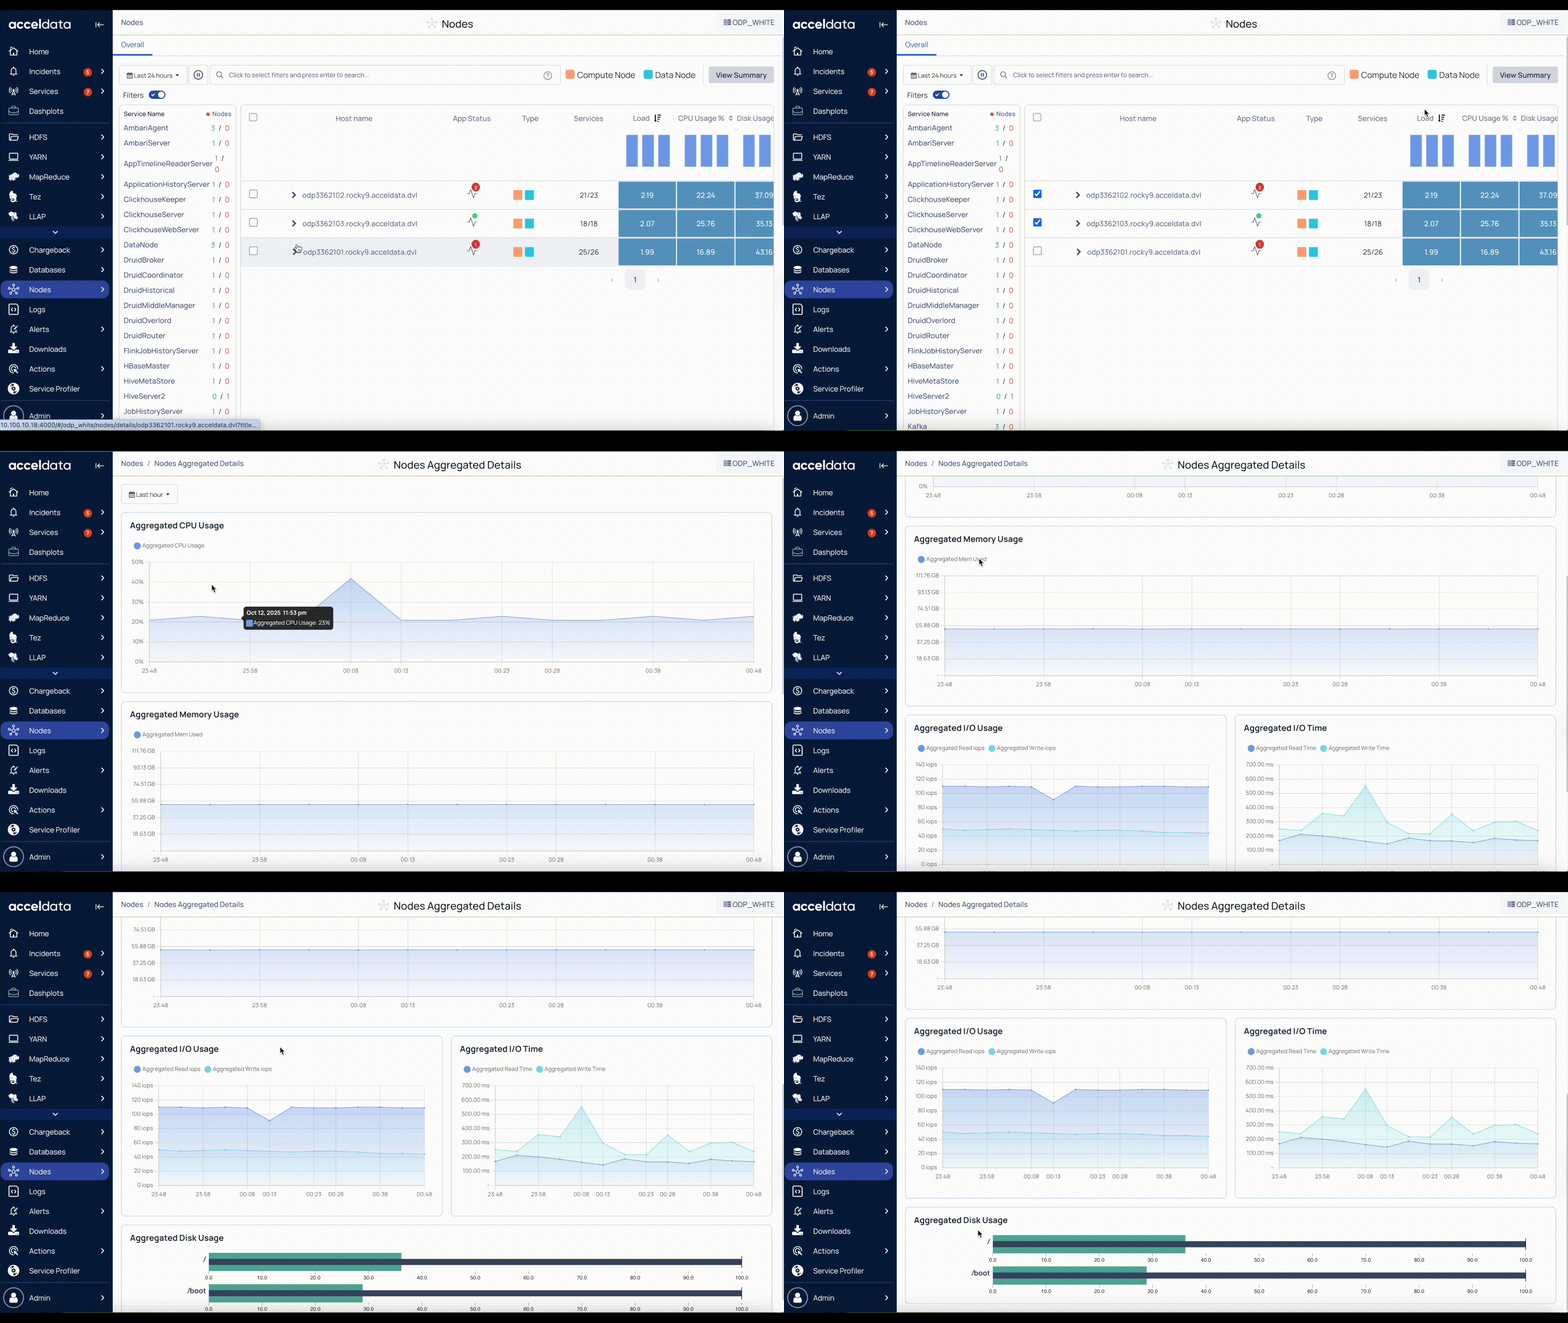
The Nodes Aggregated Details page in Pulse provides a consolidated view of resource usage across multiple selected nodes. It displays aggregated metrics for CPU, memory, disk, and input/output operations.
This enables easy comparison of node performance and helps you identify patterns, trends, and potential bottlenecks across the cluster.
Steps
In the Pulse UI, go to Nodes on the left navigation bar > Summary.
On the Nodes page, set time range and auto-refresh:
- Set time range – Select Today, Last 12 hours, Last 3 months, or choose a custom period. Then select Apply.
- Refresh status – Select Play (⏵) to refresh the page automatically every 10 seconds. Select Pause (⏸) to stop auto-refresh.
Select two or more nodes.
Click View Summary to open the Nodes Aggregated Details page.
On the Nodes Aggregated Details page, explore the detailed charts:
- Aggregated CPU Usage: Average CPU utilization across the selected nodes.
- Aggregated Memory Usage: Total memory usage across the selected nodes.
- Aggregated I/O Usage: Input/output bytes per second, including read and write IOPS.
- Aggregated I/O Time: Time spent performing I/O operations, including read and write time (ms).
- Aggregated Disk Usage: Total disk usage for boot drives and mounted storage, shown as a percentage for each partition.

Type to search, ESC to discard
Type to search, ESC to discard
Type to search, ESC to discard
Last updated on
Was this page helpful?
Next to read:
Analyze YARN Workloads or ApplicationsFor additional help, contact www.acceldata.force.com OR call our service desk +1 844 9433282
Copyright © 2026
Discard Changes
Do you want to discard your current changes and overwrite with the template?
Archive Synced Block
Message
Create new Template
What is this template's title?
Delete Template
Message