The LLAP Query Details page contains the following panels.
Summary
Query Trends
Recommendations
Query
YARN Diagnostics
MapReduce Stats
Query Execution Metrics
Query Plan and DAG
The summary panel displays the following information.
Field Name | Description |
|---|---|
User | The name of the user that executed the job. |
State | The state of the job that can be one of the following: Created, Initialized, Compiled, Running, Finished, Exception, or Unknown. |
Duration | The duration of the query execution. |
Start Time | The time at which the query execution started. |
End Time | The time at which the query execution ended. |
# of Vertices | The number of vertices. |
HDFS Data Read | The amount of HDFS data read. |
HDFS Written | The amount of HDFS data written to an output file format. |
Application ID | The ID of the application. |
Query Trends
The Query Trends panel displays a chart showing the pattern of jobs running at a particular time, based on the following factors.
Metric | Description |
|---|---|
Elapsed Time | The time taken to run the jobs at a particular time. |
VCores | The number of VCores consumed to execute the query within a timeframe. |
Memory | The amount of memory used to execute the query within a timeframe. |
Comparing Runs
Click Compare Runs to compare different runs of the query. Select the runs that you want to compare. You can choose from upto 10 previous runs of the query. The metrics that are different are highlighted and displayed at the very top of the comparison result.
Query
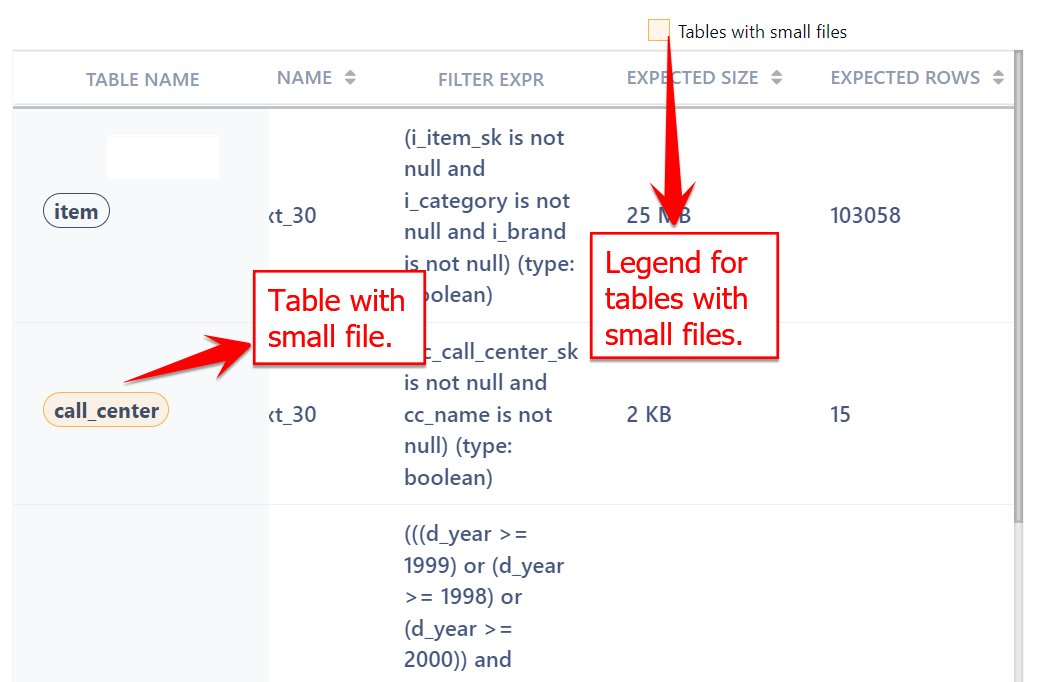
The Query panel displays the query along with the Join details and the following details of table(s) used in the query.
Column | Description |
|---|---|
Table Name | The table used in the query. |
Filter expression | The expression used in query filtering. |
Total Rows | The total number of rows in the table. |
Output Rows | The number of rows returned on executing the query. |
Tables with Small Files
If any of the table accessed by the query has small files attached to it, you can see those table names with an yellow border. The legend at the top of the Query table indicates the same.
YARN Diagnostics
This panel displays the following diagnostics metrics of YARN.
Column Name | Description |
|---|---|
Start Time | The time at which the YARN application started. |
End Time | The time at which the YARN application ended. |
State | The state of the YARN application. The state can be one of the following: Created, Initialized, Compiled, Running, Finished, Exception, or Unknown. |
Message | The diagnostic message in the YARN application. |
Message Count | The number of diagnostic messages. |
The following details are displayed for jobs in a YARN container.
Note: A row contains data for a minute of the selected duration.
Column Name | Description |
|---|---|
Time | The minute at which the job is executed. |
Preempted MB | The amount of processes that need priority to run the job. |
Preempted VCores | The number of VCores that need priority to run the job. |
Allocated MB | The amount of memory allocated to the query (in Mb). |
Avg Memory | The average a mount of memory used. |
Avg VCore | The average amount of VCores used. |
Running Containers | The number of containers running in the query. |
Queue Usage % | The amount of queue usage (in %). |
Cluster Usage % | The amount of cluster usage (in %). |
State | The state of the query using YARN application. The state can be one of the following: Created, Initialized, Compiled, Running, Finished, Exception, or Unknown. |
Message | The diagnostic message. |
Map Reduce Stats
This tile displays the statistics of processing of large data sets on a worker node. You can monitor the statistics of following processes by elapsed time.
Mappers
Reducers
These statistics can be sorted by Duration and Start Time.
Query Execution Metrics
The Query Execution Metrics panel displays the following set of metrics.
Metric Type | Metric Name | Description |
|---|---|---|
Task | Output Bytes | The amount of output bytes written to a file format while executing the query at a given time. |
Output Bytes With Overhead | The amount of additional output bytes. | |
Output Bytes Physical | The amount of output bytes written to physical storage. | |
Input Records Processed | The number of input records processed. | |
Input Split Length Bytes | The size of logical division of query records. | |
Shuffle Phase Time | The time taken to shuffle a query phase. | |
Output Records | The number of output records. | |
Additional Spills Bytes Written | The additional size of spilled records written (in bytes). | |
Spilled Records | The number of spilled records. | |
Shuffle Bytes | The number of shuffle bytes the query uses. | |
DAG Metrics | Total Launched Tasks | The number of tasks launched in DAG. |
Rack Local Tasks | The number of tasks that are local to the rack. | |
Data Local Tasks | The number of tasks that are local to the data. | |
of Killed Tasks | The number of tasks that terminated. | |
of Succeeded Tasks | The number of tasks that completed successfully. | |
Application Master Cpu Time | The time taken by the CPU in application master. | |
Application Master GC Time | The time taken by the GC in the application master. | |
Wall Clock Time | The time elapsed in completing tasks in DAG. | |
LLAP IO Metrics | Num Vector Batches | The number of vector batches for processing. |
HDFS Time | The time taken by HDFS to process LLAP queries. | |
Consumer Time | The time taken by a consumer to process LLAP queries. | |
Cache Hit Bytes | The size of cache hits (in bytes). | |
Rows Emitted | The number of rows emitted by LLAP queries. | |
Total I/O Time | The time utilized in input and output operations. | |
Metadata Cache Hit | The number of hits of metadata cache. |
Query Plan and DAG
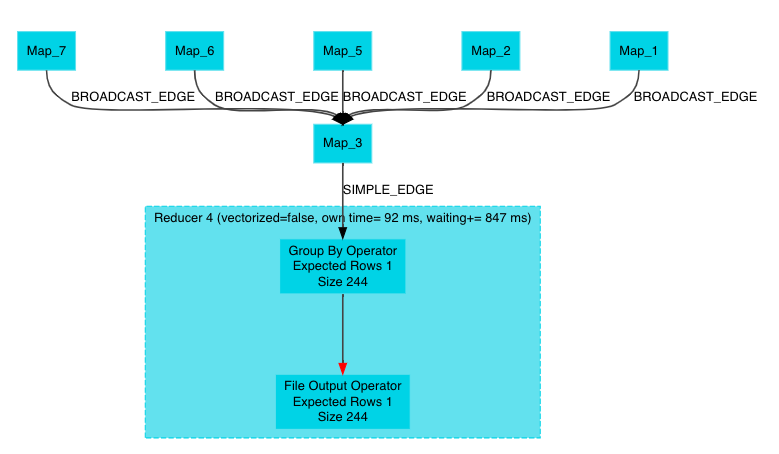
The panel displays the distribution of query logic in the form of a DAG and a physical execution plan.
Plan
Plan is a logical representation of how the Tez engine executes the query, where a query is broken into different logical plans.
DAG
The Direct Acyclic Graph (DAG) is an execution graph that displays a flow diagram of the compiled SQL queries. This graph is a work scheduling graph with finite elements connected in edges and vertices. The order of execution of the jobs in DAG is specified by the directions of the edges in the graph. The graph is acyclic as it has no loops or cycles.