User Guide
Pulse 4.1.x
Get Started
Architecture
Core Concepts
Monitor and Analyze
Core Hadoop Services
Query and Processing Services
Streaming and Messaging Services
Workflow and Orchestration Services
Data Management Services
Database and Warehouse Services
Data Flow and Serialization Services
Security and Governance Services
Manage Alerts and Actions
Optimize Resources
Generate Reports
Manage Users and Roles
Workflows
Title
Message
Create new category
What is the title of your new category?
Edit page index title
What is the title of the page index?
Edit category
What is the new title of your category?
Edit link
What is the new title and URL of your link?
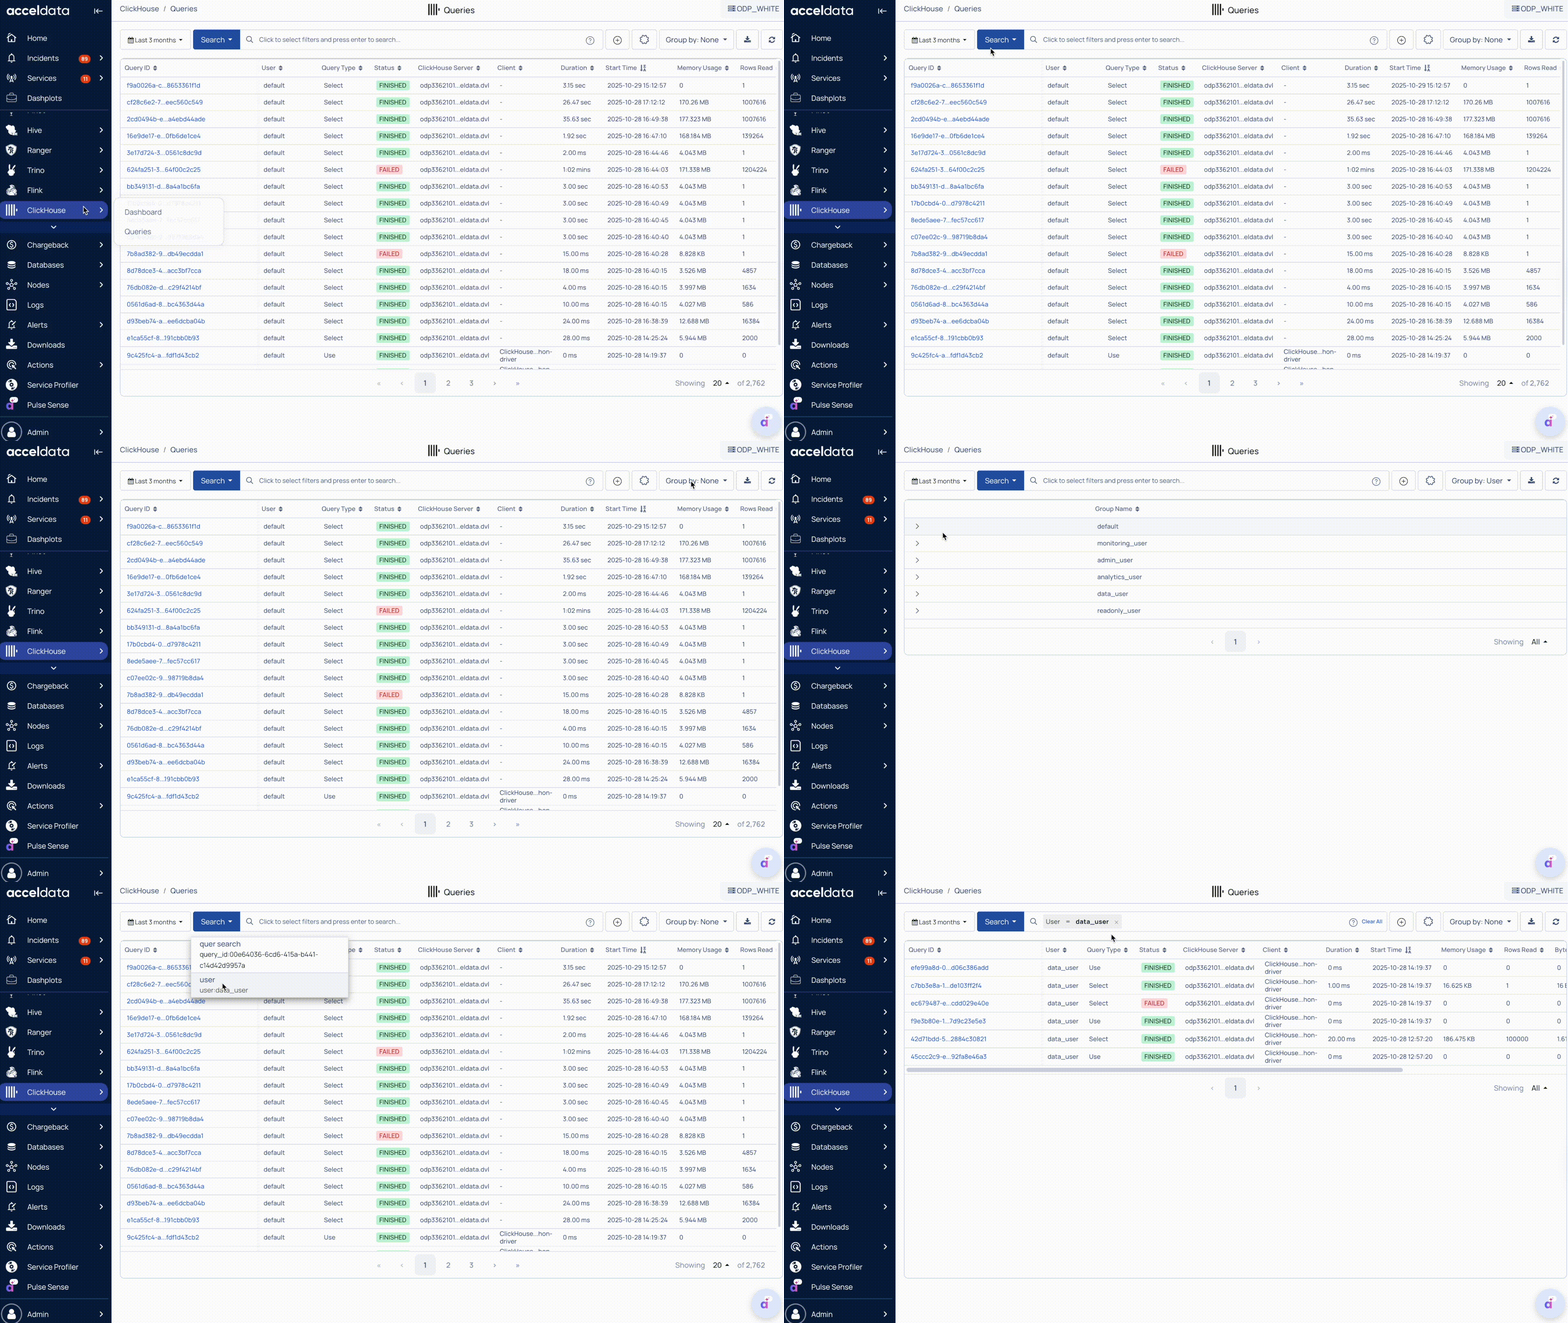
Monitor ClickHouse Queries
Summarize Page
Copy Markdown
Open in ChatGPT
Open in Claude
Connect to Cursor
Connect to VS Code
The Queries page in Pulse provides an overview of all executed ClickHouse queries, displaying their status, performance metrics, resource usage, etc.
This capability enables you to:
- Track query activity across users and nodes.
- Identify failed or long-running queries for further analysis.
- Monitor resource-intensive queries that may impact system performance.
- Drill down into specific queries by clicking a Query ID to open the Query Details view for deeper insight.
Steps
- In the Pulse UI, go to ClickHouse > Queries.
- On the Queries page, a list of executed ClickHouse queries appears.
- Set a time range and data refresh interval (for example, 10 s, 20 m, 2 h, 4 d, or 1 w) to view up-to-date query data.
Pulse displays all executed queries with their summarized metrics.

Query-Level Summary
Query Identification
- Query ID: Unique identifier for each executed query, used for tracing and debugging.
- User: The ClickHouse user account that executed the query.
- Query Type: Specifies the query type, such as SELECT, INSERT, ALTER, or DROP.
- ClickHouse Server: Identifies the ClickHouse node or host where the query was processed.
- Client: Displays the client or application that initiated the query.
Query Execution Details
- Status: Displays the current query state — for example, RUNNING, FINISHED, or FAILED.
- Duration (ms): The total time taken to complete the query, measured in milliseconds.
- Start Time: The timestamp indicating when the query execution began.
Resource Utilization
- Memory Usage: The total memory consumed during query execution. High values may indicate heavy workloads.
- Rows Read: The number of rows scanned from tables to process the query.
- Bytes Read: The total amount of data read from storage or memory.
- Result Rows: The number of rows returned by the query.
- Result Bytes: The total size of the query’s output data.
Error Handling
- Exception Code: Displays an error or exception code if the query fails, helping identify and troubleshoot issues.
Key Features
- Search: Filter and search queries by user, type, status, etc.
- Save Search: Click + to save a query filter and reuse it later. Access saved searches using the Search button.
- Group By: Group queries by User Type, User Status, User, Client, or Host for targeted analysis.
- Download: Click Download to export the list of queries for reporting or review.
Query Details
For deeper analysis of a query, click its Query ID to open the Query Details view. For details, see Analyze ClickHouse Query Details.
Type to search, ESC to discard
Type to search, ESC to discard
Type to search, ESC to discard
Last updated on
Was this page helpful?
Next to read:
Analyze ClickHouse Query DetailsFor additional help, contact www.acceldata.force.com OR call our service desk +1 844 9433282
Copyright © 2026
Discard Changes
Do you want to discard your current changes and overwrite with the template?
Archive Synced Block
Message
Create new Template
What is this template's title?
Delete Template
Message