Search
The Flink Applications page in Pulse provides an overview of all executed Flink applications, displaying their status, user, queue, and execution details in real time.
This capability enables you to:
- Track application activity across users and queues.
- Identify failed or long-running applications for further analysis.
- Monitor job duration, start and finish times, and queue-level execution trends.
- Filter and search applications to quickly locate specific jobs.
Steps
- In the Pulse UI, go to Flink > Applications.
- On the Applications page, view a list of all executed Flink applications.
- Use filters or the search bar to find applications by ID, user, name, status, etc.
- Set a time range and refresh interval (for example, 10 s, 20 m, 2 h, or 1 w) to ensure data is up to date.
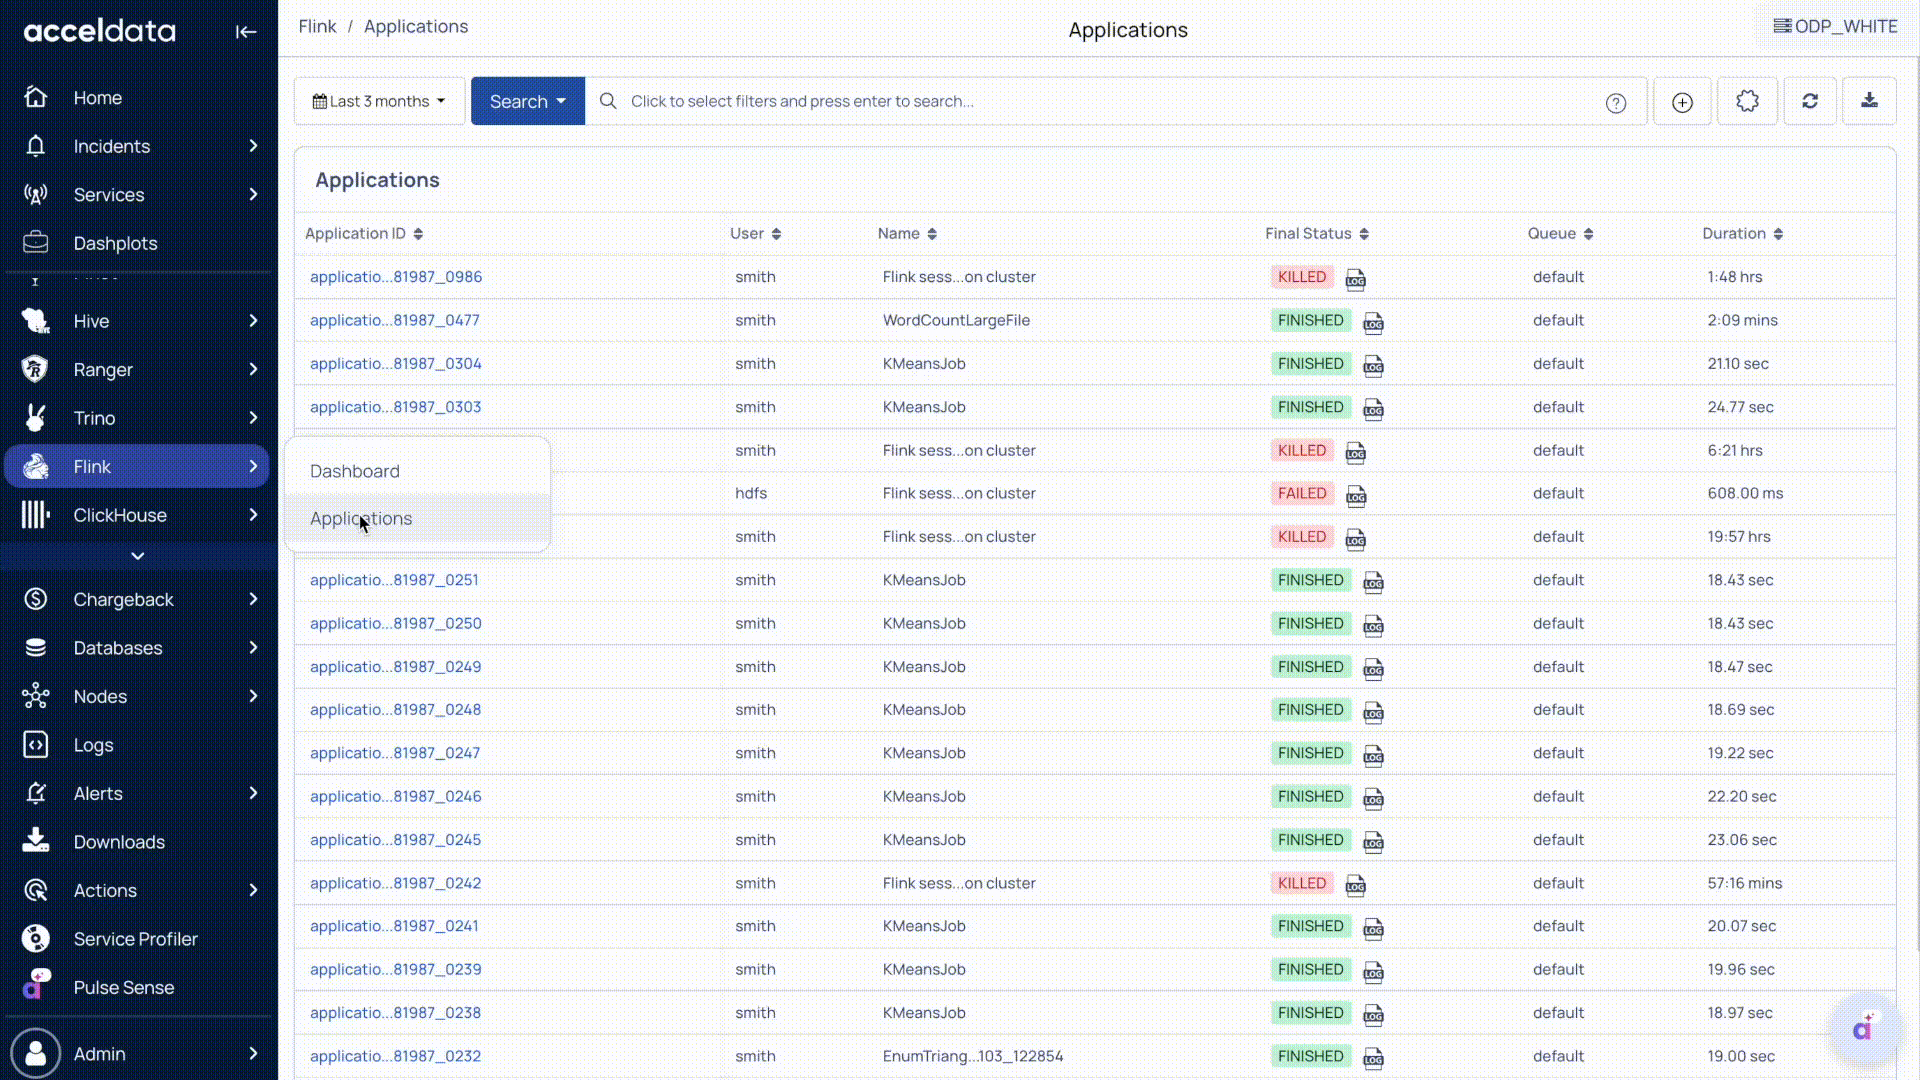
Application-Level Summary
Identification
- Application ID: Unique identifier for each Flink application.
- Name: The name of the job or application.
- User: The user who submitted the application.
Execution Details
- Queue: Indicates the queue where the application is running (for example, default).
- Final Status: Displays the current state, such as Running, Finished, Failed, or Killed.
Timing Information
- Started Time: The timestamp when the application started.
- Finished Time: The timestamp when the application finished.
- Duration: The total time taken to execute the application.
Key Features
- Search: Filter and search applications by user, type, status, etc. For details, see Search and Analyze Records.
- Save Search – Click + to save a query filter and reuse it later. Access saved searches using the Search button.
- Modify Table Columns: Select or unselect columns to add or remove columns from the table.
- Refresh: Click to refresh the page.
- Download – Click Download to export the list of applications for reporting or review.
Application Details
Click an Application ID to view more detailed job information and performance metrics. For details, see Monitor Flink Application Details.
Was this page helpful?