Title
Create new category
Edit page index title
Edit category
Edit link
Monitor Flink Application Details
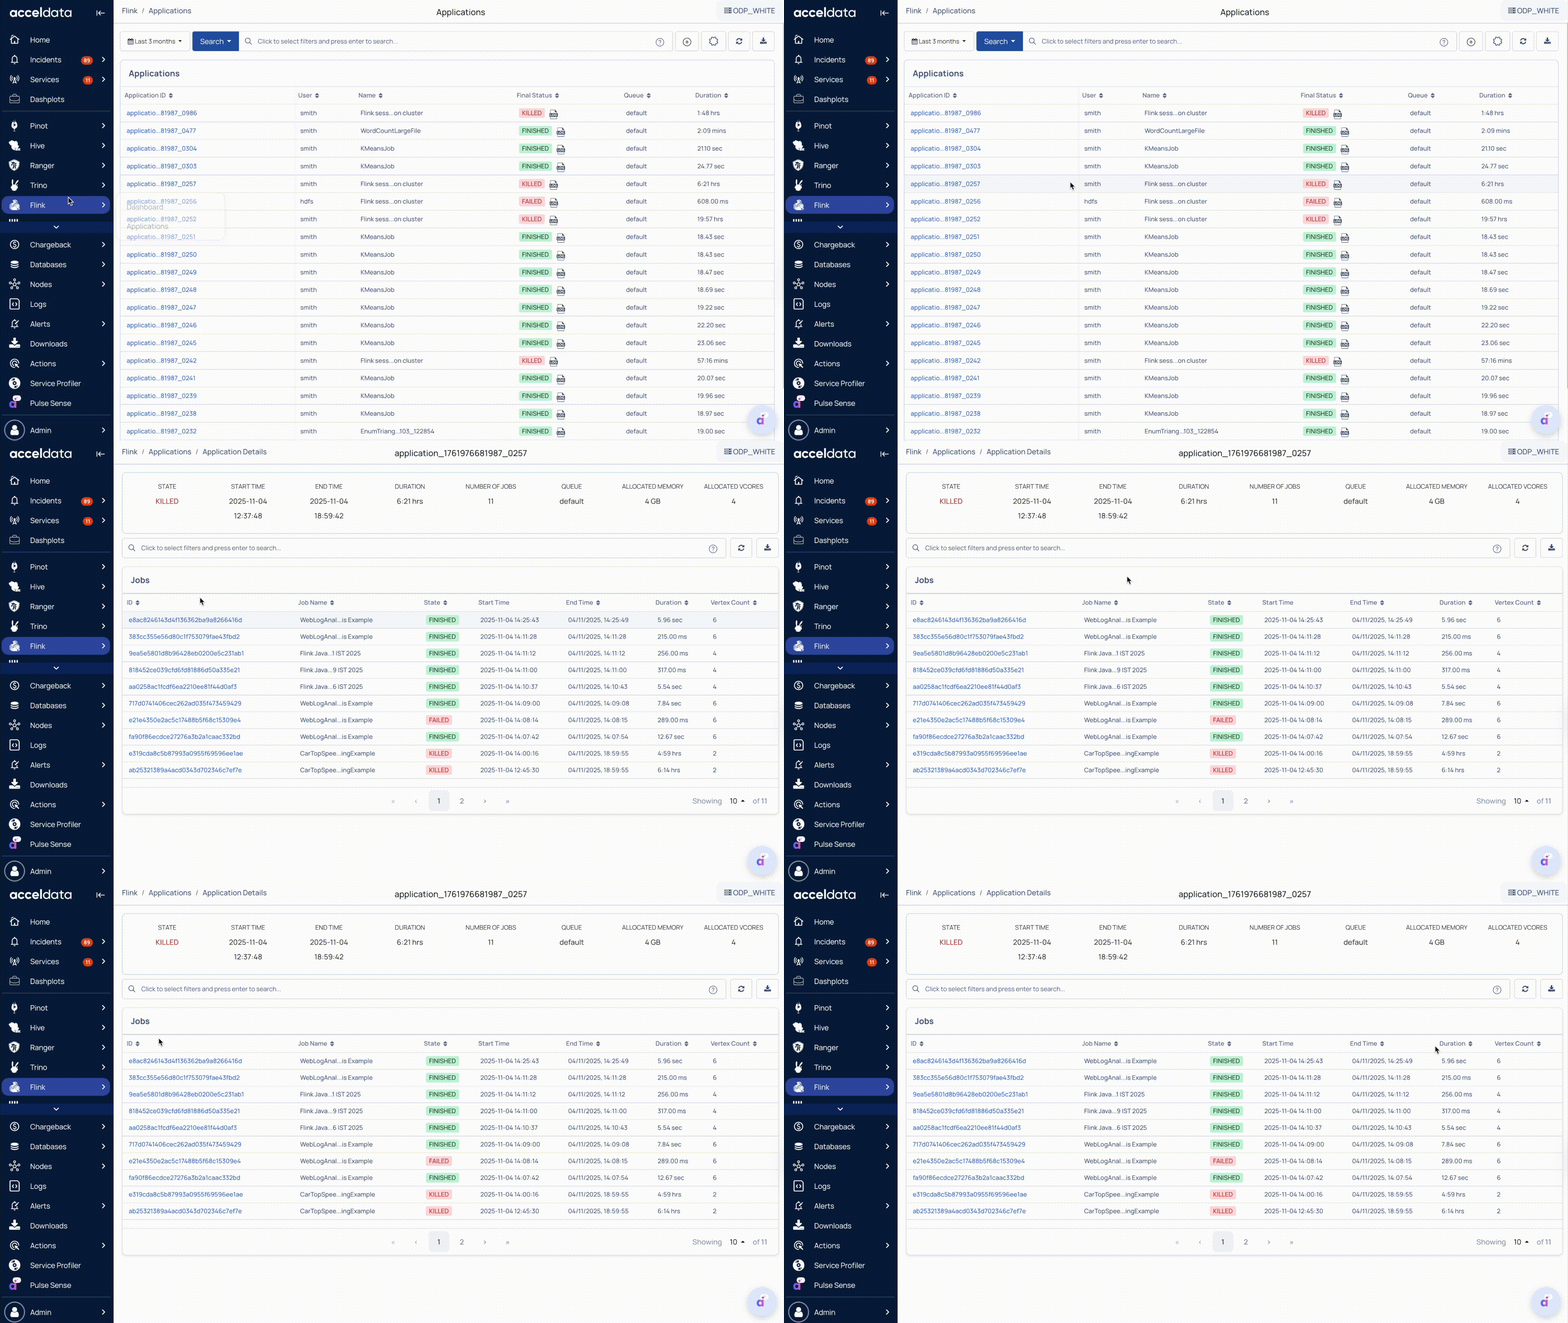
The Flink Application Details page in Pulse lists all jobs within the selected application and provides detailed information about their state, execution time, resource usage, etc
Pulse supports observability for both Flink Application Mode and Session Mode deployments.
- Application Mode (Dedicated Cluster): Each job runs in its own dedicated cluster with a unique application ID. Pulse tracks and displays detailed metrics for each job.
- Session Mode (Shared Cluster): Multiple jobs share the same cluster and application ID. Pulse provides visibility into each job’s performance, resource usage, and status within the shared environment.
This capability enables you to:
- Monitor Flink applications and their jobs in real time.
- View state, duration, and resource usage details.
- Identify failed or long-running jobs.
- Analyze performance and resource efficiency.
- Understand job complexity through the vertex count and execution details.
Steps
- In the Pulse UI, go to Flink > Applications.
- On the Applications page, view a list of all executed Flink applications.
- Use filters or the search bar to find applications by ID, user, name, status, etc.
- Set a time range and refresh interval (for example, 10 s, 20 m, 2 h, or 1 w) to ensure data is up to date.
- Click an Application ID to view more detailed job information and performance metrics.

Application Summary
The Application Summary section provides key information about the selected Flink application, including its identification details, current status, execution timeline, and access to logs.
Identification and Status
- Application ID: The unique identifier for the Flink application.
- State: The current status of the application, such as Running, Finished, Failed, or Killed.
- Number of Jobs: The total number of jobs included in the application.
- Queue: The queue where the application was submitted (for example, default).
Logs
- Select the Logs icon next to the Final Status to view the application-level logs for troubleshooting and analysis.
Execution Timeline
- Start Time: The timestamp when the application started.
- End Time: The timestamp when the application finished.
- Duration: The total time taken to complete the application.
Resource Utilization
- Memory: The Total memory used during execution.
- vCore: The CPU (vCore) utilization for the application.
Jobs Summary
The Jobs summary lists all Flink jobs associated with the selected application.
Job Overview
- Job ID: Unique identifier for each job within the application.
- Job Name: Name of the Flink job.
- State: Current job status, such as __Running or Finished.
Execution Details
- Start Time: Timestamp when the job started.
- End Time: Timestamp when the job ended.
- Duration: Total time taken to execute the job.
- Vertex Count: Number of tasks or operators in a Flink job’s execution graph.
Job Details
Click a Job ID to view more detailed job information and performance metrics. For details, see Analyze Flink Job Details.
For additional help, contact www.acceldata.force.com OR call our service desk +1 844 9433282
Copyright © 2026