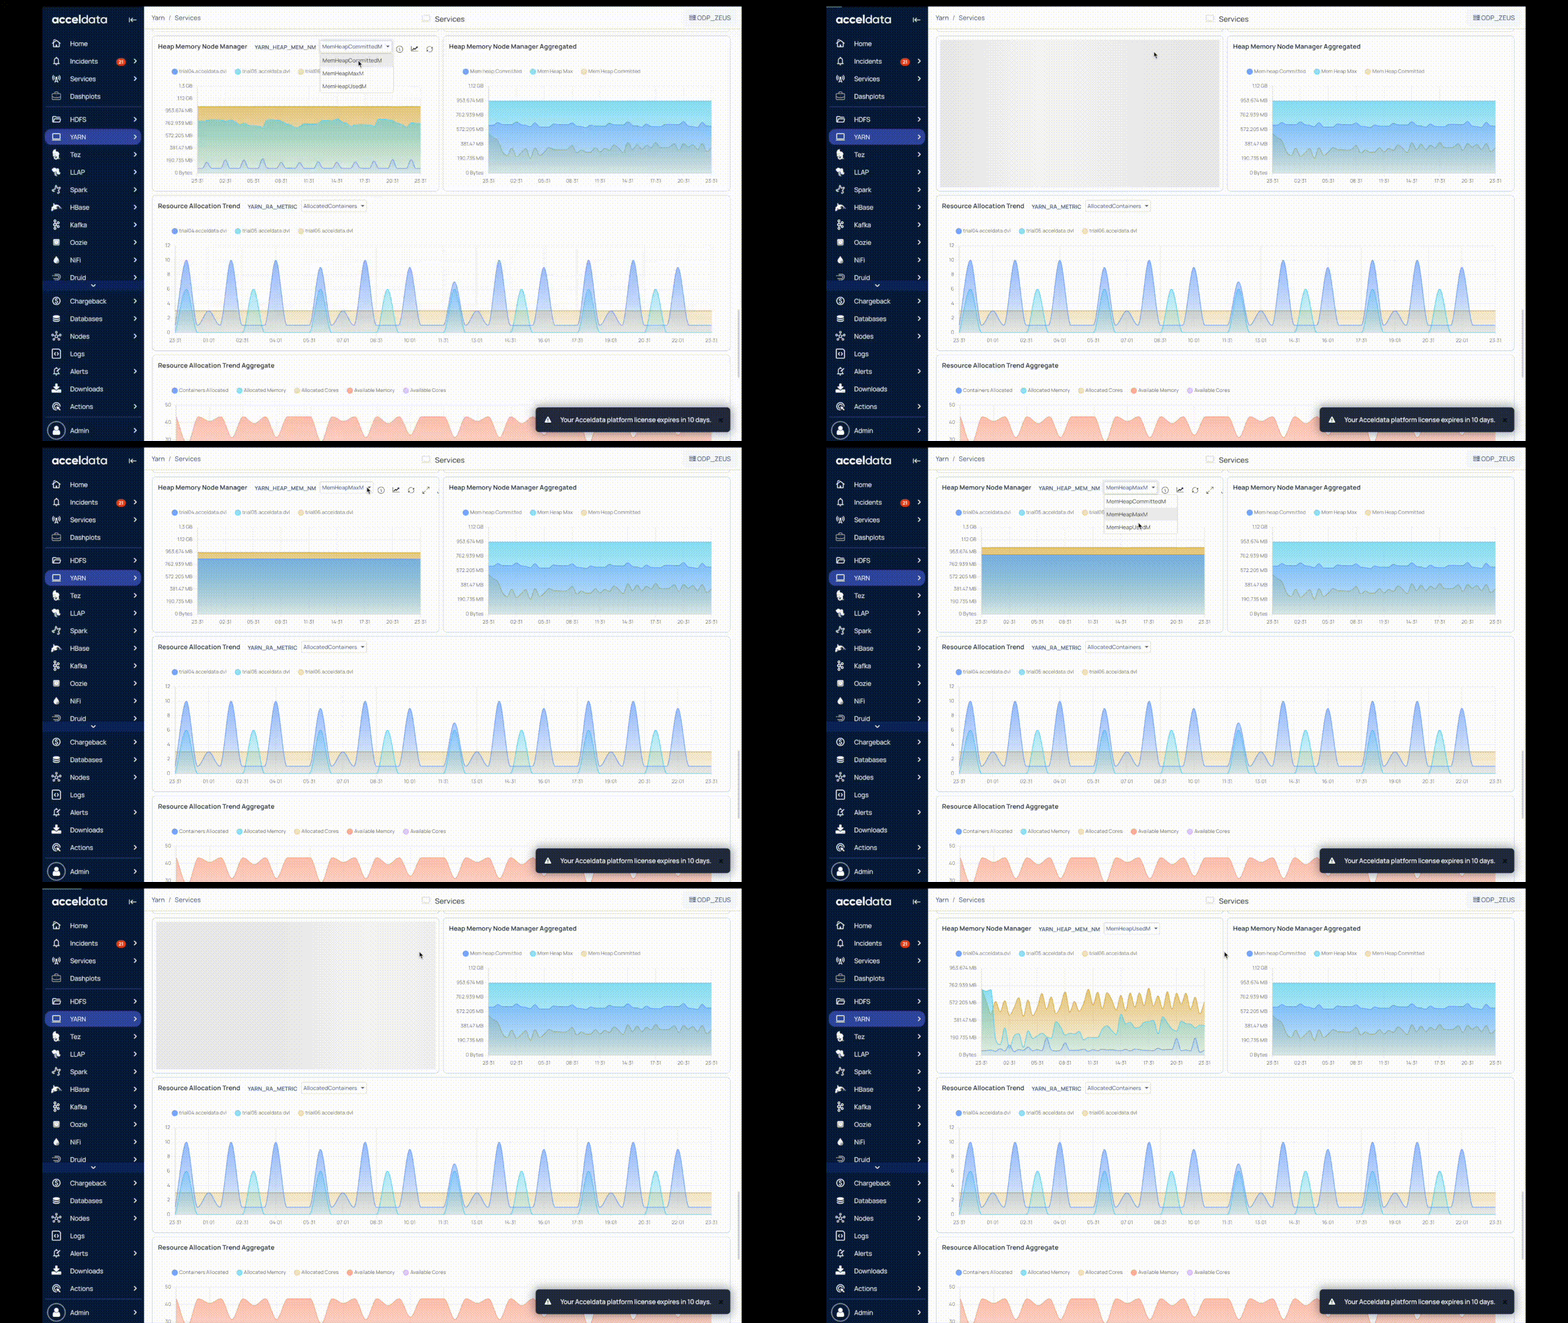
The YARN Services page displays memory and CPU utilization of YARN processes running on nodes in the cluster over a period of time.
The top panel displays the following metrics:

Metric | Description |
|---|---|
Active Resource Managers | The total number of active resource managers. |
Live Node Managers | The total number of live resource managers. |
Charts in YARN Services
The following table describes the charts in the YARN Services page:
Chart Name | Description |
|---|---|
YARN RM Process | The active state of the YARN resource manager process. |
YARN NM Process | The active state of the YARN node manager process. |
RM Running Threads | The number of runnable threads in the resource manager. |
NM Running Threads | The number of runnable threads in the node manager. |
RM Waiting Threads | The number of threads waiting in the resource manager. metric You can observe the following metrics: Threads waiting: The number of threads waiting to execute. Threads Timed Waiting: The number of threads waiting for other threads to execute for up to a specified waiting time. |
NM Waiting Threads | The number of threads waiting in the node manager. You can observe the following metrics: Threads waiting: The number of threads waiting to execute. Threads Timed Waiting: The number of threads waiting for other threads to execute for up to a specified waiting time. |
CPU Usage Node Manager | The rate of change of CPU utilization by the NodeManager. |
CPU Usage Resource Manager | The rate of change of CPU utilization by the ResourceManager. |
Physical Memory Node Manager | The amount of physical memory used by the NodeManager process running on a node aggregate shows mean usage by default. |
Physical Memory Resource Manager | The amount of physical memory used by Resource Manager process on a node. |
Heap Memory Resource Manager | The amount of heap memory used by the resource manager. You can observe the following metrics: Mem Heap Max:The maximum amount of heap memory available to use. Mem Heap Committed: The amount of heap memory committed to use. Mem Heap Used: The amount of heap memory used. |
Heap Memory Node Manager | The amount of heap memory used by the node memory. You can observe the following metrics: Mem Heap Max:The maximum amount of heap memory available to use. Mem Heap Committed: The amount of heap memory committed to use. Mem Heap Used: The amount of heap memory used. |
Resource Allocation Trend | This chart displays the resource trend analysis on the hosts with the following metrics:
|
Container Summary Trend | This chart displays the summary trend of usage of containers on different hosts with the following metrics:
|
Dashplots style is reflected on the dashboards. Ensure to install Dashplots to view the diagrams in the dashboard.
The charts display aggregated metric values. To view individual usage of the host, perform the following:
Click Show Individuals in the chart. The drop-down menu is displayed.
Select the host from the host drop-down list.
Select the metric from the metrics drop-down list. The required data is displayed.