The Tez Query Details page contains the following panels:
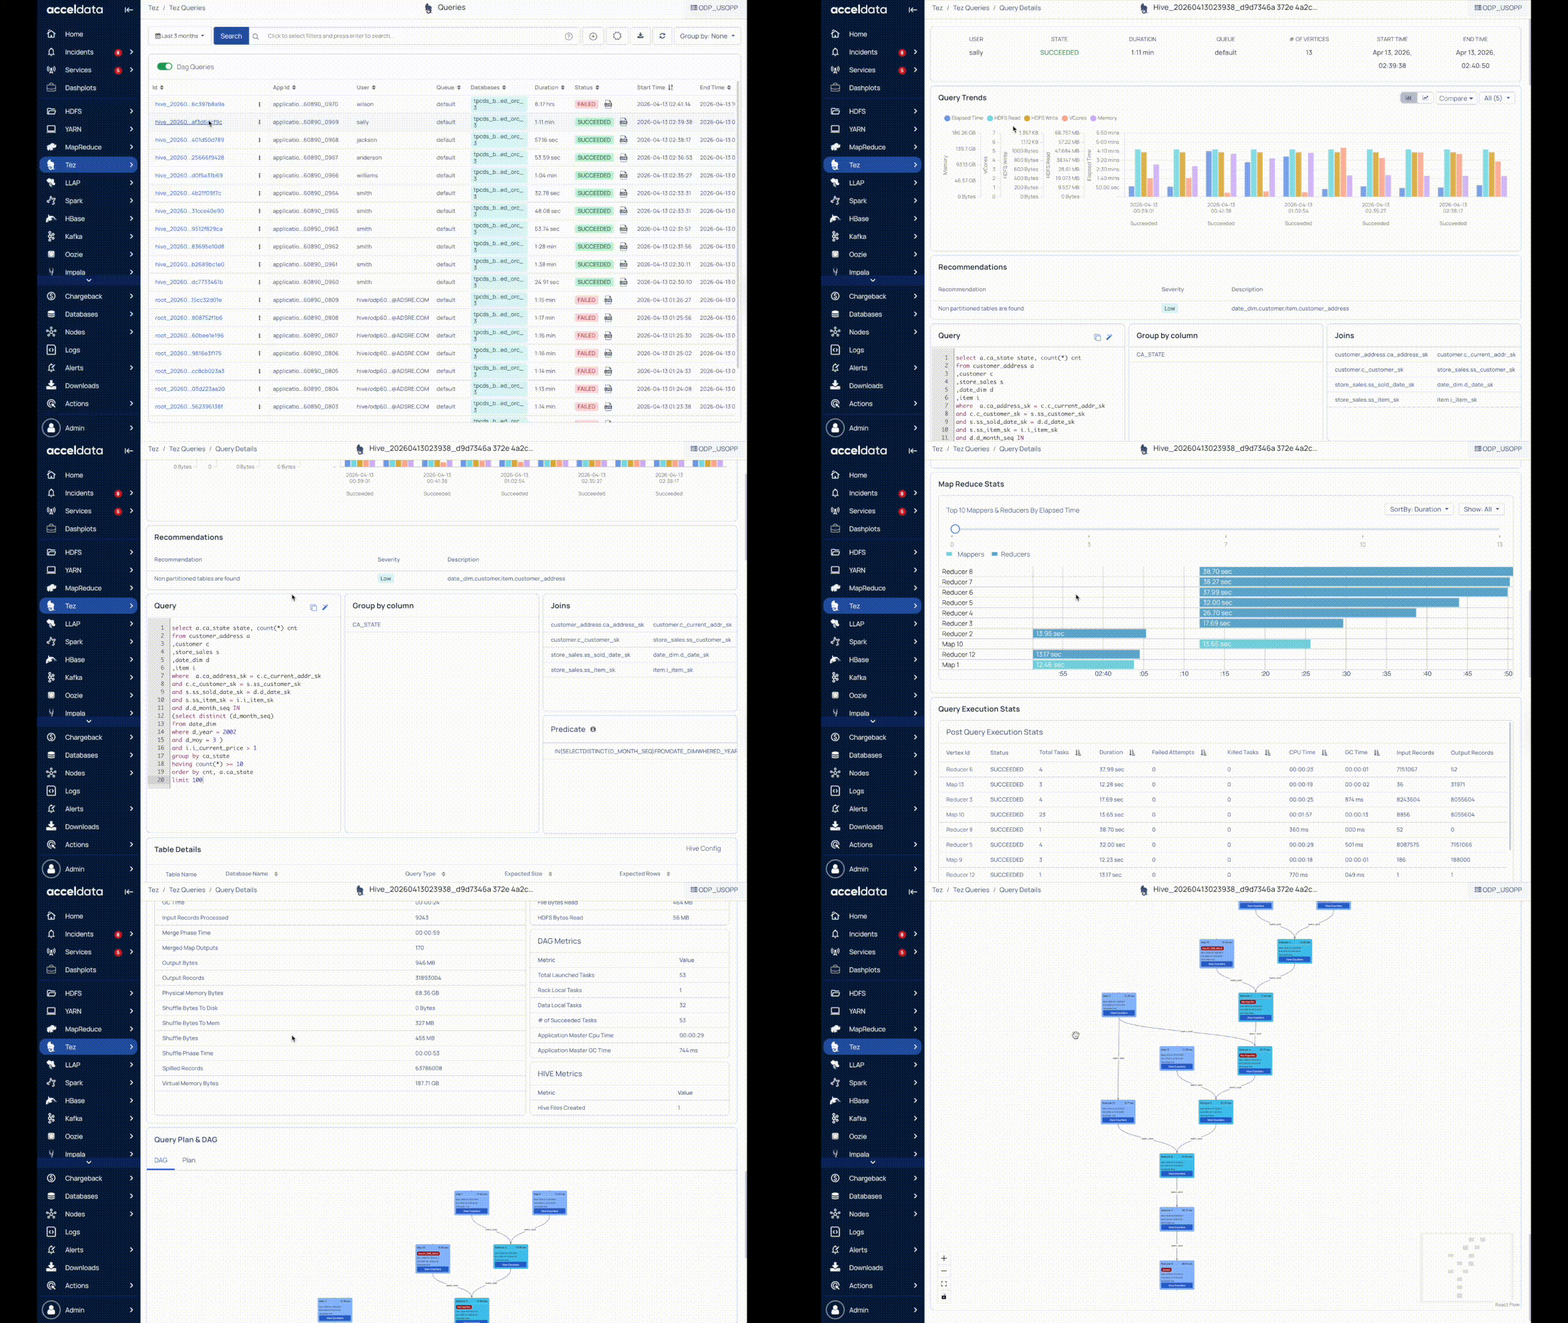
Summary Panel
The summary panel displays the following information.
Field Name | Description |
|---|---|
User | The name of the user that executed the job. |
State | The state of the job that can be one of the following: Created, Initialized, Compiled, Running, Finished, Exception, or Unknown. |
Duration | The time taken to run the query. |
Delay Time | The YARN scheduler delay time. The difference in time taken for a query to move from Accepted state to Running state. |
Start Time | The time at which the query execution started. |
End Time | The time at which the query execution ended. |
Queue | The name of the Queue in which the Query is stuck. You can |
# of Vertices | The number of vertices in the query. |
HDFS Data Read | The amount of HDFS data read. |
HDFS Data Written | The amount of HDFS data written to an output file format. |
Application ID | The ID of the application of the user you are currently viewing. |
Query Trends
The Query Trends panel displays a chart showing the pattern of jobs running at a particular time, based on the following factors.
Metric | Description |
|---|---|
Elapsed Time | The time taken to run the jobs at a particular time. |
VCores | The number of VCores consumed to execute the query within a timeframe. |
Memory | The amount of memory used to execute the query within a timeframe. |
HDFS Read | The amount of HDFS data read. |
HDFS Write | The amount of HDFS data written to an output file format. |
Configuration Difference
Hover your mouse pointer to the Compare button on the right side of the panel and select Runs to compare the different configurations of the query. Select the runs that you want to compare from the drop-down list. You can choose from up to 10 previous runs of the query.
The following tabs are displayed in the Configuration Difference window:
Tab Name | Description |
|---|---|
Metric | Displays the metric difference of the runs |
Config | Displays the configuration difference of the runs. |
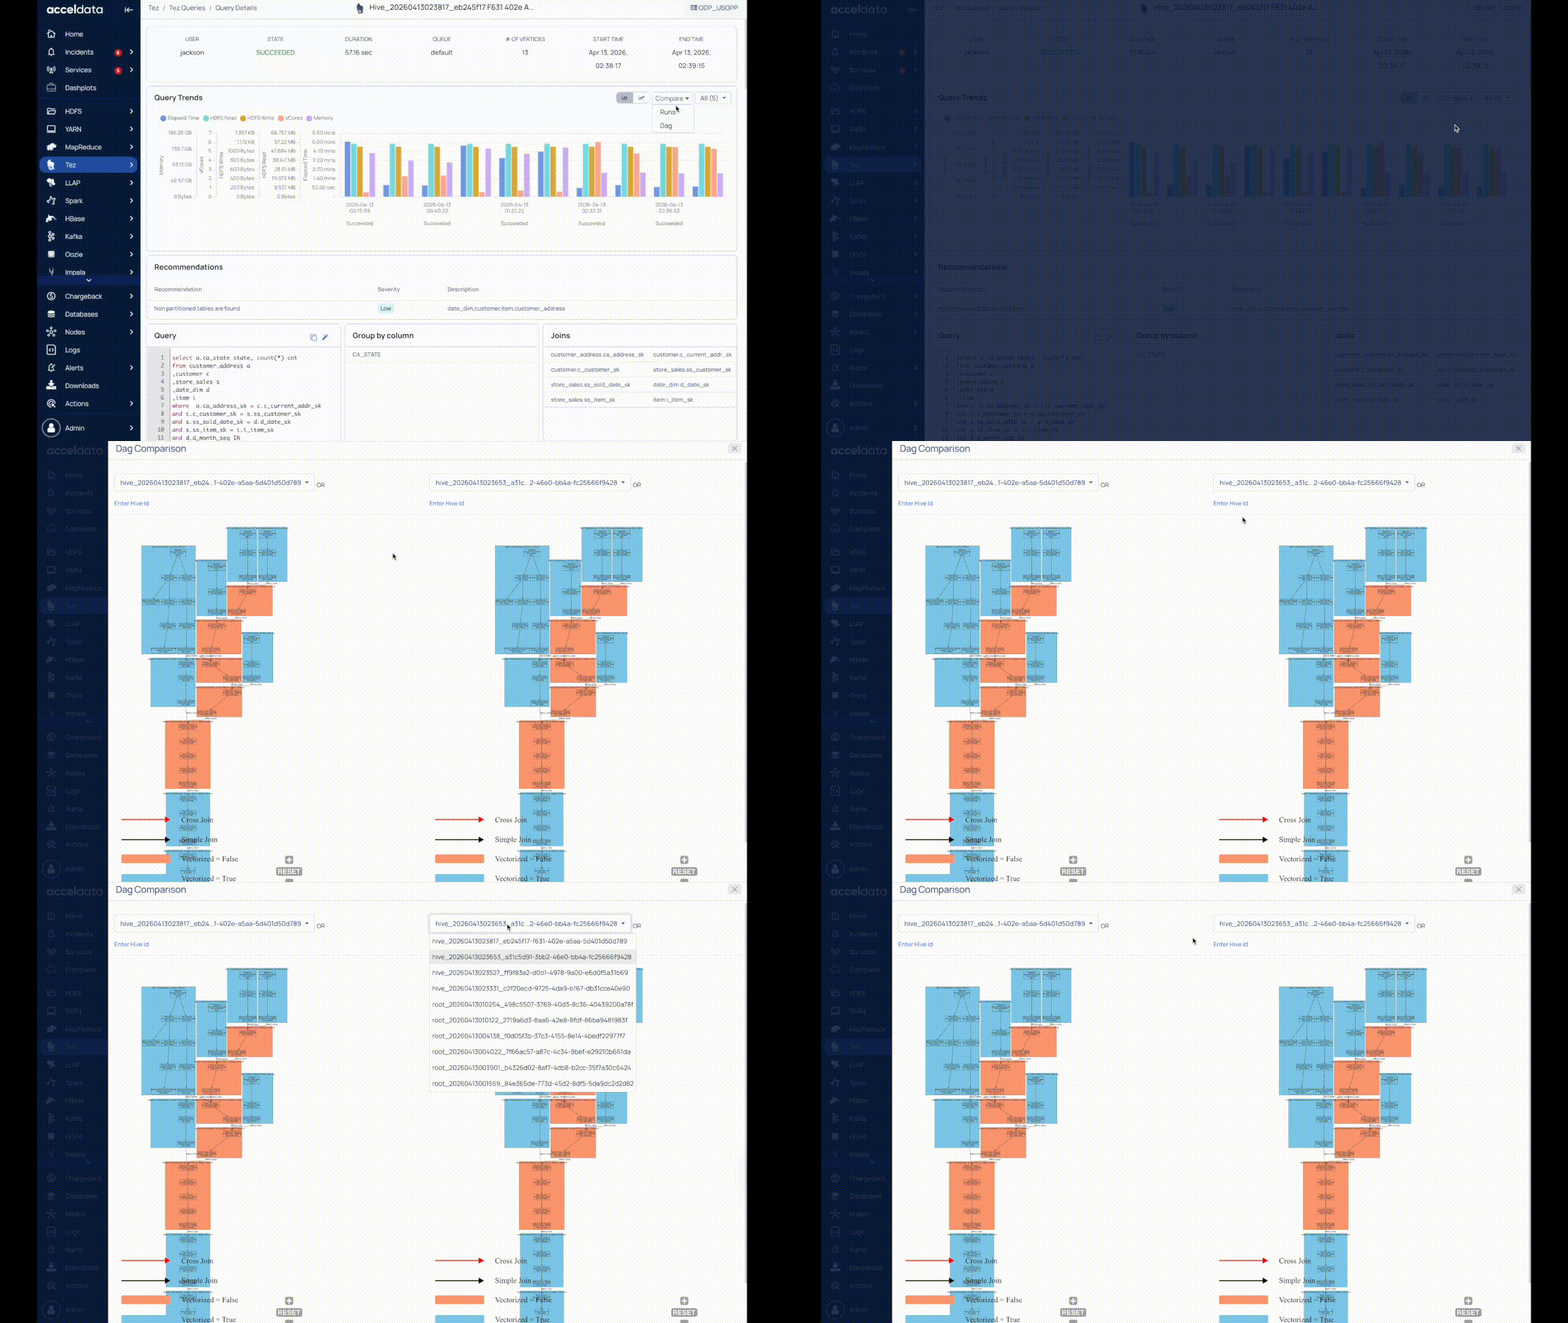
DAG Comparison
Hover your mouse pointer to the Compare button on the right side of the panel and select the Dag option to compare the different DAGs. Select the ID's from the drop down or enter a Hive ID to compare the two DAGs next to each other.
Recommendations
The Recommendations panel displays recommendations that you can use to improve the performance of the SQL Query. If the table has small files attached to it, this information is provided in the Recommendations section.
Recommendations | Recommendation Text | Sample Query | Query Pattern Type |
|---|---|---|---|
No limit statement on final projection | No limit clause | SELECT col1 FROM table WHERE col1 = true; | |
Star projection | Use qualified column names | SELECT * FROM table LIMIT 10; | |
Possible query error | No where clause detected | SELECT col1 FROM table; | |
Table partition is unused | Partition not used | SELECT * FROM table; | |
Possible optimization | Function call in predicate, use a CTE query. | SELECT * FROM | |
Possible optimization | Aggregate Function call in a Having clause, Lift in to where clause. | SELECT col1 FROM GROUP BY col1 HAVING COUNT(col1) > 1 | |
Possible query error | This 1uery uses multiple tables, but has non joins and no where clause. This may cause a cartesian join. | SELECT t1.col, t2.col FROM t1, t2 | |
Possible order optimization | Orderby can be replaced with Sortby to use multiple reducers. Ordering will be enforced within reducers. | SELECT col1, col2 FROM t1 ORDER BY col1, col2 | |
Change conversion type or decrease threshold to improve performance Severity: 1 | For single stage using fetch operator, either modify task conversion type or threshold to improve performance. | select * from call_center where cc_ call_center_id="AAAAAAAABAAAAAAA" limit 10; | SELECT *, FILTER on partition columns (WHERE and HAVING clauses), LIMIT only. |
Move transformations on projection Severity: 1 | select * from ( select st1,i1,sa,sb,a,b from t1 ) t1 join t2 on ( st1=st2 and i1=i2 and case when sa = 'yes' then a when sb = 'yes' then b end = x and st2 = 'asd1' | ||
Avoid row_number() functions as its not vectorized Severity: 1 | Non-vectorized operator $operator identified in the $stage | SQL with row_number() | |
Specifically typecast the columns which are going in for string comparison to be cast as string if not already string datatype Severity: 1 | Non-vectorized operator $operator identified in the $stage | where string_col=double_ col | |
Cross join identified, revert and refrain from usage Severity: 0 | Cross join is identified, please check the join keys or query conditions | select * from <table1> cross join <table2 | |
Identify M/R non-vectorized Severity: 1 | |||
Complex queries usually have large numbers of joins, often over 10 joins per query. Severity: 1 | More than 10 joins identified in the query |
Query
The Query panel displays the SQL query along with the Join details and the details of table(s) used in the query. The following table provides description of the table details:
Column | Description |
|---|---|
Table Name | The table used in the query. |
Database Name | The Database to which the Table belongs to. |
Filter expression | The expression used in query filtering. |
Expected Size | The total number of rows in the table. |
Expected Rows | The number of rows returned on executing the query. |
Note To copy SQL, click and to beautify the SQL, click .
Click Hive Config, to view Hive configuration details for the selected query.
To view the table details click on the table name. The Tez Table Details for the table is displayed.
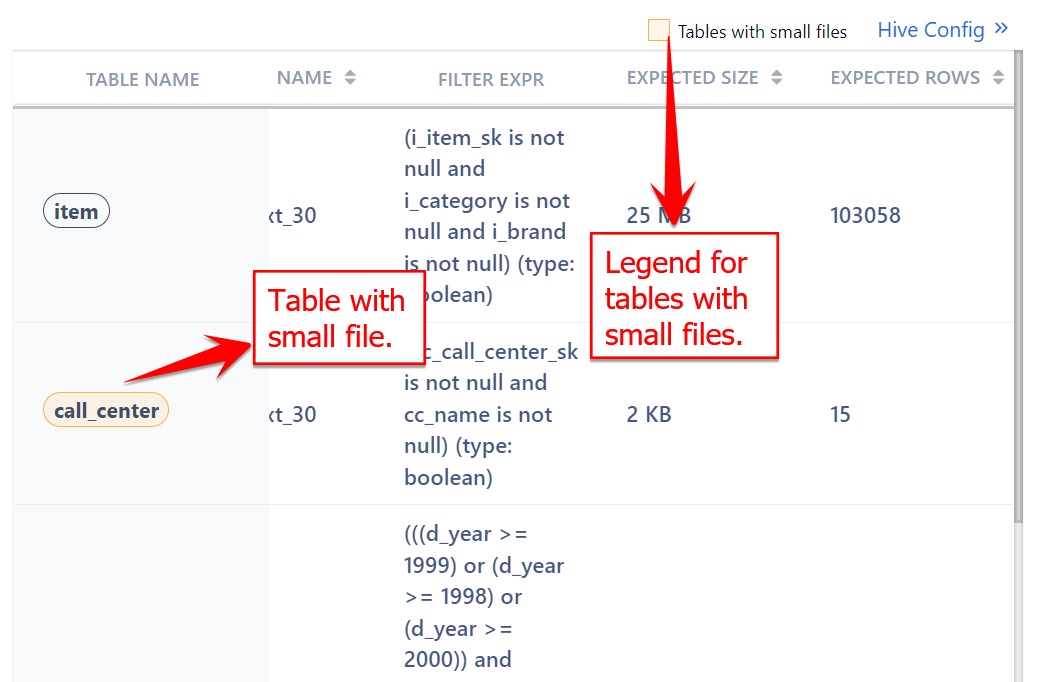
Tables with Small Files
If any of the table accessed by the query has small files attached to it, you can see those table names with an yellow border. The legend at the top of the Query table indicates the same.
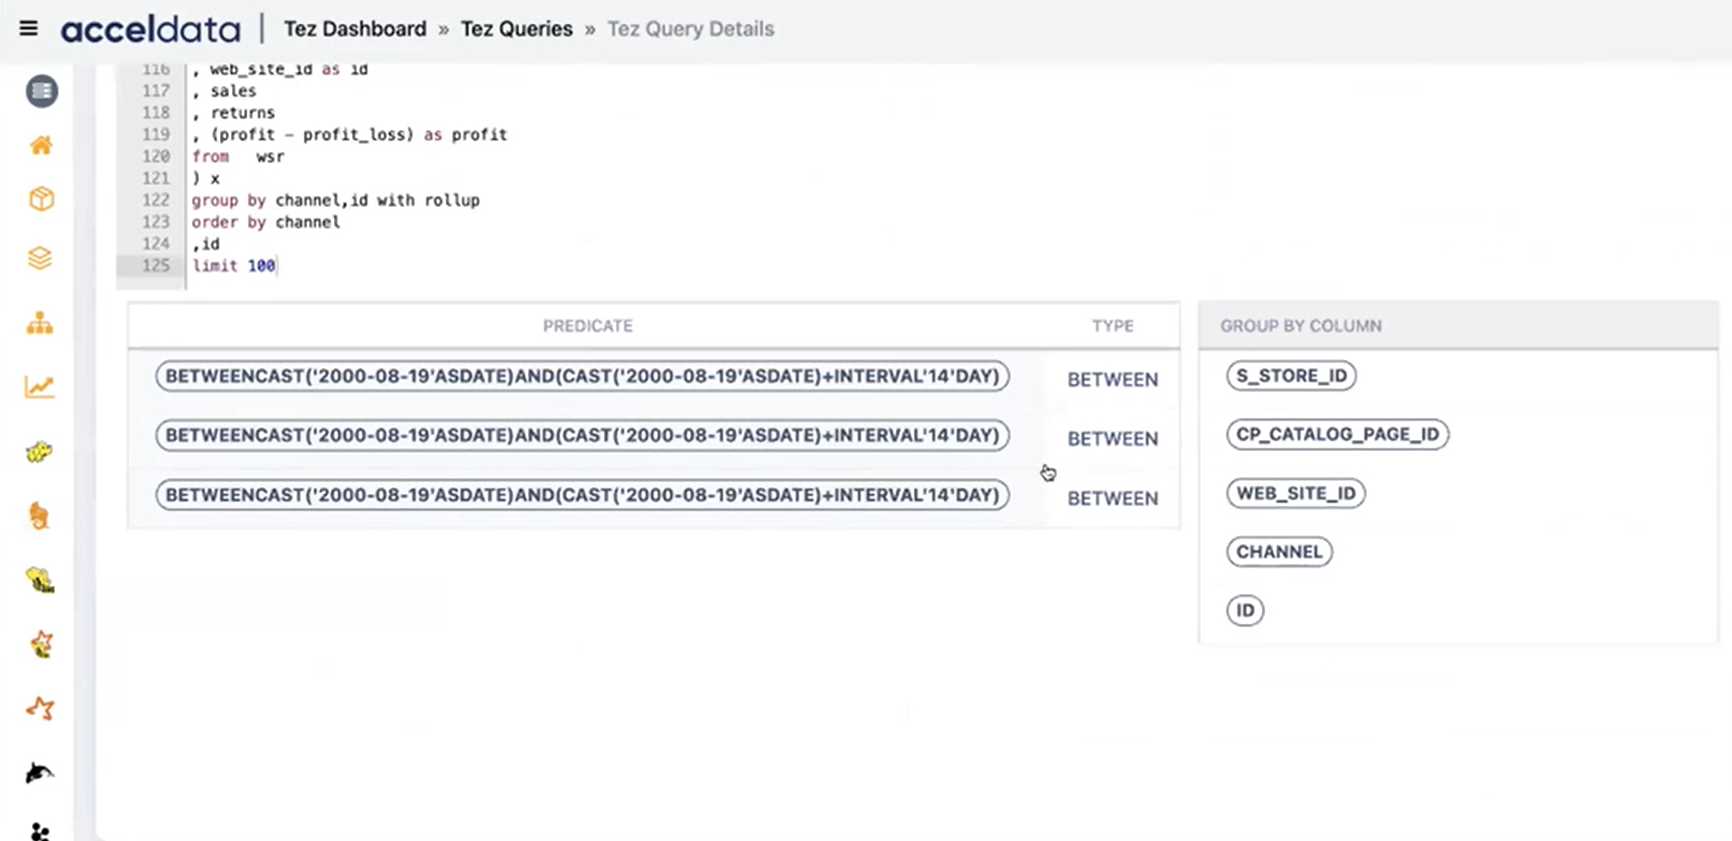
Predicate and Group By Details
Pulse displays the predicate ranges used in the query (if any) along with the predicate type. If multiple predicates are used in a query, all of them are displayed in this column.
Also, Pulse displays the Group By clause (if applied) om the query.
YARN Diagnostics
This panel displays the following diagnostics metrics of YARN.
Column Name | Description |
|---|---|
Start Time | The time at which the YARN application started. |
End Time | The time at which the YARN application ended. |
State | The state of the YARN application. The state can be one of the following: Created, Initialized, Compiled, Running, Finished, Exception, or Unknown. |
Message | The diagnostic message in the YARN application. |
Message Count | The number of diagnostic messages. |
The following details are displayed for jobs in a YARN container.
Note: A row contains data for a minute of the selected duration.
Column Name | Description |
|---|---|
Time | The minute at which the job is executed. |
Preempted MB | The amount of processes that need priority to run the job. |
Preempted VCores | The number of VCores that need priority to run the job. |
Allocated MB | The amount of memory allocated to the query (in Mb). |
Avg Memory | The average a mount of memory used. |
Avg VCore | The average amount of VCores used. |
Running Containers | The number of containers running in the query. |
Queue Usage % | The amount of queue usage (in %). |
Cluster Usage % | The amount of cluster usage (in %). |
State | Displays the state of the cluster |
Message | The diagnostic message. |
Map Reduce Stats
This tile displays the statistics of processing of large data sets on a worker node. You can monitor the statistics of following processes by elapsed time.
Mappers
Reducers
These statistics can be sorted by Duration and Start Time. To sort perform the following:
Click SortBy. The drop-down list is displayed.
Select Duration, if you want to filter by duration. Select Start Time if you want to filter by time. The data is sorted.
(Optional) Select None, to the reset the applied sort.
To filter the data by mappers and reducers, perform the following:
Click Show. The drop-down list is displayed.
Select Mappers if you want to view only data related to mappers. Select Reducers if you want to view only data related to reducers.
(Optional) Click All, to remove the applied filter.
Query Execution Stats
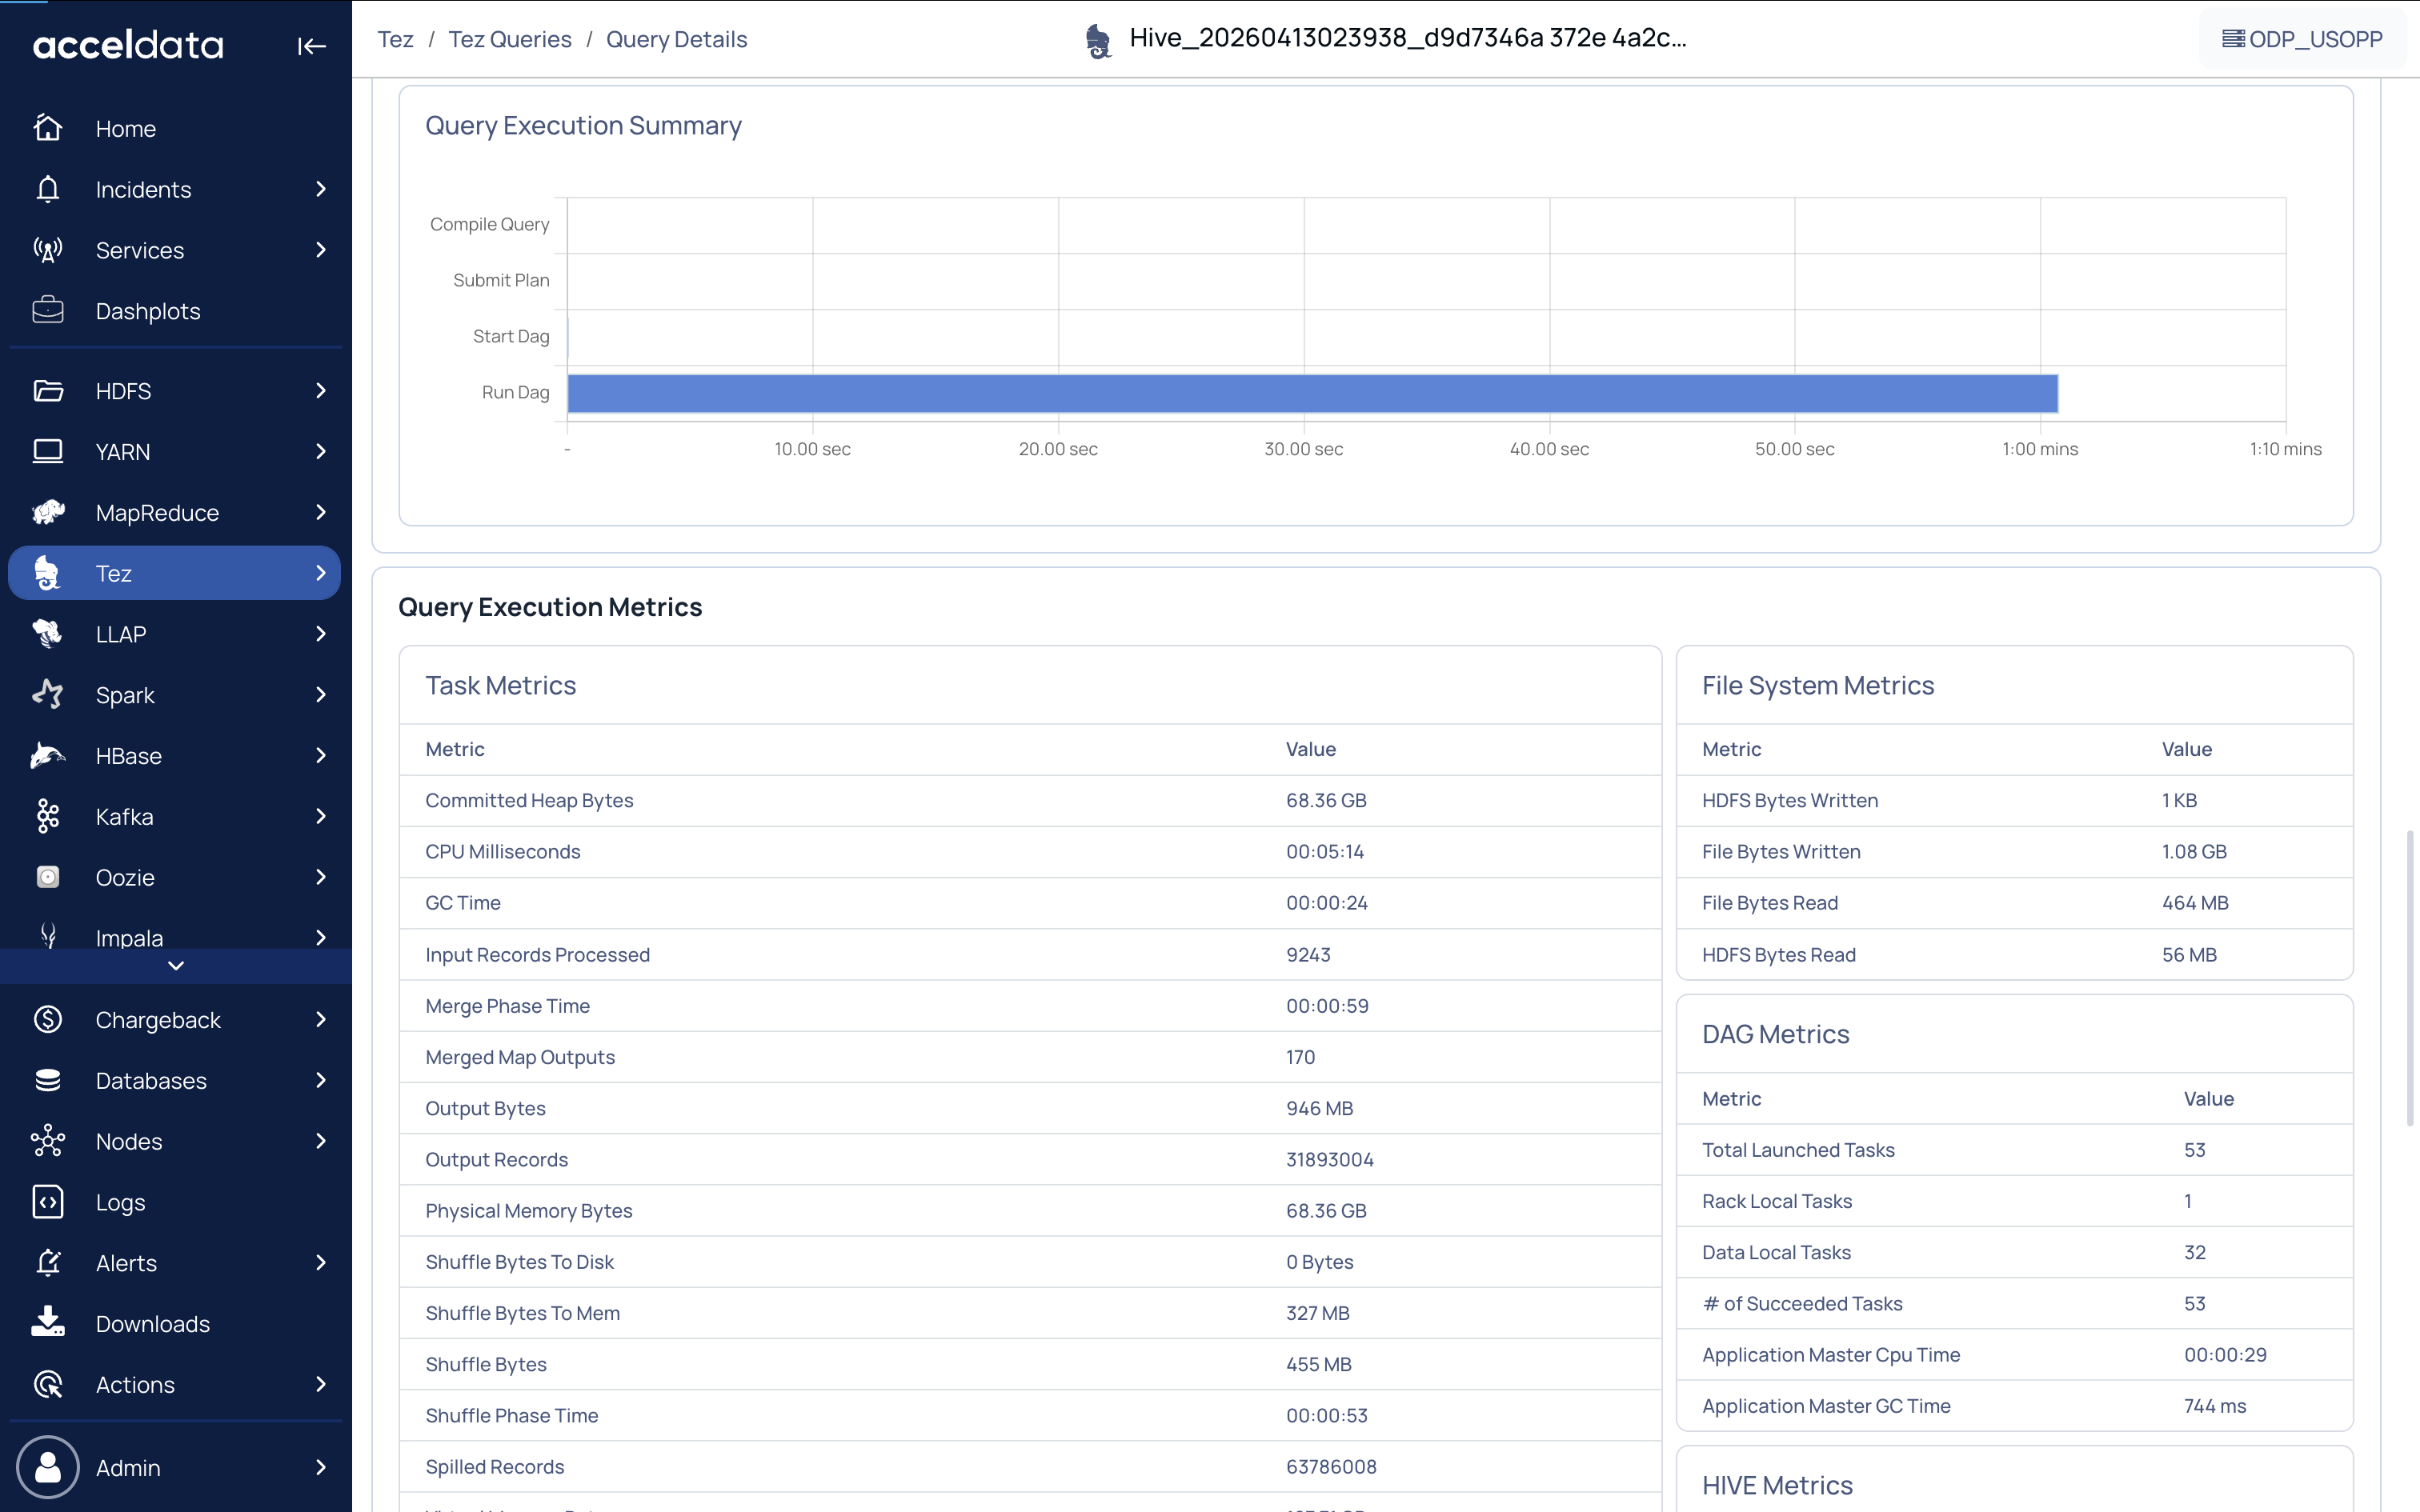
This tile displays the values and graphs of data scanned during the query execution, time taken to execute the query, and the amount of records generated. You can also monitor the statistics in the Query Execution Summary.
The Post Query Execution Stats panel displays values for the following fields:
Column Name | Description |
|---|---|
Vertex ID | Displays the Vertex ID. Clicking on the Vertex ID directs you to the Query Plan and DAG |
Status | Displays the Tez job status, such as Succeeded, Failed, Submitted, Killed, and Error. |
Total Tasks | The total number of tasks in each vertex |
Duration | The total time taken to execute the query, including any waiting time for dependent vertices. |
Failed Attempts | The number of completed job attempts with an unexpected status value |
Killed Tasks | The number of duplicate copies of a task that were attempted and terminated |
CPU Time | The CPU time taken to complete the query |
GC Time | Time spent in garbage collection while executing a query |
Input Records | The number of input records |
Output Records | The number of output records |
The Query Execution Summary panel shows a time series graph with data points drawn in the timeline based on the Run Dag, Start Dag, Submit Plan, and Compile Query flows.
Query Execution Metrics
The Query Execution Metrics panel displays the following set of the metrics.
Metric Type | Metric Name | Description |
|---|---|---|
Task | Committed Heap Bytes | The maximum amount of memory (in bytes) that can be used for memory management. |
CPU Milliseconds | The CPU time (in ms). | |
GC Time | Time spent by the JVM in garbage collection while executing a query. | |
Input Records Processed | The number of input records processed. | |
Merge Phase Time | The time taken to merge a query phase. | |
Merged Map Outputs | The number of map outputs that were merged. | |
Output Bytes | The number of output bytes written to a file format while executing the query at a given time. | |
Output Records | The number of output records. | |
Physical Memory Bytes | The amount of physical memory the query uses. | |
Shuffle Bytes To Disk | The number of shuffle records written to disk. | |
Shuffle Bytes To Mem | The number of shuffle records written to memory. | |
Shuffle Bytes | The number of shuffle bytes the query uses. | |
Shuffle Phase Time | The time taken to shuffle a query phase. | |
Spilled Records | The number of spilled records. | |
Virtual Memory Bytes | The amount of virtual memory used by queries. | |
File System Metrics | HDFS Bytes Written | The number of HDFS bytes written to the query executor. |
File Bytes Written | The number of file bytes written to the query executor. | |
HDFS Bytes Read | The number of HDFS bytes read. | |
File Bytes Read | The number of file bytes read. | |
DAG Metrics | Total Launched Tasks | The number of tasks launched in DAG. |
Rack Local Tasks | The number of tasks that are local to the rack. | |
Data Local Tasks | The number of tasks that are local to the data. | |
of Succeeded Tasks | The number of tasks that completed successfully. | |
Application Master Cpu Time | The time taken by the CPU in application master. | |
Application Master GC Time | The time taken by the GC in the application master. | |
HIVE Metrics | Hive Files Created | The number of HIVE files that were created. |
Query DAG and Plan
The panel displays the distribution of query logic in the form of a DAG and a physical execution plan.
DAG
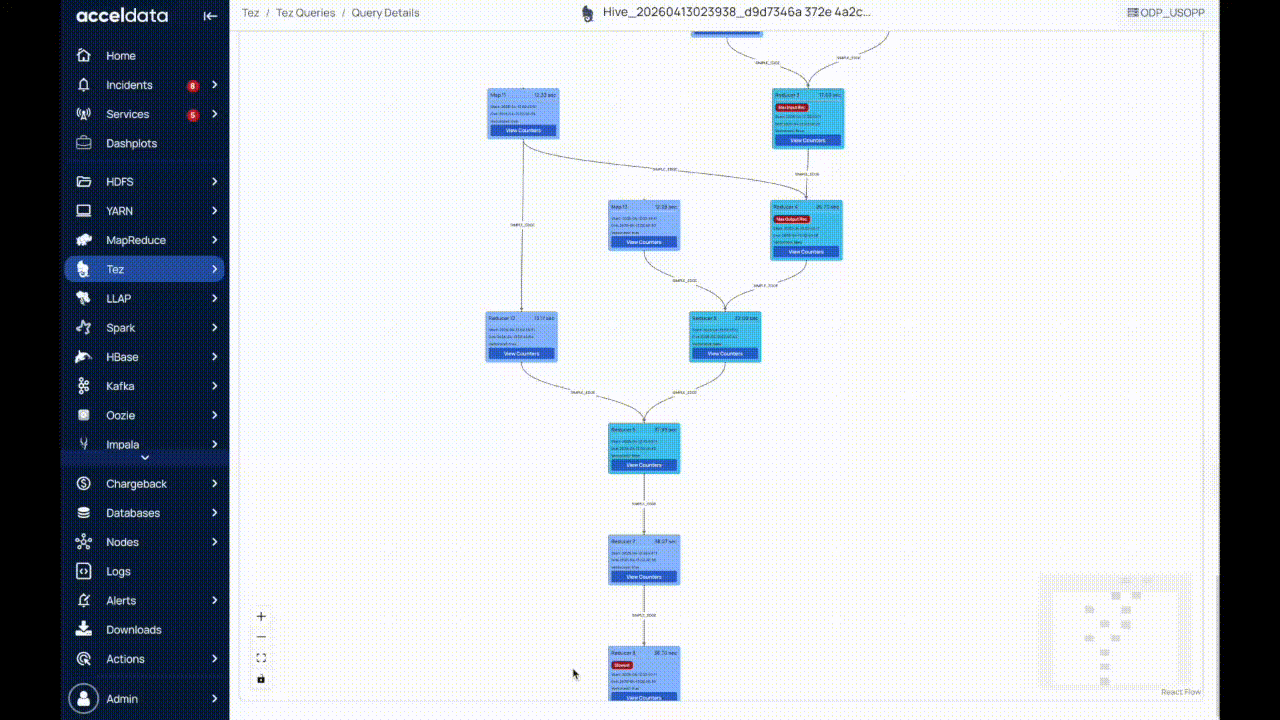
The Direct Acyclic Graph (DAG) is an execution graph that displays a flow diagram of the compiled Hive SQL queries. This graph is a work scheduling graph with finite elements connected in edges and vertices. The order of execution of the jobs in DAG is specified by the directions of the edges in the graph. The graph is acyclic as it has no loops or cycles.
The following image displays an example for a DAG. Click to zoom in and zoom out. Click Fit View, to restore back to original size.
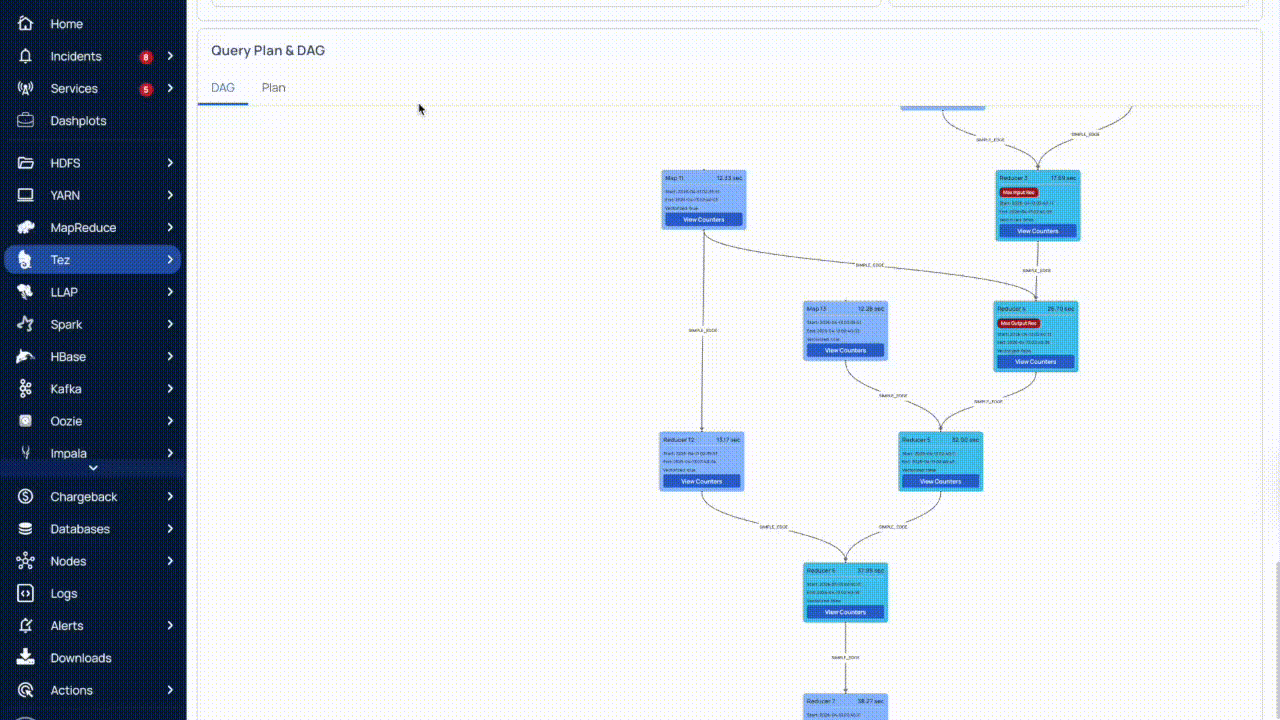
The DAG displays a list of nodes. Each node can either be a Map node or a Reducer node. you can find information like the node which has the maximum input record, node that has the maximum output record, the slowest node, if a specific node is vectorized or not, and so on. You can also find counter information for specific vertices. Furthermore, you can also get information if an edge connecting two nodes is a simple edge.
The duration shown for each node in the DAG represents the actual time taken to run the query, excluding any waiting time.
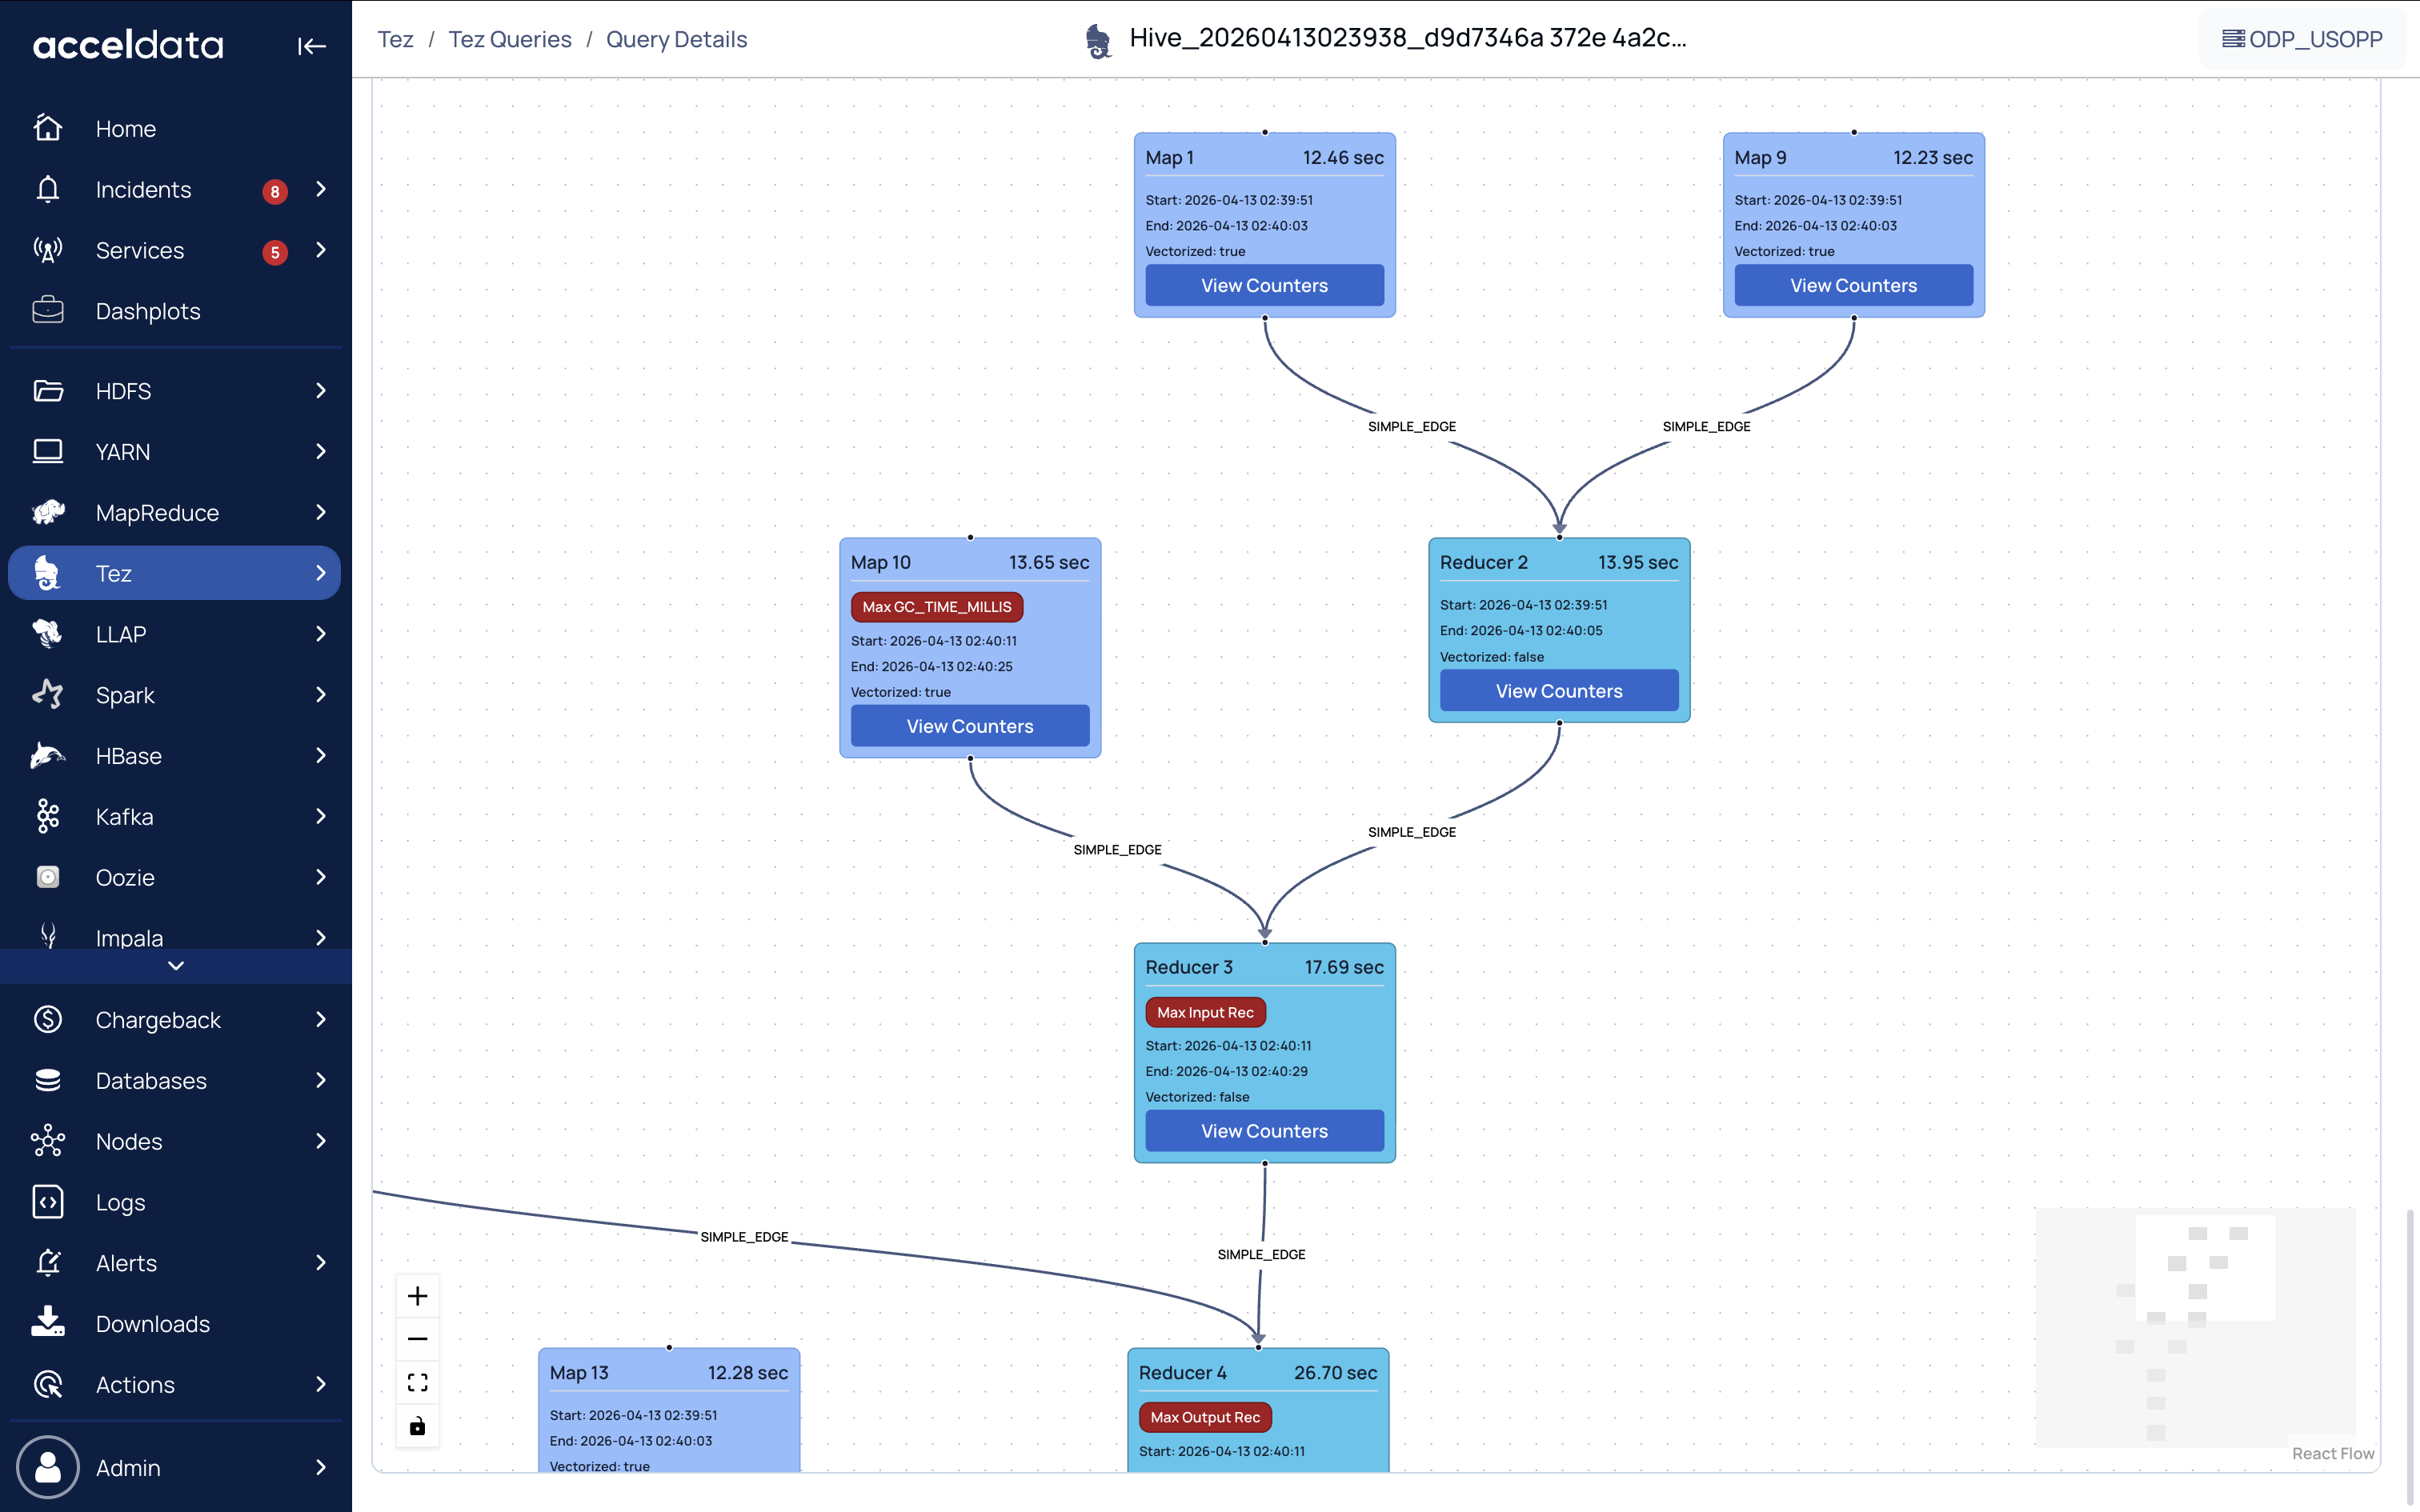
You can find the information in the inner tree by clicking the node.
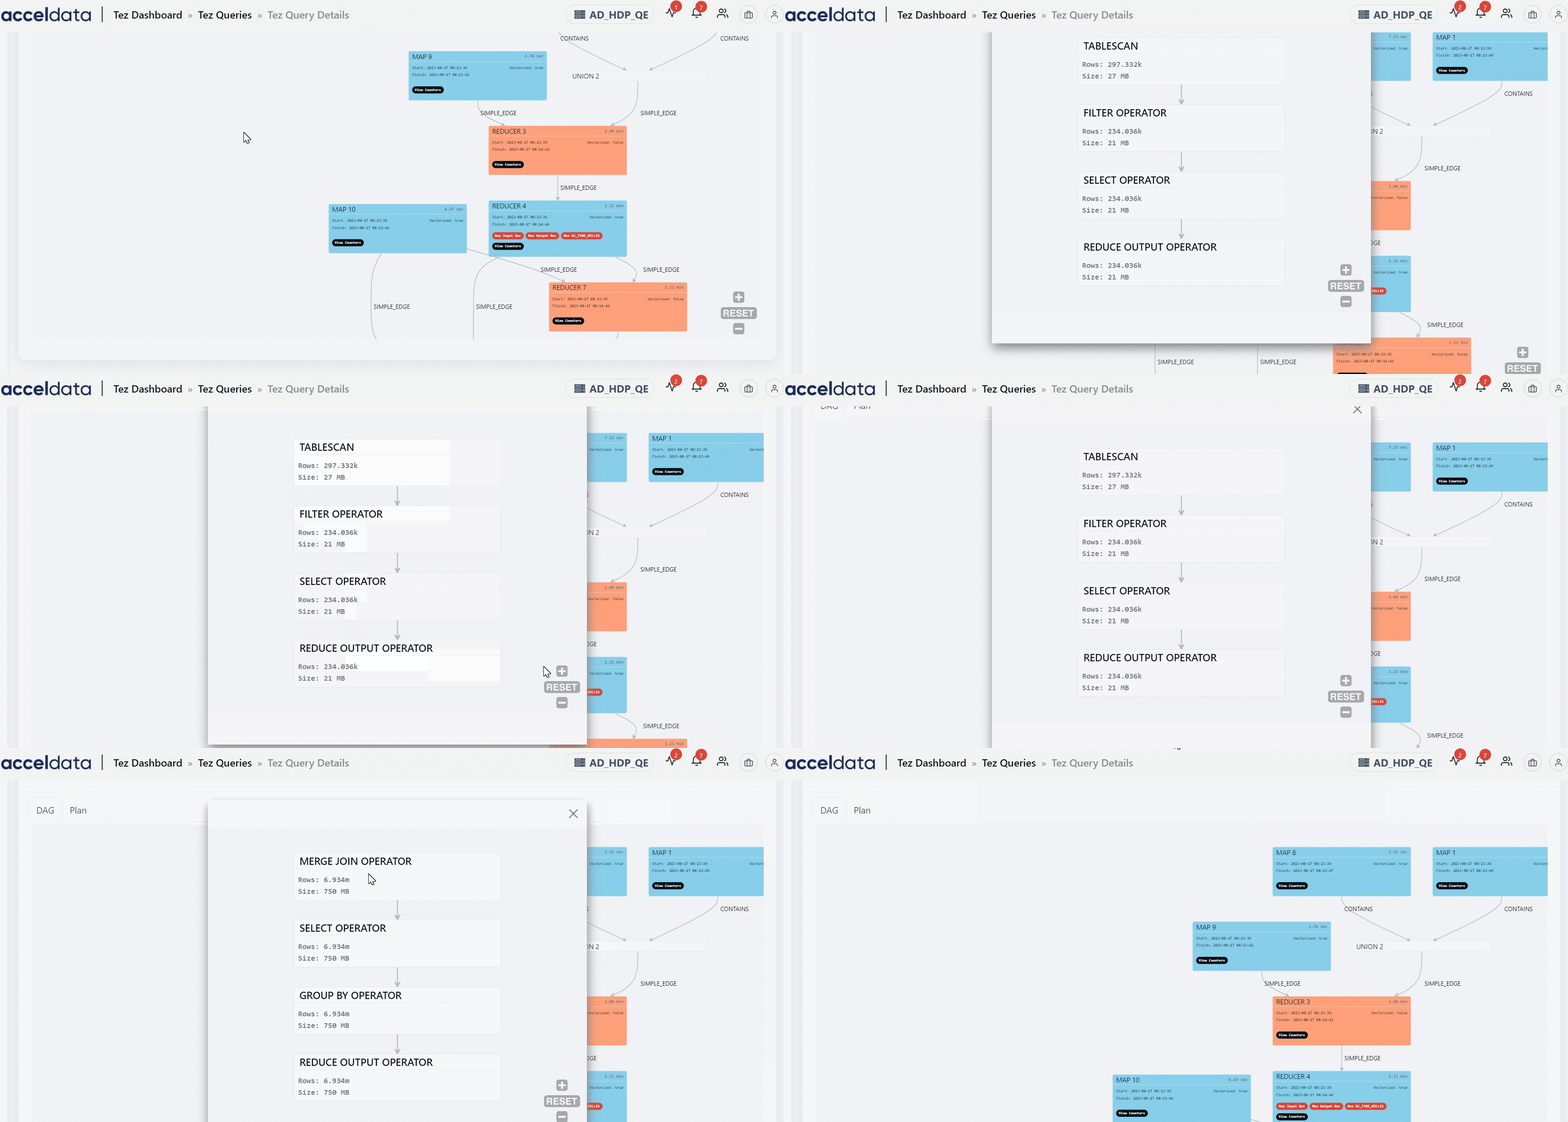
You can navigate to a specific node in the DAG plan from the Post Query Execution Stats table by clicking a Vertex ID. The selected node is highlighted for some time.
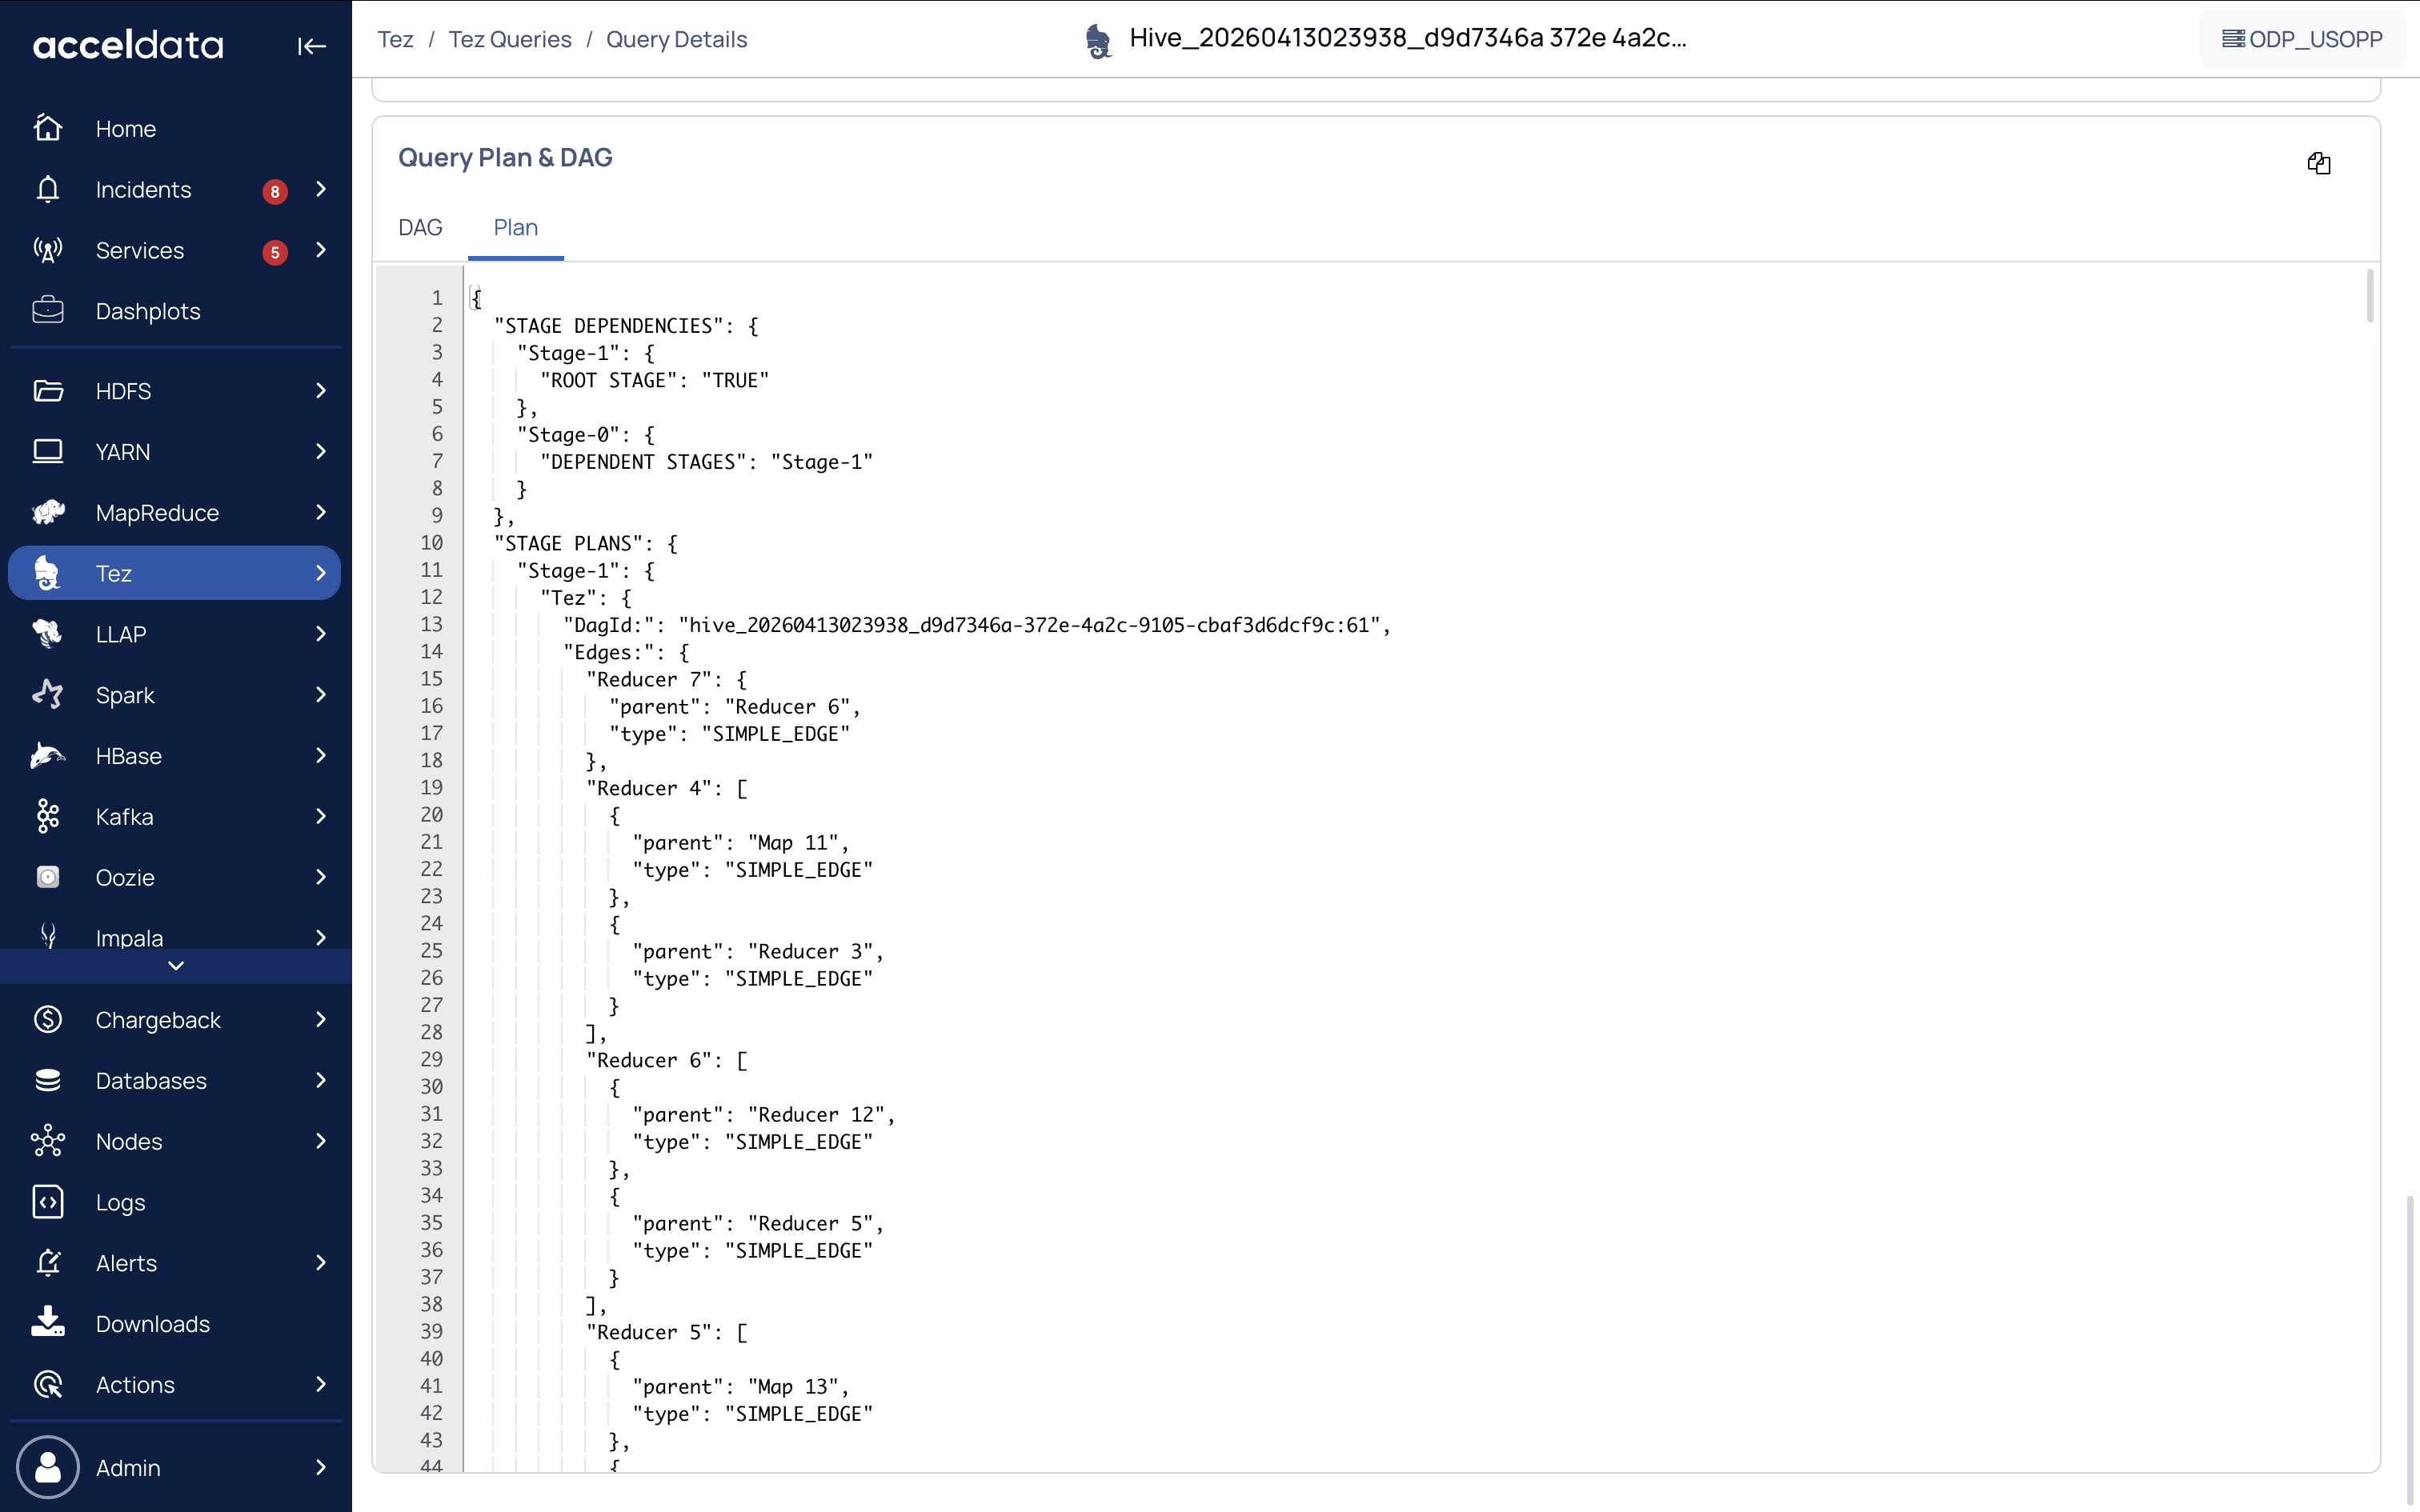
Plan
A plan is a logical representation of how Spark executes a query, which is broken into different logical plans.