Title
Create new category
Edit page index title
Edit category
Edit link
Analyze Flink Job Details
The Flink Job Details page provides detailed insights into a specific Flink job, including its execution state, performance statistics, and operator-level metrics.
This enables you to:
- View job execution details, including state, duration, and checkpoints.
- Analyze job restarts and stability indicators.
- Understand job complexity through vertex-level metrics.
- Identify bottlenecks by reviewing records and data throughput across operators.
- Monitor resource usage and time-based performance trends.
Steps
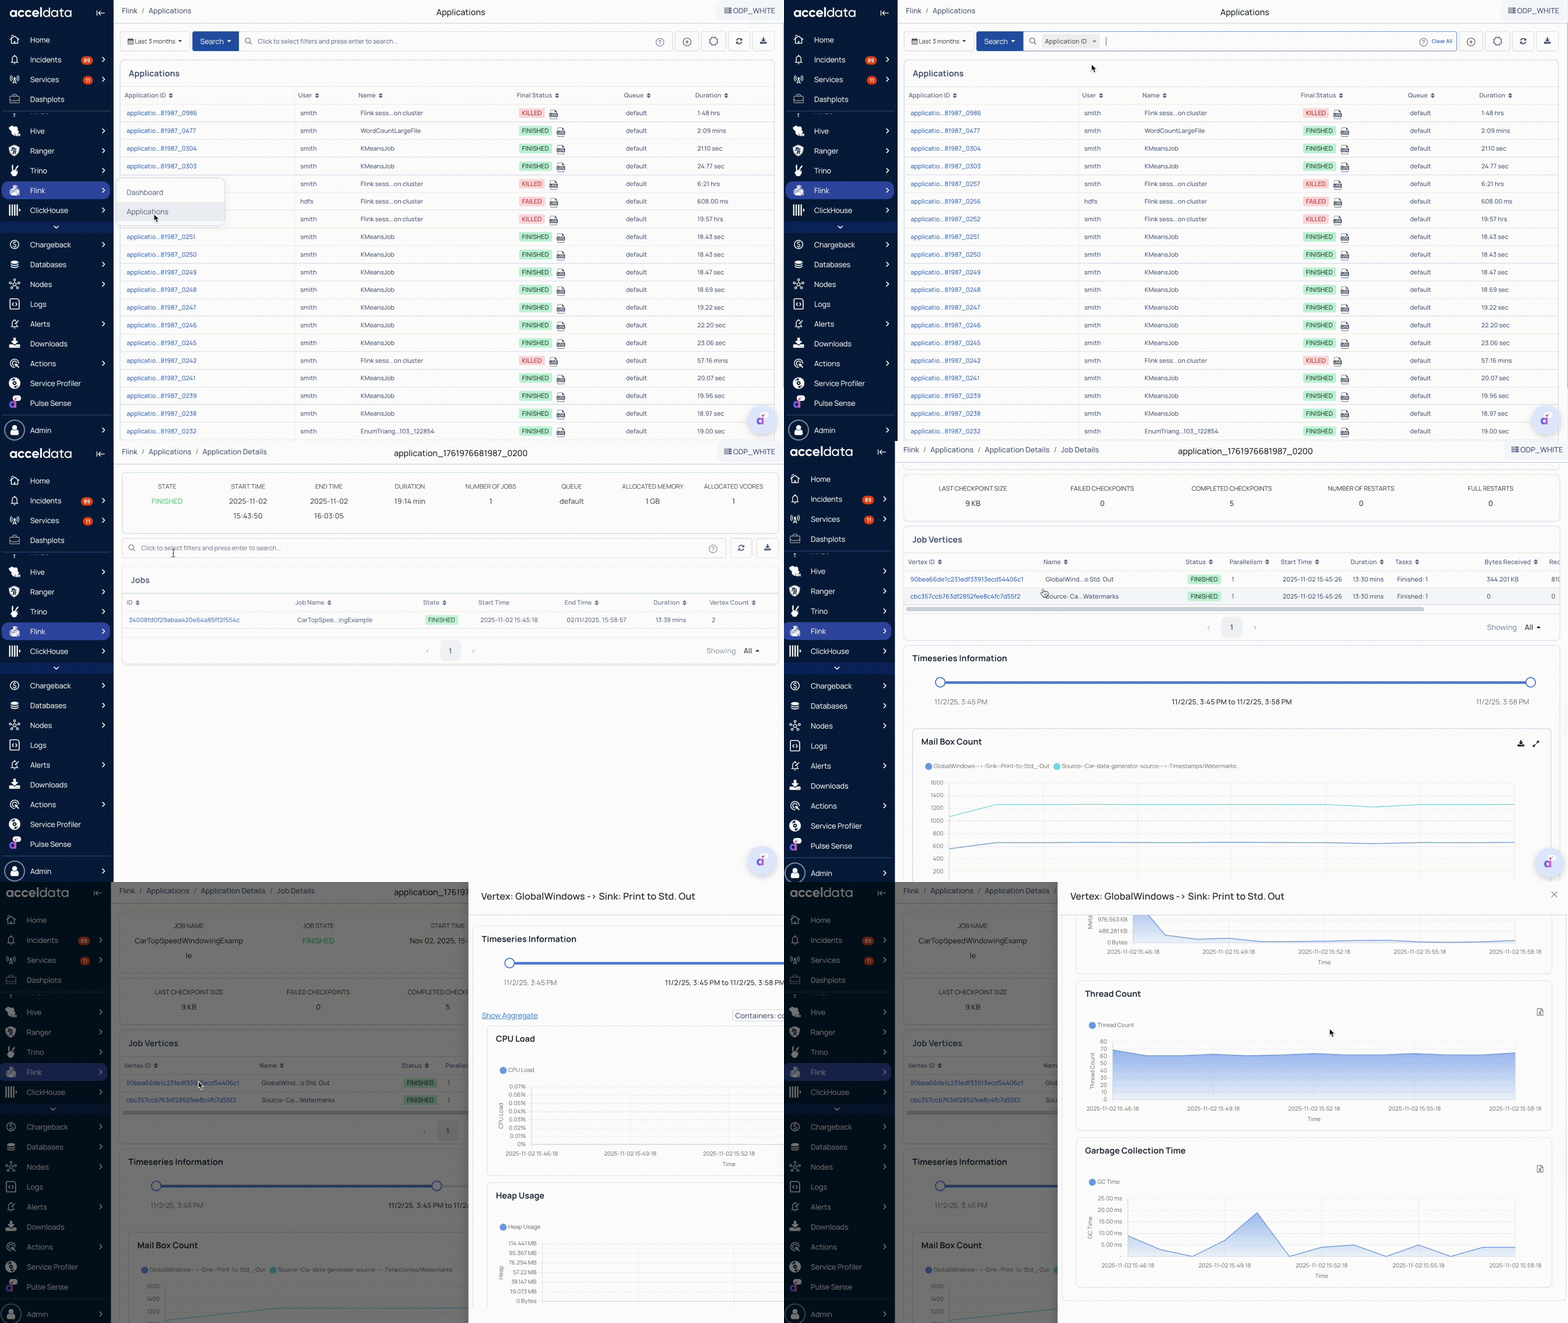
- In the Pulse UI, go to Flink > Applications.
- On the Applications page, view a list of all executed Flink applications.
- Use filters or the search bar to find applications by ID, user, name, status, etc.
- Set a time range and refresh interval (for example, 10 s, 20 m, 2 h, or 1 w) to ensure data is up to date.
- Click an Application ID to view its associated jobs.
- On the Application Details page, select a job to view the detailed information.
On the Job Details page, you can see the following information.

Job Summary
The Job Summary section provides high-level information about the selected Flink job.
Identification and Status
- Job Name: Name of the Flink job.
- Job State: Current status, such as Running, Finished, or Failed.
Execution Timeline
- Start Time: Timestamp when the job started.
- End Time: Timestamp when the job ended.
- Duration: Total time taken to complete the job.
Stability and Checkpoints
- Last Checkpoint Size: Size of the most recent completed checkpoint.
- Failed Checkpoints: Number of checkpoint failures.
- Completed Checkpoints: Number of successfully completed checkpoints.
- Number of Restarts: Total restarts that occurred during execution.
- Full Restarts: Number of complete restarts triggered by major failures.
Vertex Metrics
Each vertex represents an operator or task in the Flink job’s execution graph. The Vertex Metrics section lists operator-level details and resource statistics.
Identification and Execution
- Vertex ID: Unique identifier for the vertex.
- Name: Operator or task name (for example, Map, Reduce, Sink).
- Status: Execution state of the vertex (for example, RUNNING or FINISHED).
- Parallelism: Number of parallel task instances for the vertex.
- Start Time: Timestamp when vertex execution started.
- Duration: Time taken to execute the vertex.
- Tasks: Number of tasks completed or currently running.
Data Throughput
- Bytes Received / Records Received: Volume and count of input data processed by the vertex.
- Bytes Sent / Records Sent: Volume and count of output data sent downstream.
Click a vertex ID to analyze the vertex-level resource utilization. For details, see Vertex-Level Resource Usage.
Time Series Metrics
The Timeseries Metrics section visualizes performance data over a selected time range.
For short-running jobs (approximately 15–20 seconds), Flink does not emit job-level metrics, which may result in blank graphs on the job pages.
Performance Indicators
- Mail Box Count: Number of mailbox messages processed.
- Mail Box Latency: Delay in message processing.
- Queue Metrics: Queue-level throughput and performance.
- Network Buffer Usage: Network buffer consumption during job execution.
- Net Record Delta: Difference between input and output record counts.
- Records In: Number of records processed within the selected time range.
Vertex-Level Resource Usage
Each vertex represents a specific task or operator in the Flink job’s execution graph (for example, DataSource, Map, or Reduce).
The Vertex-Level Metrics section in Pulse displays detailed performance and resource utilization for each vertex, helping you analyze task efficiency and identify potential bottlenecks.
Time Series Metrics
The Time Series Information section provides time-based insights into the resource usage of the selected vertex.
You can toggle Show Aggregate to view cumulative data across all parallel tasks.
Resource Utilization
- CPU Load: Tracks the CPU utilization percentage for the vertex over time.
- Heap Usage: Displays memory usage from the Java heap space.
- Non-Heap Usage: Shows memory consumption from the non-heap area (for example, code cache, direct buffers).
- Metaspace Usage: Monitors class metadata memory used by the JVM.
- Thread Count: Displays the total number of active threads used by the vertex tasks.
For additional help, contact www.acceldata.force.com OR call our service desk +1 844 9433282
Copyright © 2026