
The Topic Details displays in-depth data of a single topic.
By default, you can view the details of the last hour. To view details of a custom time or timezone, select the icon and pick a date and timezone of your choice and click Apply.
The time and timezone are in accordance with the system time.
Summary Panel
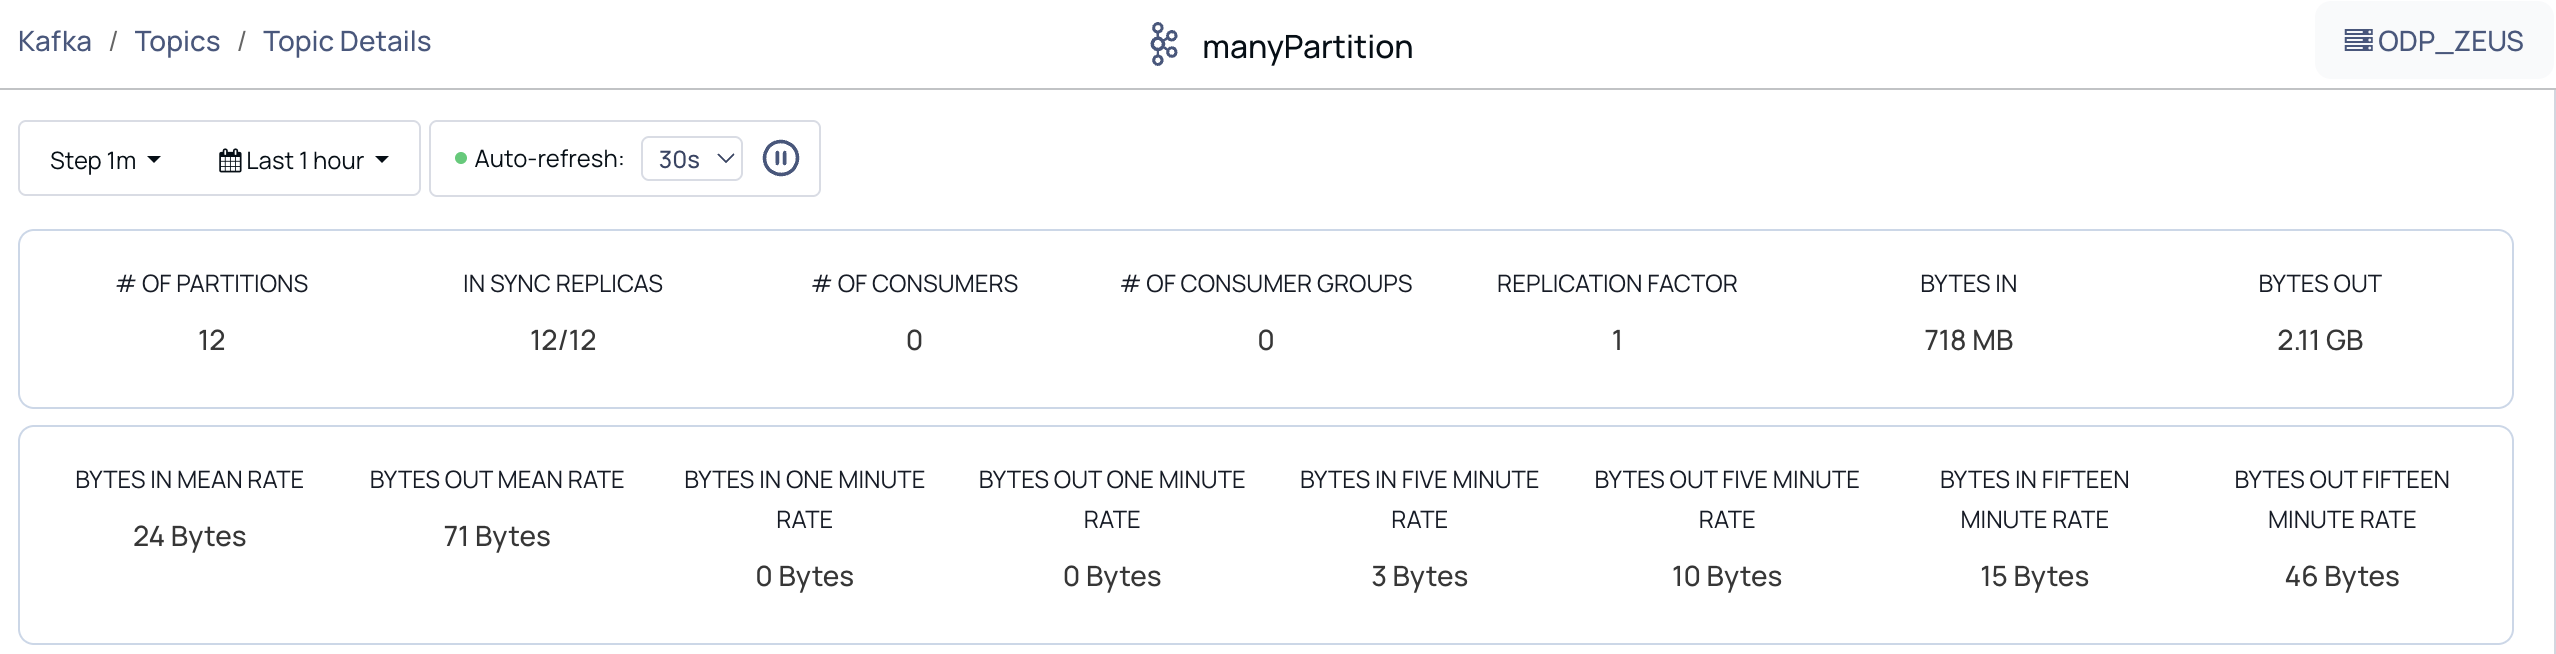
The summary panel displays the following metrics of a topic:
Metric | Description |
|---|---|
# of Partitions | Number of partitions created in the broker. |
In Sync Replicas | The number of topic replicas that are in sync with the topics in replication factor. |
# of Consumers | Number of consumers or subscribers of a topic. |
# of Consumer Groups | The total number of different consumer groups |
Replication Factor | Defines the number of copies a topic has in a Kafka cluster. These copies are used in the event of a failover. If Replication Factor is N, Kafka can tolerate up to N-1 failures. |
Bytes In | Amount of incoming data. |
Bytes Out | Amount of outgoing data. |
Bytes In Mean Rate | Average incoming byte rate |
Bytes Out Mean Rate | Average outgoing byte rate |
Bytes In One Minute Rate | Rate of incoming data per minute. |
Bytes Out One Minute Rate | Rate of outgoing data per minute. |
Bytes In Five Minute Rate | Rate of incoming data in five minute interval. |
Bytes Out Five Minute Rate | Rate of outgoing data in five minute interval. |
Bytes In Fifteen Minute Rate | Rate of incoming data in fifteen minute interval. |
Bytes Out Fifteen Minute Rate | Rate of outgoing data in fifteen minute interval. |
Data Chart
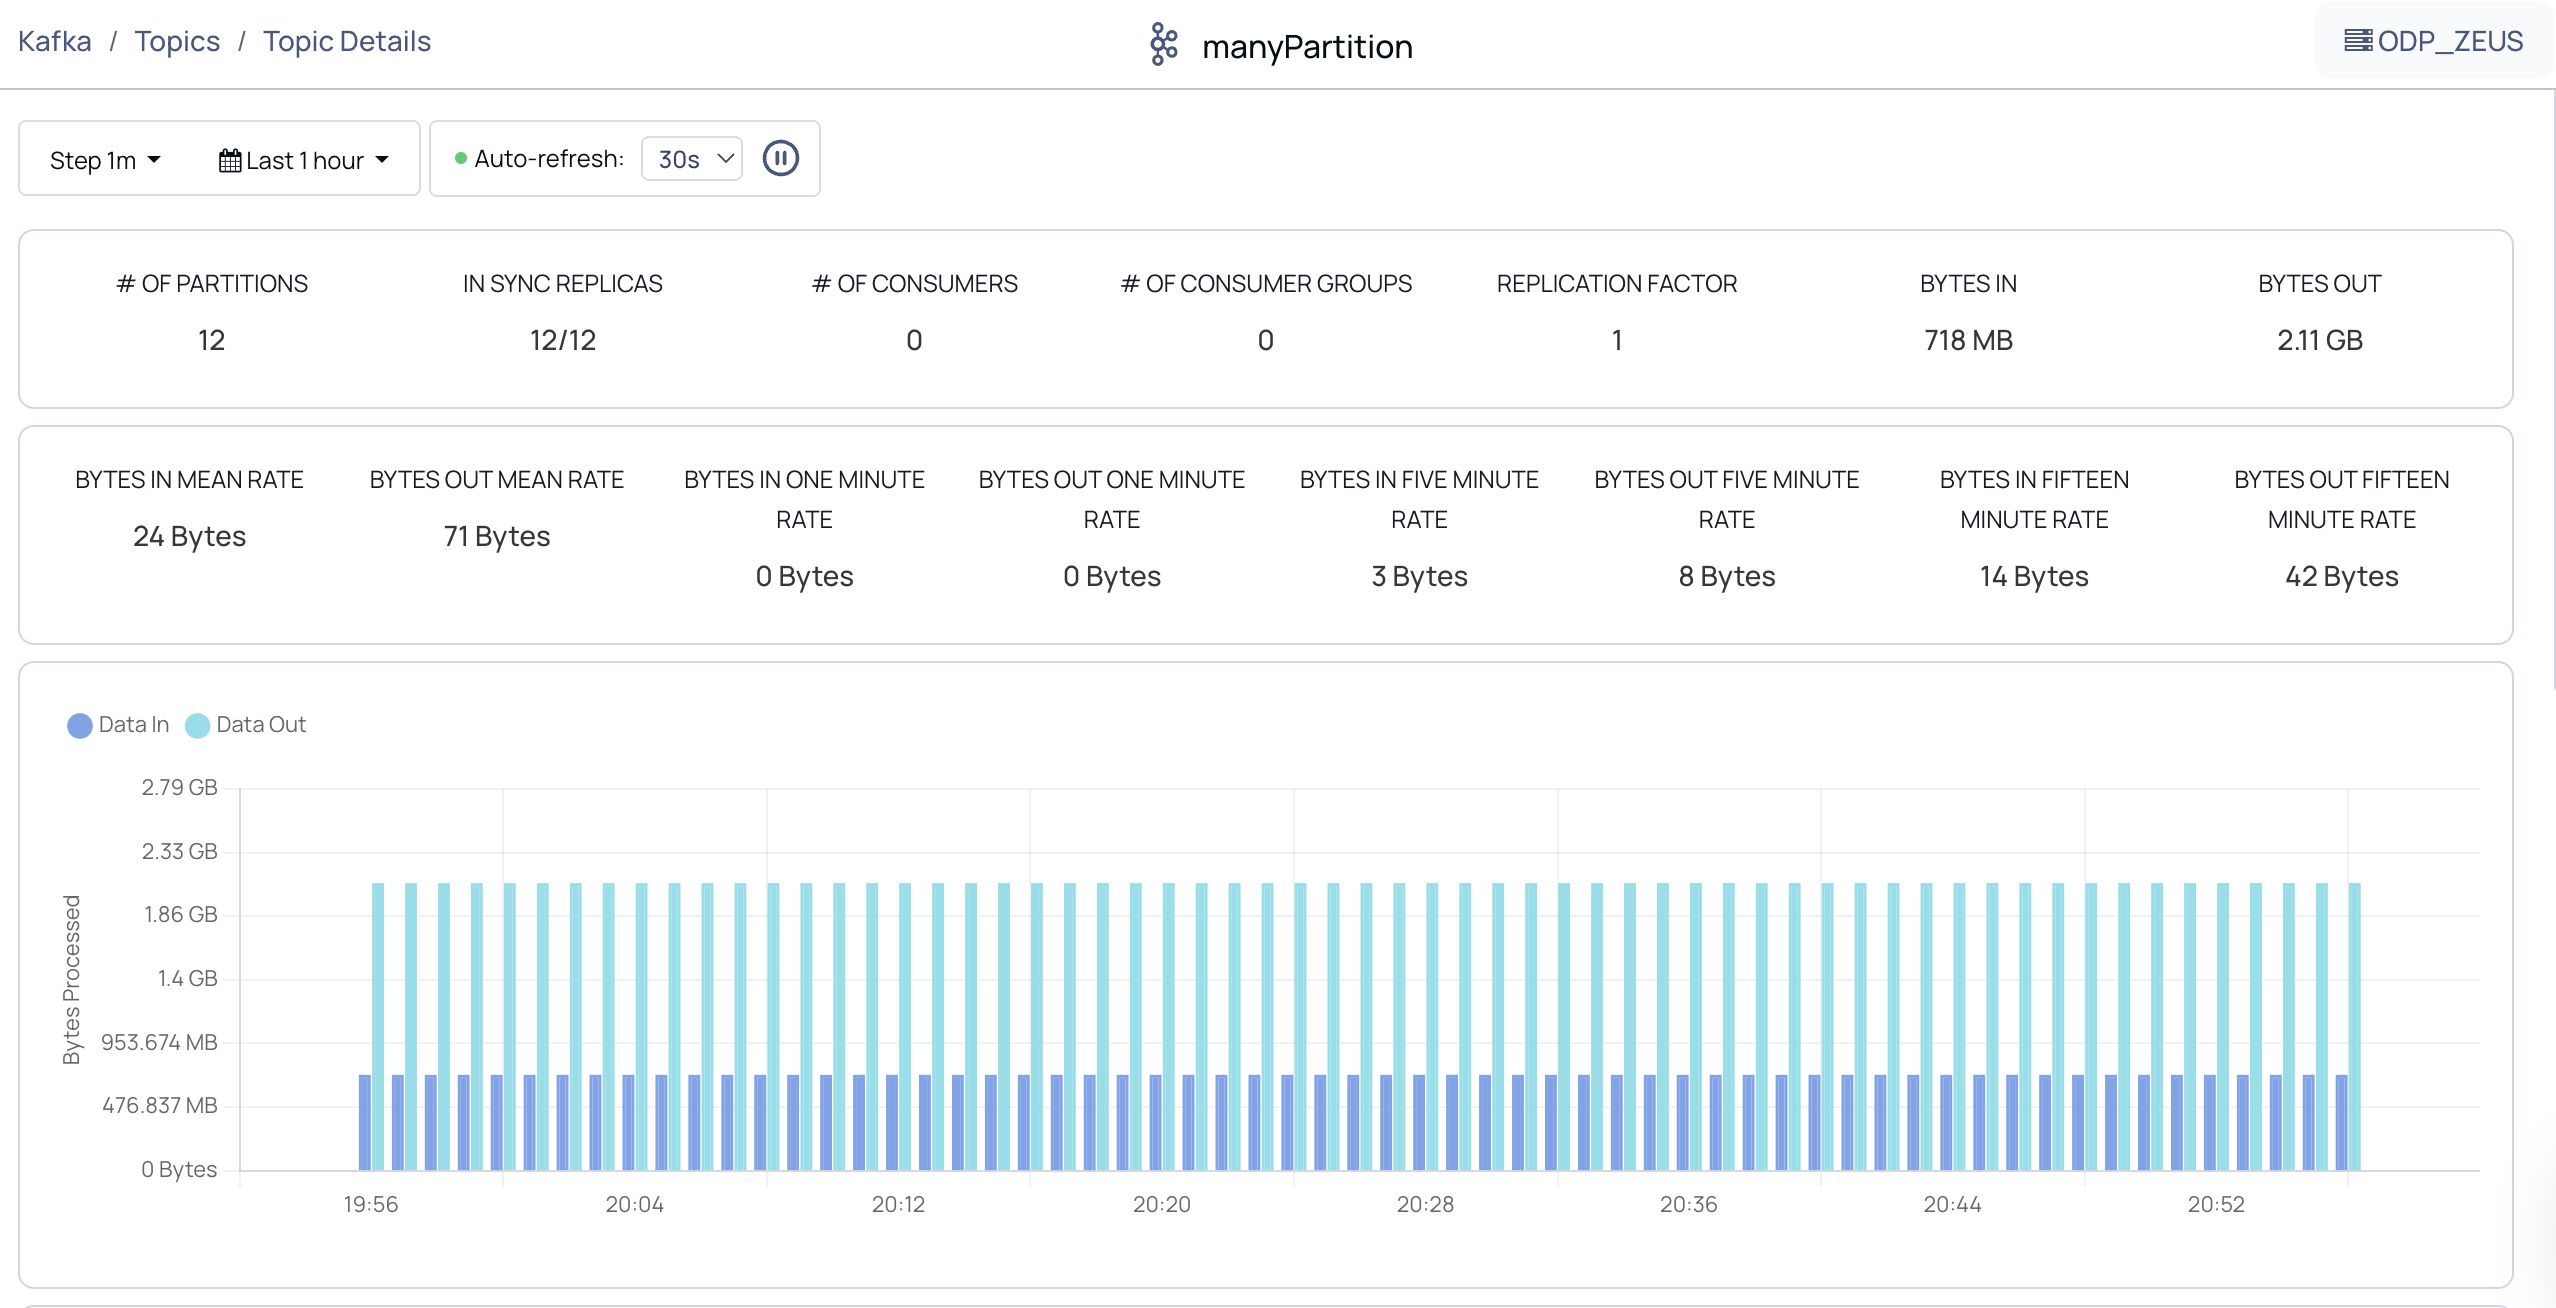
The first bar graph displays the incoming and outgoing data per second. Hover over the graph to view the data in and out at a particular time within the time frame you select.
NoteToggle between the views by clicking the toggle button.
Topic Message Chart
The second graph displays the number of incoming messages in a topic at a given time.
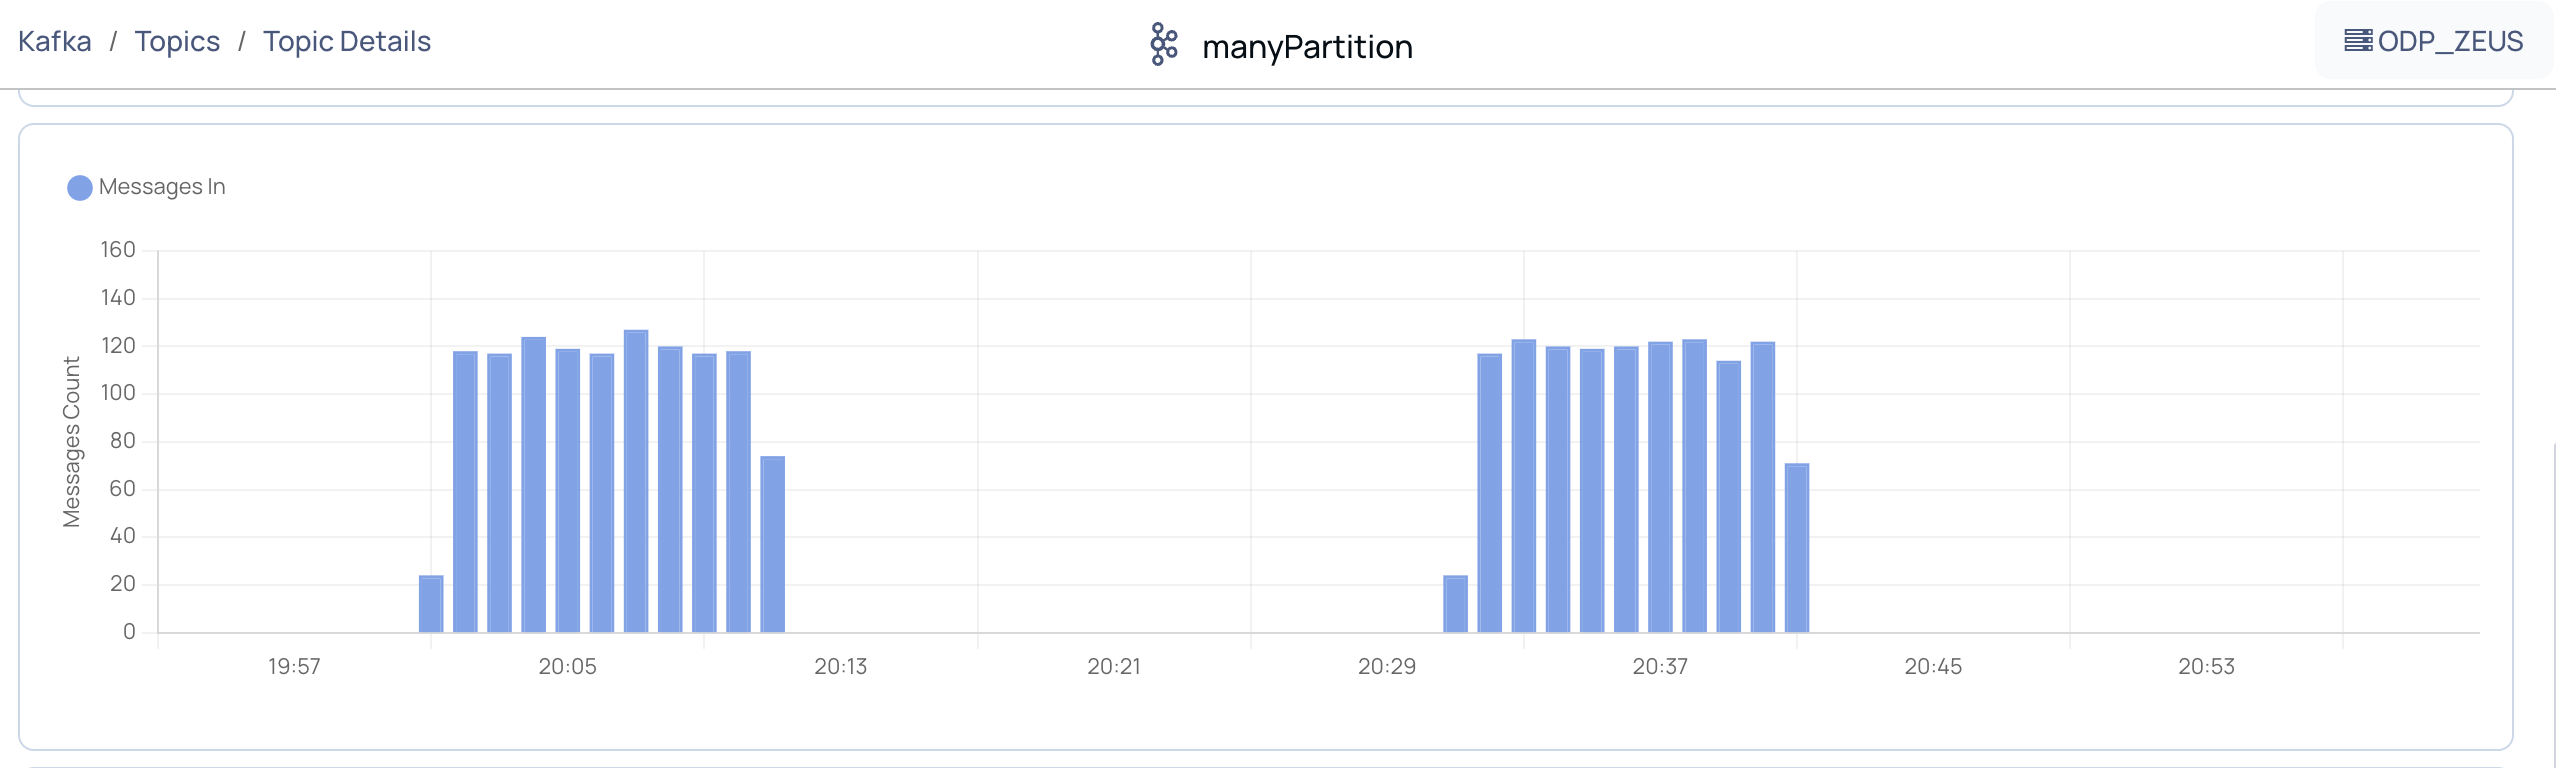

Toggle between the views by clicking the toggle button.
You can monitor the Data and Topic Message chart by the following views:
Bytes Processed: Represents the amount of incoming and outgoing at a given date and time. The graph displays Data In and Data Out.
Bytes Per Sec: Represents the amount of incoming and outgoing data per second. The graph displays Data In Per Sec and Data Out Per Second
Consumer Partition Details
This graph displays the number of records a partition of a consumer group is lagging behind by a producer. This data is represented on the basis of Offset lag per consumer. Hover over the bars chart to see the exact number of records that are lagging.
You can sort out the data by a particular consumer. Click the Consumer Group drop-down and select a consumer group.
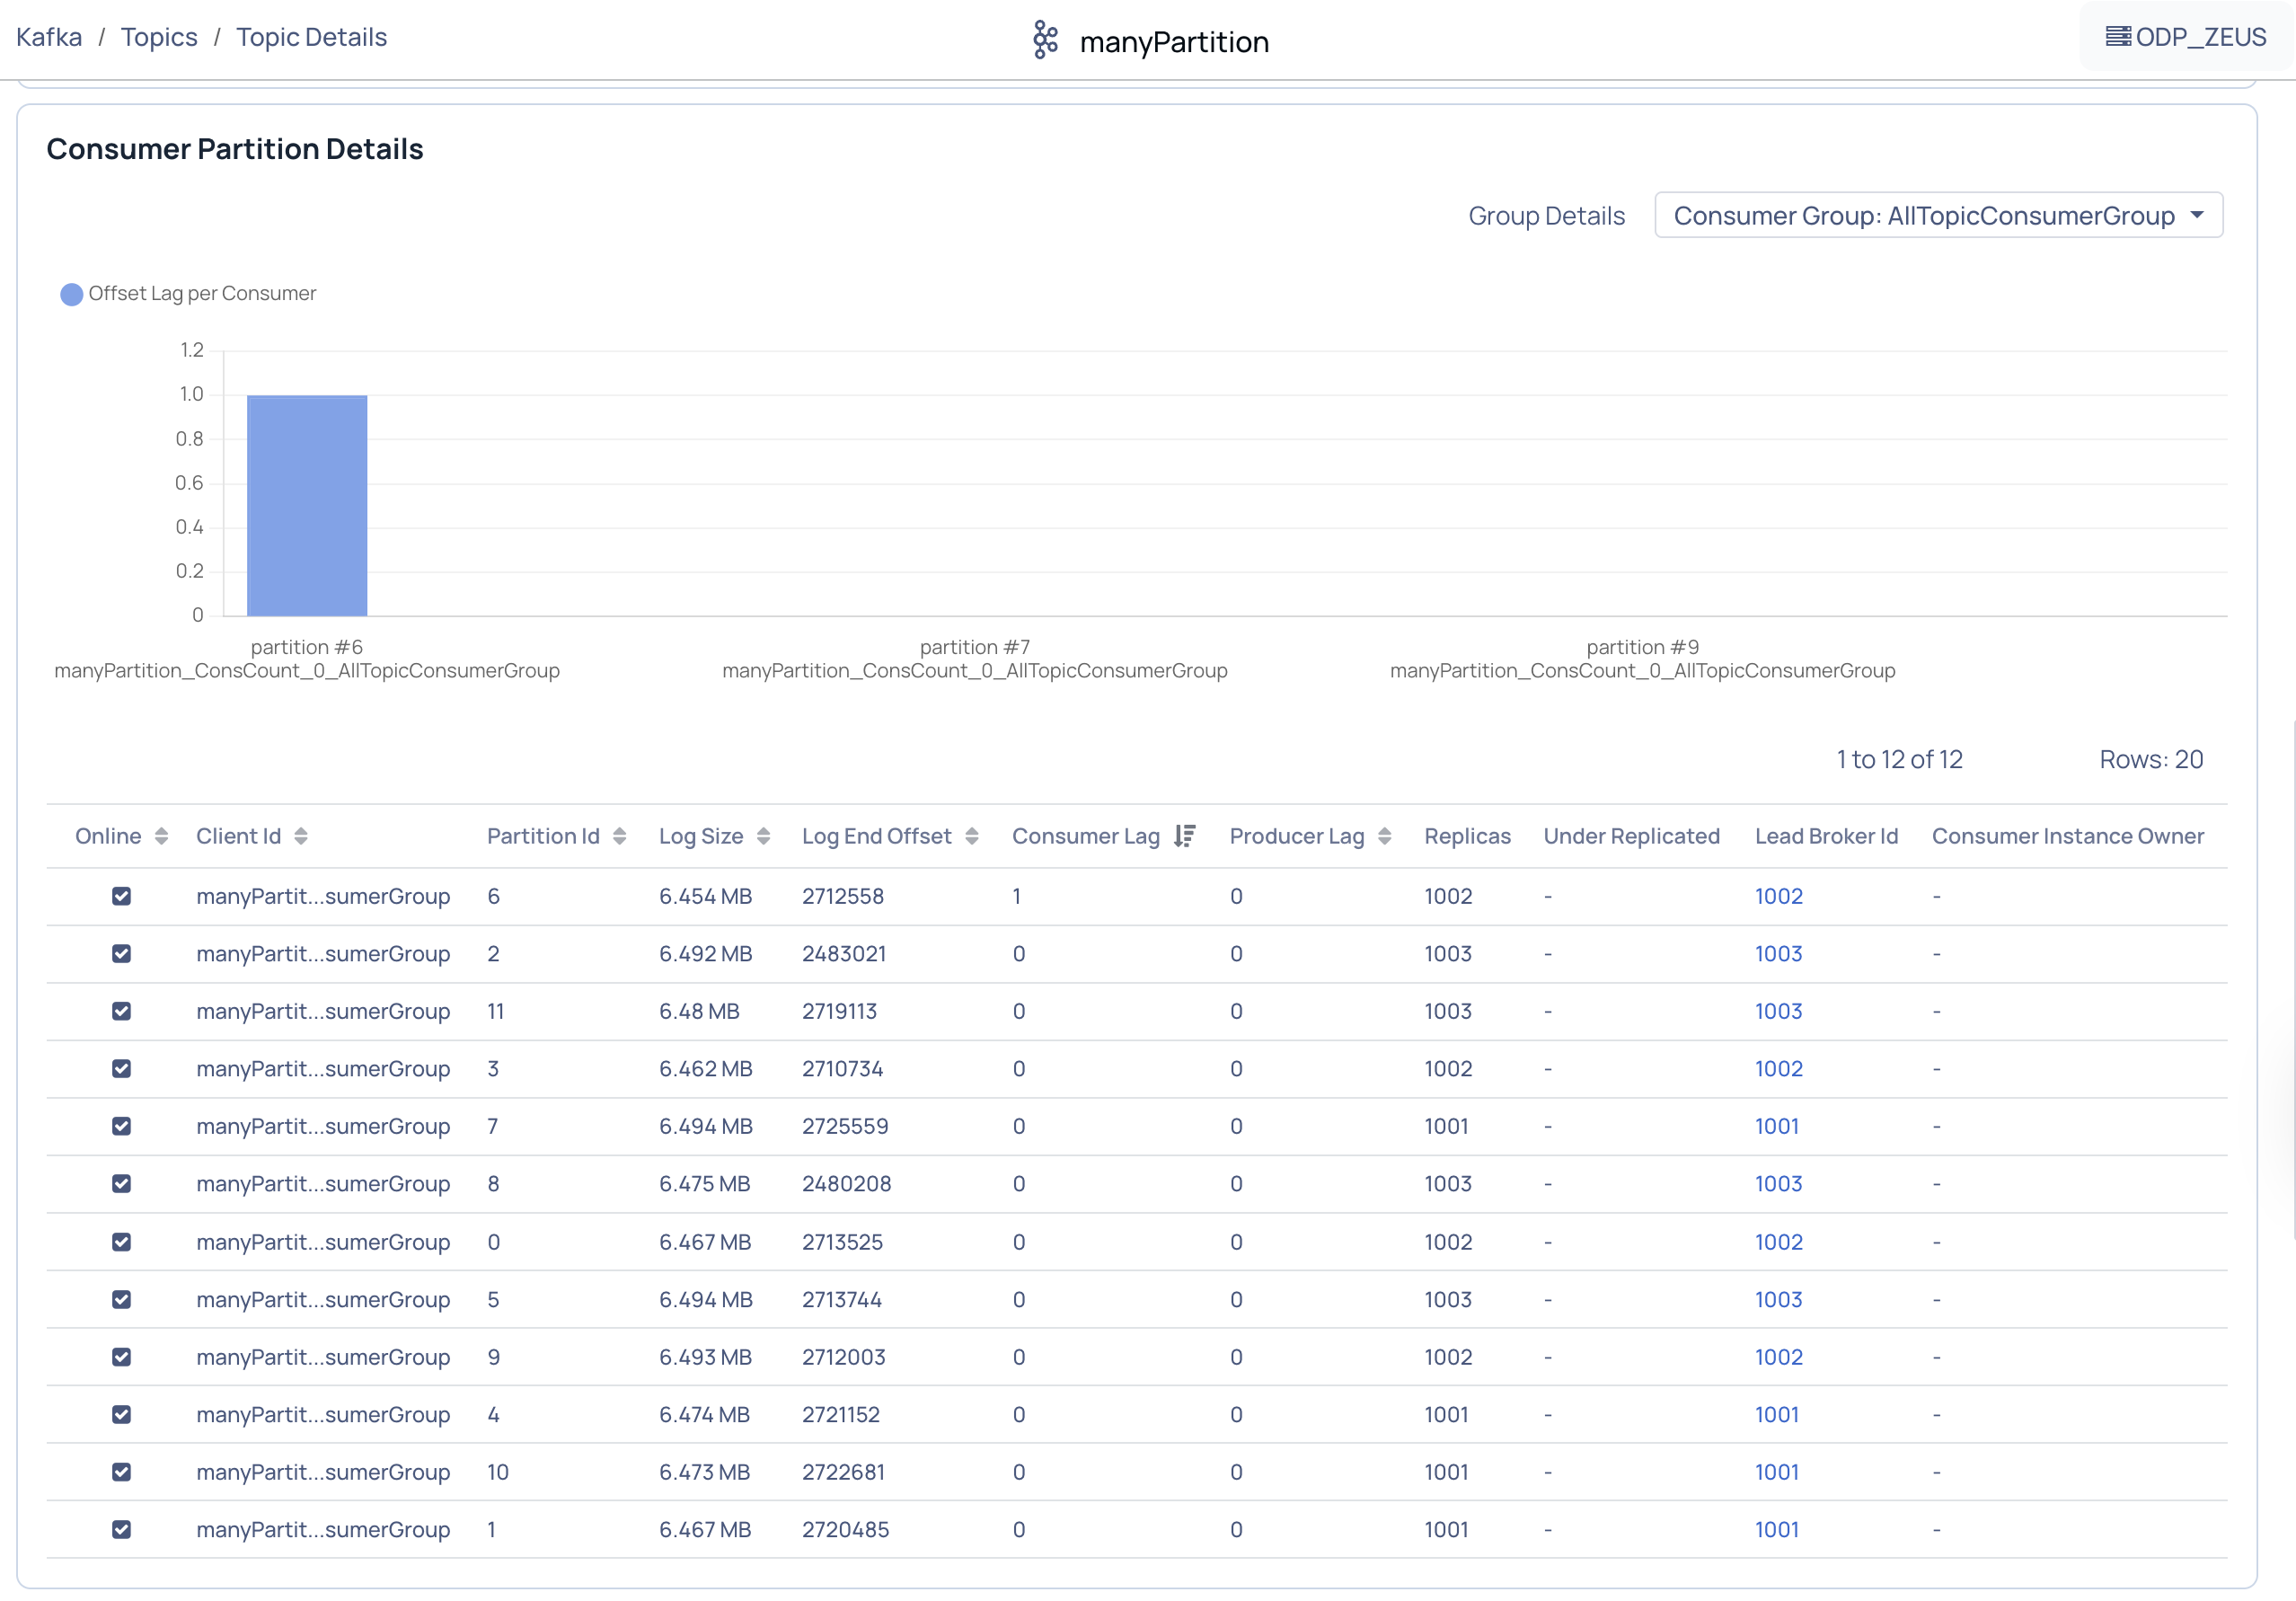
To access the Consumer Details page for the specified consumer group, click the Group Details button.
For more consumer partition details, you can view the following metrics.
Metric | Description |
|---|---|
Online | This state shows that the Kafka topic is online and receiving messages from the producer. |
Client ID | The client ID of the topic. |
Partition ID | The ID of partition in the consumer group. |
Log Size | Size of the partition log. The size is in general equally distributed which results to almost no skewness of data in the topic. |
Log End Offset | Number of records added to the end of a message written to a log. When you add new records, the value of log end offset increments by the number of new records. |
Consumer Lag | Number of records the consumer group is lagging behind by a producer or the delta value between the read and write records. |
Producer Lag | The number of records the producer group is lagging behind for upload. |
Replicas | IDs of the brokers where the replica of the partition is stored. |
Under Replicated | Number of partitions yet to be replicated. |
Leader Broker ID | The broker ID elected as the leader to receive read and write requests from consumers and producers. |
Consumer Instance Owner | The owner of the consumer instance. |
Inspect
The Inspect tile gives you a preview of your data.
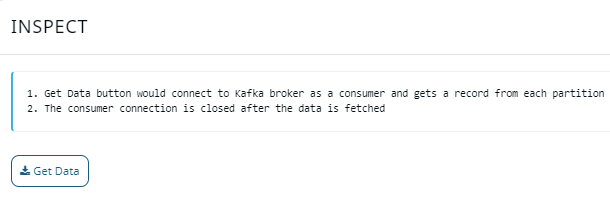
Click Get Data to view consumer data that reads messages from a topic. You can see data displayed in the following metrics.
Metric | Description |
|---|---|
Partition | The partition ID in the topic. |
Offset | A pointer to the last record consumed by a subscriber. |
Value | The value of data stored in Kafka cluster and displayed in JSON format. |
Topic Partition Chart
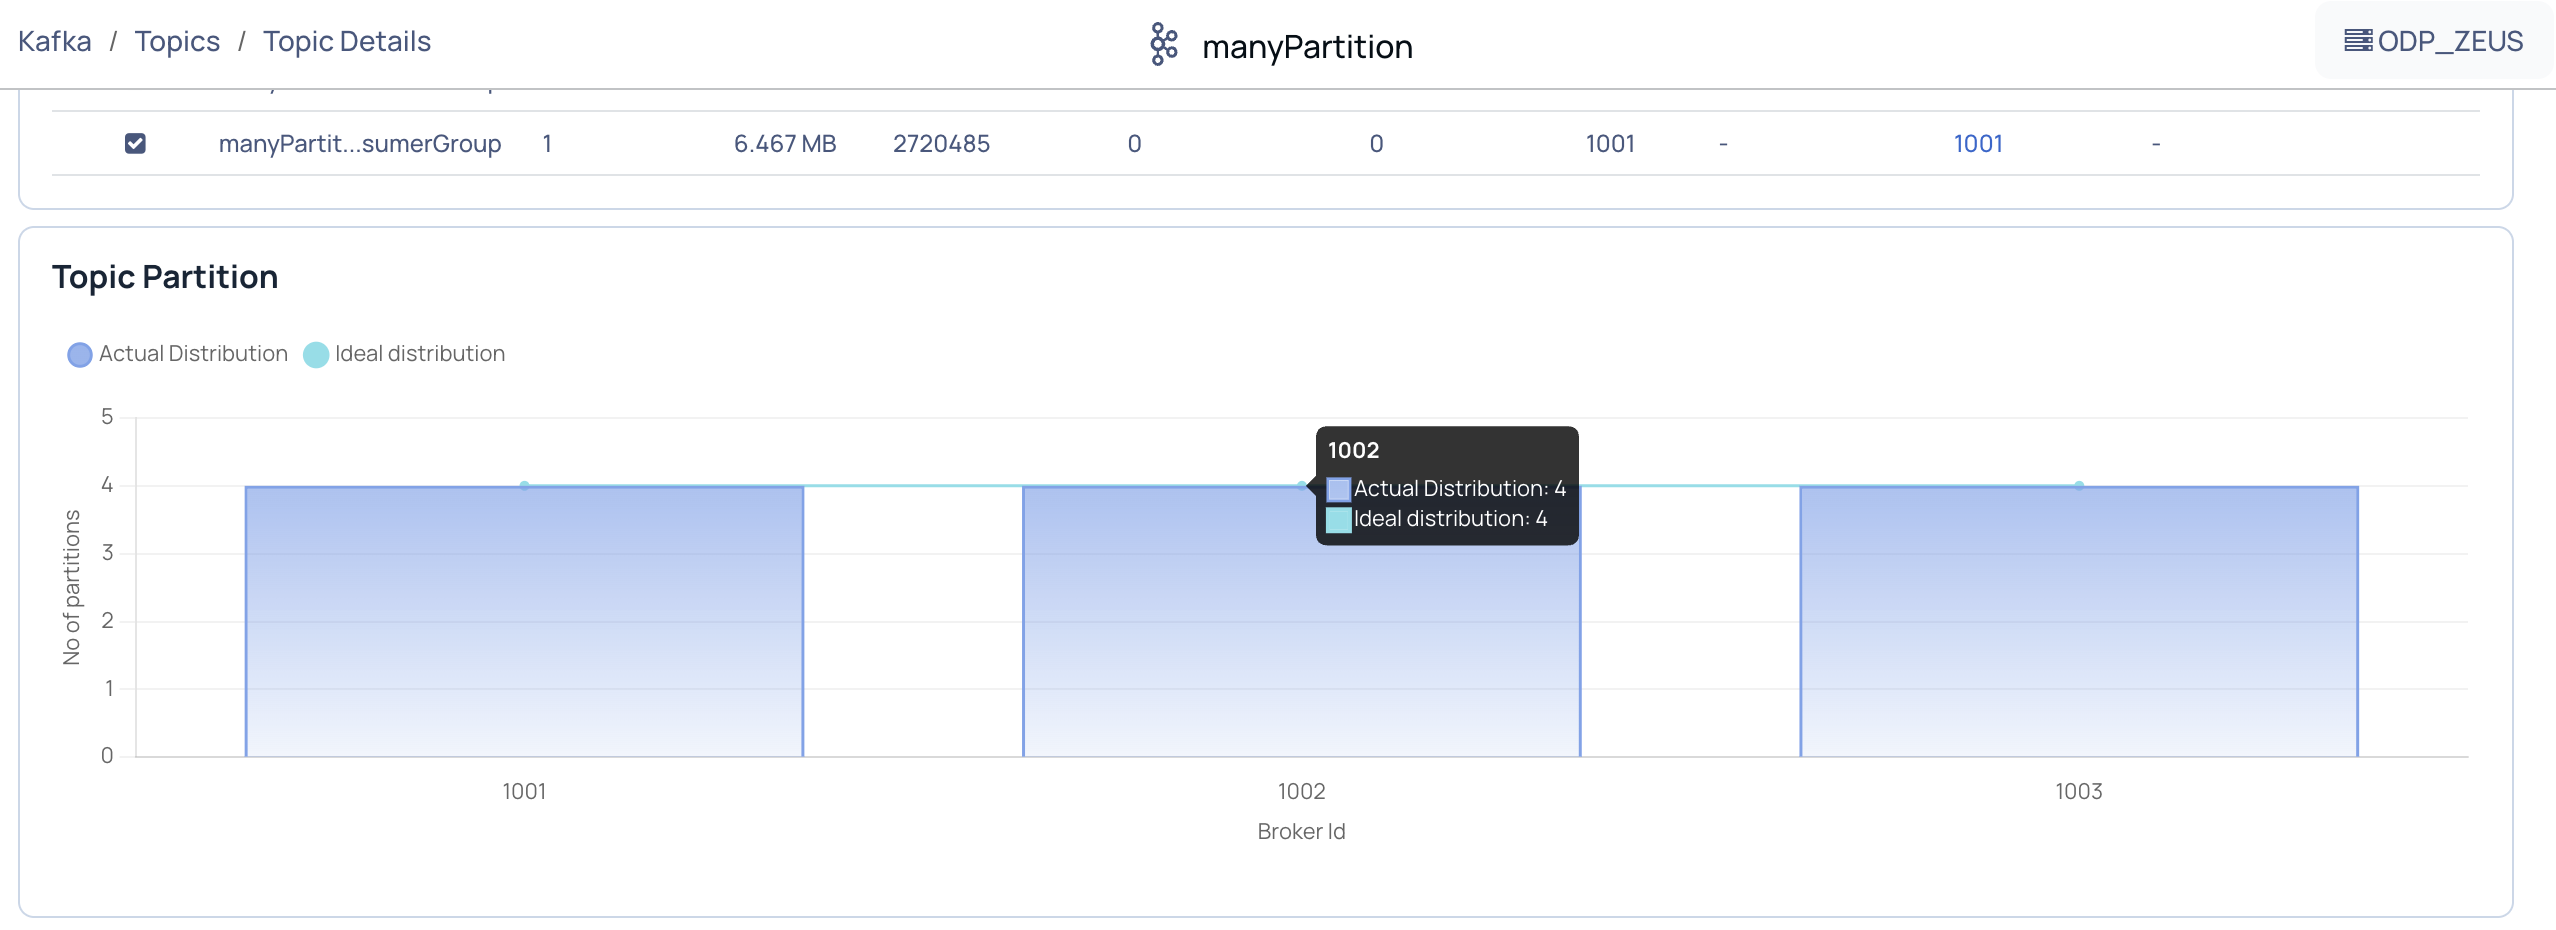
The bar chart displays actual and ideal number of topic partitions for a particular broker ID.
Broker Disk Distribution
The pie chart displays the number of disks, number of partitions in the disk, and the size of the respective disk partition for a particular broker ID at topic level.
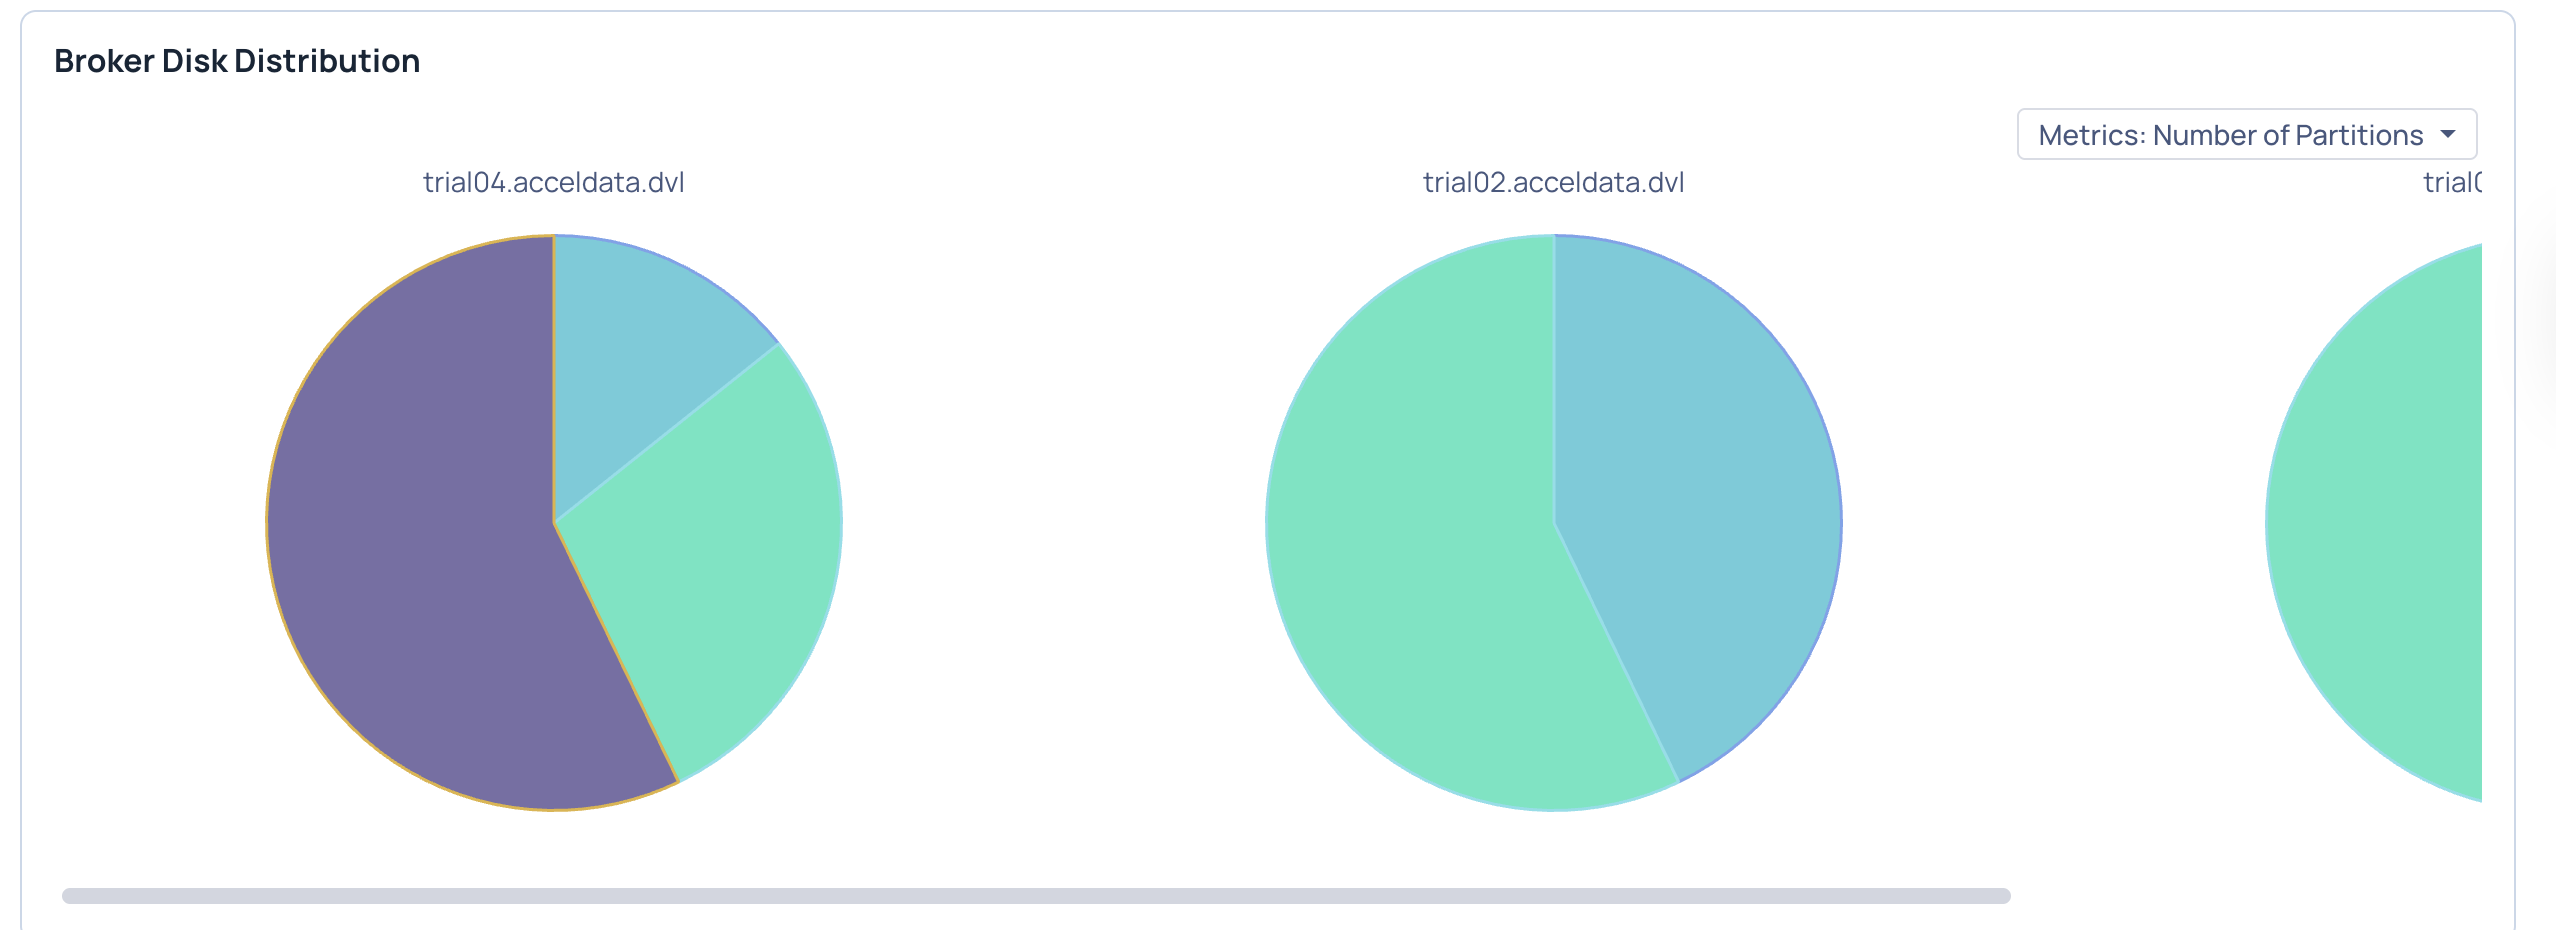
Note User can switch between the Size of Partition and Number of Partitions of the disk by changing the metrics.