
Batch Details panel displays the details of batches created by live input data streams that Spark streaming receives. You can view job details of every batch created. The following metrics are displayed in the top panel.
Metric | Description |
|---|---|
Batch Duration | The total time taken to complete processing jobs in a batch. |
Processing Time | The time taken to process data streaming jobs in the batch. |
Scheduling Delay | The time taken by the scheduler to submit the batch jobs. |
Total Delay | The total time taken (Scheduling Delay + Processing Time) by the scheduler to submit the batch jobs. |
Batch Output Operators
The Batch Output Operators panel displays data operations that can be pushed externally to database systems or file systems. The following metrics are displayed in this panel.
Click on any operation in the list to know more about that batch output operator.
Metric | Description |
|---|---|
Output Op Id | The ID of the output operation. |
Name | The name of the output operation. |
Status | The final status of the operation. |
Job Ids | The ID of jobs the batch output operation is processing. |
Duration | The duration of the jobs in that batch operation. |
Error | The error code of the error that ocurred in that batch output operation. |
Within the output operator, you can view following details of stage IDs.
Description: The description of the tasks in the stage.
Status: The final status of the stage, whether Succeeded or Failed.
Time Taken: The time taken to complete processing the stage.
Metrics
Metric Group | Metric Name | Description |
|---|---|---|
Shuffle | Shuffle Read | Amount of shuffling data read (in bytes). |
Shuffle Read Records | Number of records of shuffle read. | |
Shuffle Write | Amount of shuffling data written (in bytes). | |
Shuffle Write Records | Number of records of shuffle write. | |
CPU | Executor CPU Time | Total CPU time taken by the executor to run the task. |
Executor Run Time | Time taken by the executor to run the task. | |
Disc | Input Bytes | The amount of input bytes read during the task. |
Input Records | The number of input records read. | |
Output Bytes | The amount of output bytes written during the task. | |
Output Records | The number of output records written. | |
Other | Number Of Tasks | The number of tasks in the stage. |
Complete Tasks | The number of completed tasks. | |
Active Indices | The number of indices currently running in the stage. | |
Completed Indices | The number of indices that completed execution. | |
Failed Tasks | The number of tasks that failed execution. | |
Killed Tasks | The number of tasks that terminated. | |
Disk Bytes Spilled | The amount of deserialized form of data on the disk at the time the data is spilt. | |
Memory Bytes Spilled | The amount of deserialized form of data in memory at the time the data is spilt. |
DAG
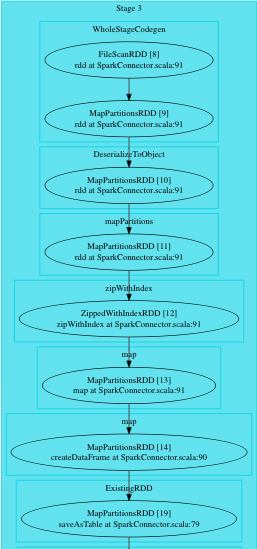
The Direct Acyclic Graph (DAG) displays a flow diagram of the Spark job.
DAG is a work scheduling graph with finite elements connected in edges and vertices. These elements are also called RDDs (Resilient Distributed Datasets). The RDDs are fault-tolerant in nature.
The order of execution of the jobs in DAG is specified by the directions of the edges in the graph. The graph is acyclic as it has no loops or cycles.
Task Distribution
The task distribution tab displays how tasks are distributed across the following metrics over percentile values.
Metric | Description |
|---|---|
Duration | Time taken by the stages to complete. |
Scheduler Delay | The waiting time of the task to be scheduled for execution. |
Task Deserialize Time | Time taken to deserialize tasks. |
Gc Time | Time spent by the JVM in garbage collection while executing a task. |
Result SerializationTime | Time spent to serialize a task result. |
Getting Result Time | The time taken by the driver to collect task results. |
Peak Execution Memory | The memory used during shuffles, aggregations, and joins by internal data structures. |