
The Spark Jobs page provides charts with jobs by users and by queue. The page also provides detailed information about Spark jobs categorized by name of the job, users running the job, queue in which the job is run, status of the job, and other criteria.
Go to Spark > Jobs to view the Spark Jobs page.
The default time is Last 24 hrs. To change the timeline, click the down arrow in the time selection menu.
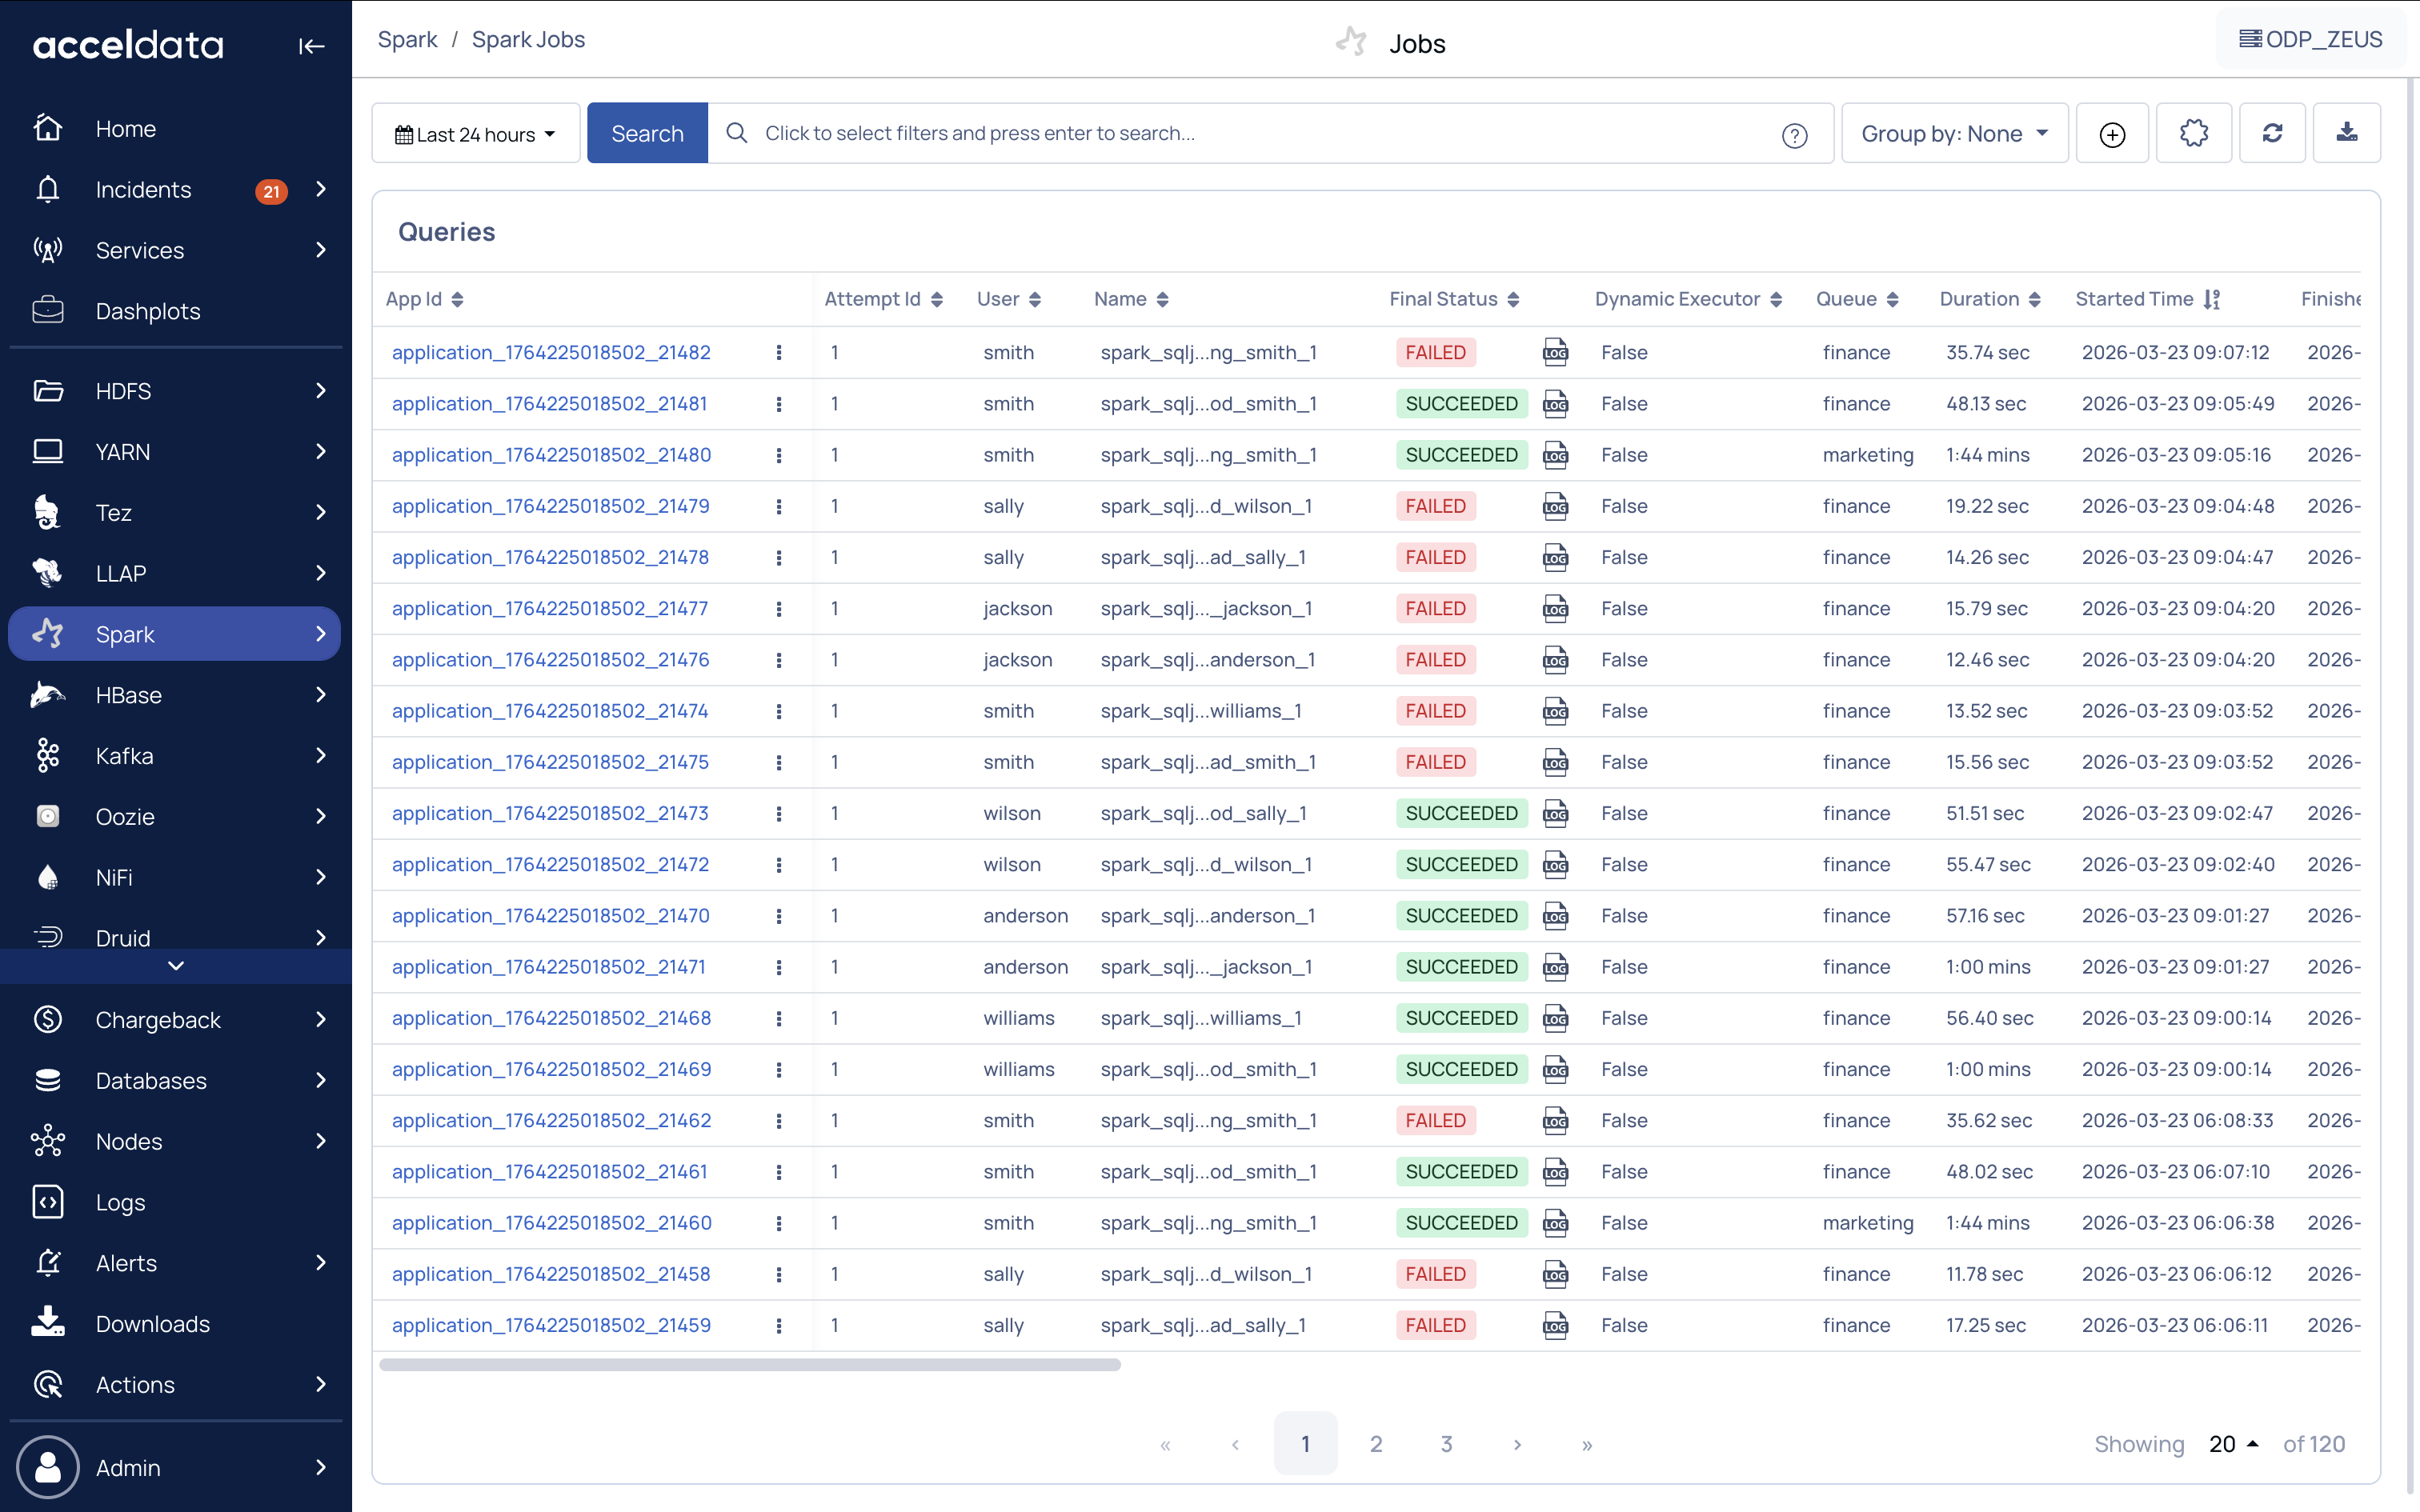
Metrics
The Spark Metrics page provides detailed execution and resource usage information for Spark applications.
Application Details
App Id – Unique identifier of the Spark application
Attempt Id – Execution attempt identifier
User – User who submitted the application
Name – Application name
Final Status – Final state (Succeeded/Failed/Killed)
Dynamic Executor – Indicates if dynamic allocation was enabled
Queue – YARN/cluster queue used
Deployment Mode – Indicates the Spark application deployment mode (Client Mode or Cluster Mode)
Time and Duration
Duration – Total runtime of the application
Started Time – Start timestamp
Finished Time – End timestamp
Resource Utilization
Max App Memory – Maximum memory used by the application
Max App Core – Maximum cores used
Avg Memory – Average memory consumption
Memory Time – Memory usage over time
Avg VCore – Average virtual cores used
VCore Time – VCore usage over time
Used Containers – Total containers allocated
Maximum Driver Executor Memory - The maximum driver executor memory used by a job.
Performance Metrics
GC Time – Time spent in garbage collection
Shuffle Read Records – Records read during shuffle
Shuffle Write Records – Records written during shuffle
Shuffle Read Memory – Shuffle read size in memory
Shuffle Write Memory – Shuffle write size in memory
Executor and Driver Metrics
Max Executor Memory – Peak executor memory usage
Max Driver Memory – Peak driver memory usage
Job Health
Error Categories – Classification of errors encountered
Total Jobs – Total jobs executed
Failed Jobs – Number of failed jobs
Optimization
Indicates whether Gluten acceleration was enabled for the Spark job.
By default, the Gluten Enabled column is hidden. To display it:
Click the Settings (⚙) icon on the Spark Jobs page.
Enable the Gluten Enabled column.
If the value is True, you can click the corresponding job to view detailed execution information. For details, see Gluten SQL/DataFrame.
Group by
Click Group-By drop-down menu in the top right corner of the page, the drop-down menu is displayed.
Select the type of grouping you want to display from the following list:
Queue
User
Name
Status
The details by selected type is grouped in the table.
(Optional)To ungroup the queries, select Ungroup.
The following tables describe the metrics displayed for each job group:
Metric | Description |
|---|---|
Group Name | The name of the group. |
Job Count | The total number of jobs associated by a particular group. |
Failed Jobs | The total number of failed jobs associated by a particular group. |
Running Jobs | The total number of running jobs associated by a particular group. |
Avg Duration/Job | The average time taken to execute a job by a particular group. |
Total Duration | The total time taken to execute jobs by a particular group. |
Avg Mem/Job | The average amount of memory consumed by a particular job group. |
Total Mem | The total memory consumed by a particular job group. |
Avg VCore/Job | The average number of VCores used by a particular job group. |
Total VCore | The total number of VCores used by a jobs by a particular group. |
Click on the group row to view the details of the jobs in that group. The following tables describes the metrics displayed for each job:
Metric | Description |
|---|---|
App ID | The application ID of the job. To display the concurrency of the job, click ... icon and click View Concurrency. |
Attempt ID | The number of attempts made by the job. |
User | The name of the user who executed the job. |
Name | The name of the spark job. To copy the name of the job, hover over the name you want to copy and click the icon. The name of the job is copied to clipboard. |
Final Status | The final state of the Spark job. The following are the status: Failed, Finishing, Killed, Running, Succeeded. Click the log icon to view the Troubleshoot Using Application Logs for a specific job**.** |
Dynamic Executer | Displays the execution condition for Spark Jobs such as True or False. Note The Simulation tab will not appear in the Reports if the Dynamic Executor is set to True. |
Queue | The name of the queue that the job belongs to. |
Duration | The total time taken to execute the job. |
Started Time | The starting time of the job |
Finished Time | The job's completion time. |
Memory | The amount of memory consumed in executing the job. |
VCores | The number of VCores used in job processing. |
Click the App ID to view more details about the job in the Spark Job Details page.
Filtering Spark Jobs
To filter the data you want to view in the table, click the filter drop-down menu and select the filters.
You can search for the required filter using the Search box provided in the drop-down menu. Click Reset to clear the applied filter.
Searching Spark Jobs
You can use the search box to search for a job. For example, the name of the parameter visible in the UI is User. However, internally, the parameter name is effective_user. Hence, if you want to search for queries with User = Mark, you need to type effective_user:Mark.
Click Reset to clear the applied filter.