The Spark Job Details page provides comprehensive visibility into the execution and performance of an individual Spark application. It enables administrators and data engineers to investigate application behavior, analyze resource utilization, monitor stage and task execution, and identify performance bottlenecks.
With xObserve, you can:
Troubleshoot failed or slow-running Spark applications.
Identify inefficient stages and execution bottlenecks.
Analyze driver and executor resource utilization.
Monitor stage, task, and job execution behavior.
Compare application runs to understand performance differences.
Investigate scheduling delays and workload inefficiencies.
Gain insights into Spark execution plans and optimization opportunities.
Navigation Steps
In the xObserve UI, navigate to Spark > Jobs from the left navigation pane.
Select the desired cluster from the cluster selector in the upper-right corner.
Locate the Spark application you want to investigate.
Click the Application ID.
The Spark Job Details page opens, displaying execution metrics, resource utilization, job breakdowns, timelines, and performance analytics for the selected Spark application.
Spark Application Summary
The top section provides a high-level overview of the Spark application execution.
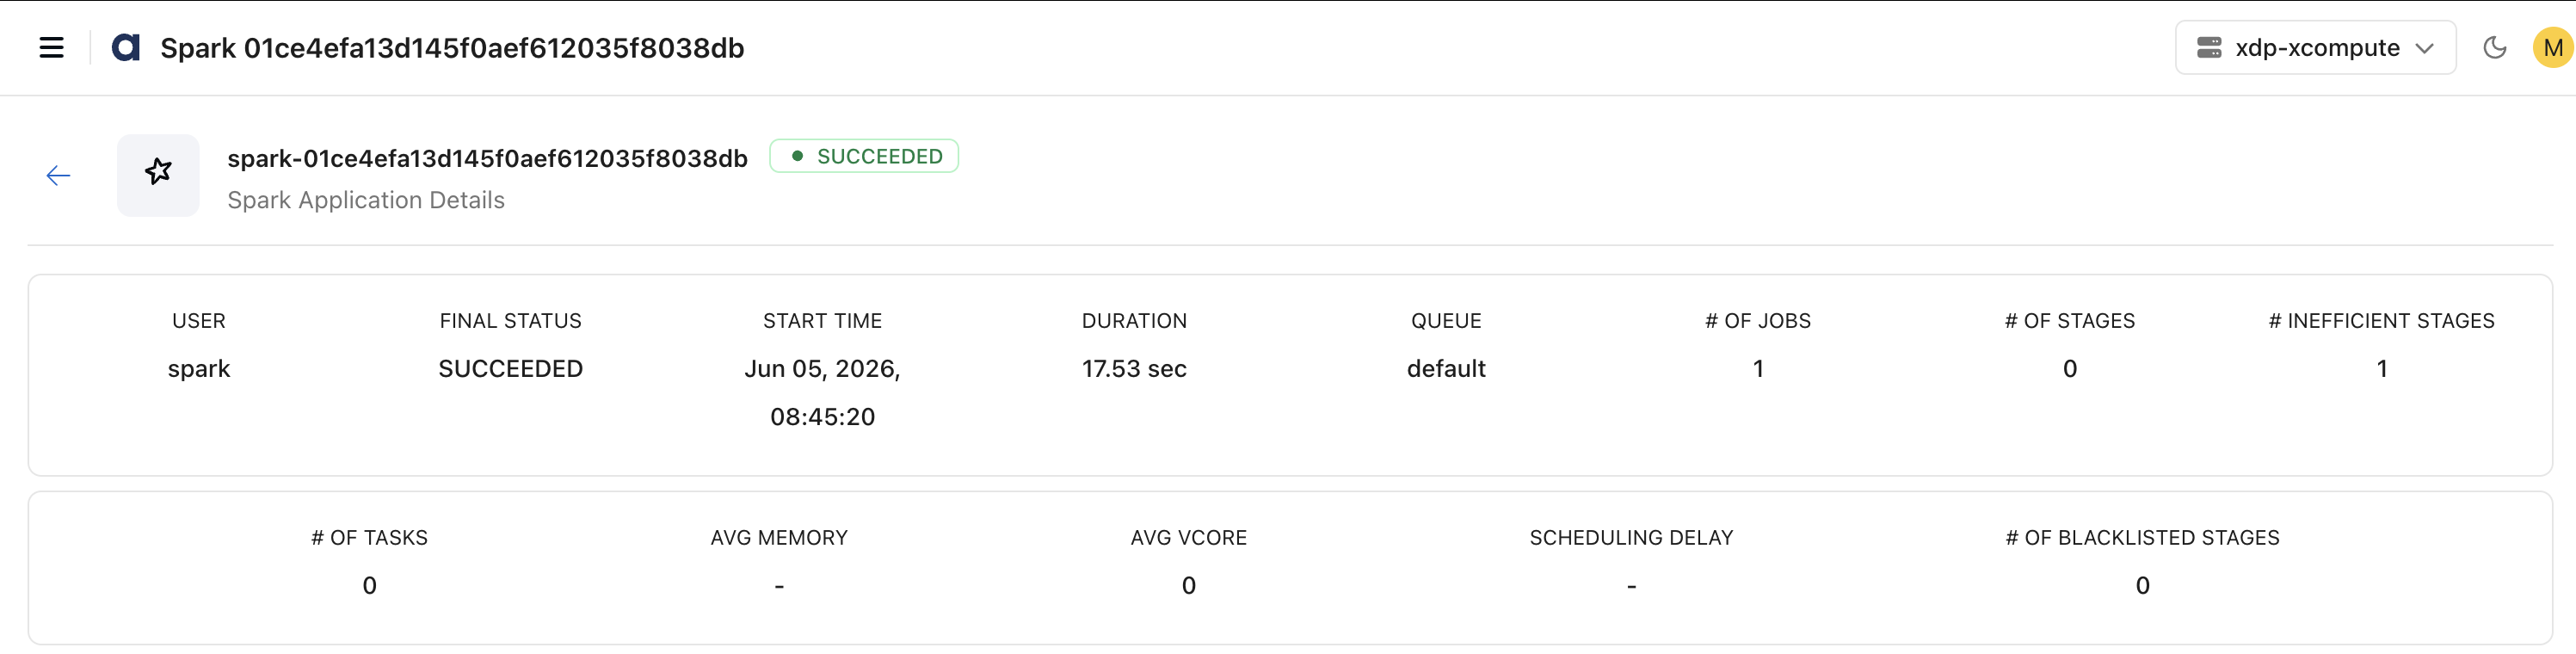
Application Information
View key execution details such as:
Application ID
User
Final Status
Start Time
Duration
Queue
Execution Statistics
Monitor execution-level metrics including:
Number of Jobs
Number of Stages
Number of Tasks
Inefficient Stages
Blacklisted Stages
Average Memory Usage
Average vCore Usage
Scheduling Delay
Use these metrics to understand workload scale and overall execution health quickly.
Job Trends
The Job Trends section compares historical executions of the same Spark application.
Track metrics such as:
Elapsed Time
vCore Usage
Memory Consumption
Input Data Read
Use this view to:
Compare current execution against previous runs
Identify performance regressions
Detect workload growth trends
Validate tuning improvements
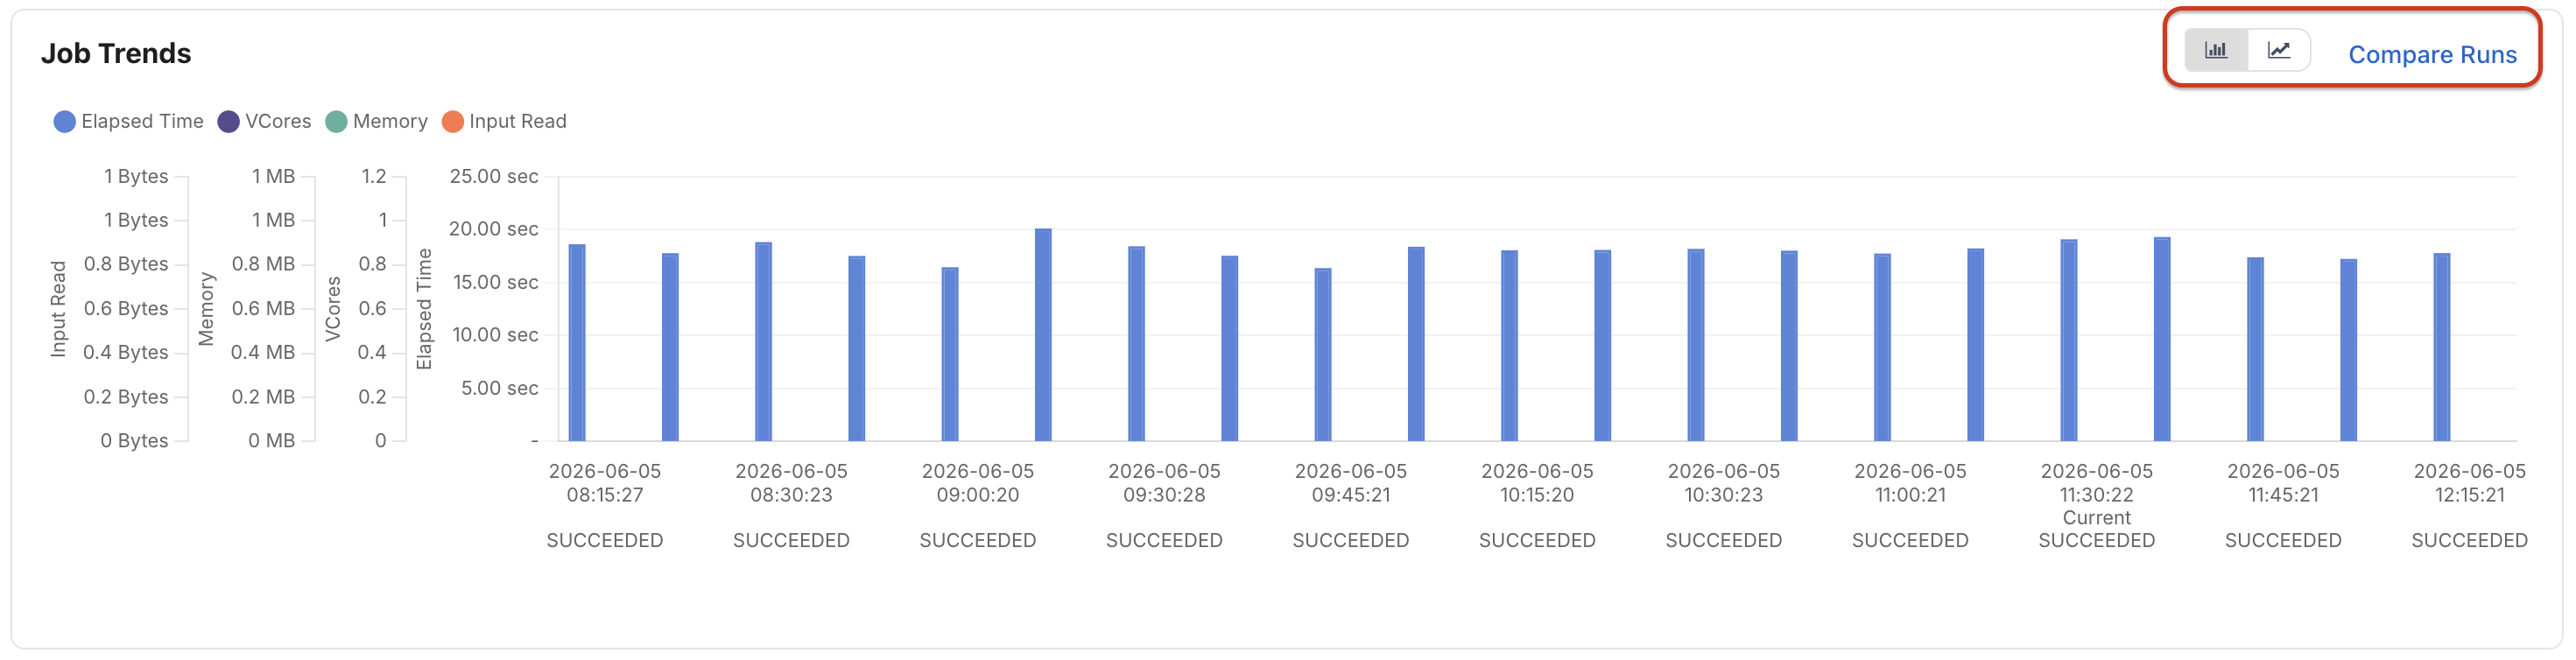
Compare Runs
Use Compare Runs to compare two Spark application executions and identify differences in performance, resource utilization, and runtime configuration.
The comparison view allows you to select two Spark application IDs and analyze their execution characteristics side by side.
Metric Comparison
The Metric tab compares key execution metrics between the selected application runs, including:
Execution Time
Application ID
Start Time
End Time
Driver Cores
Executor Cores
Driver Memory
Executor Memory
Dynamic Executor Settings
Application Attempts
For each metric, the comparison view displays:
Left Application Value
Right Application Value
Percentage Difference (when applicable)
Use this view to identify performance regressions, execution anomalies, and resource utilization differences across runs.
Configuration Comparison
The Config tab compares Spark configuration properties used by each application execution.
Examples include:
Spark Application ID
Driver Host
Driver Address
Spark UI Proxy Settings
Application Start and Submit Times
JAR Locations
Driver and Executor Configuration Parameters
Spark Runtime Properties
Configuration comparison helps identify changes that may have impacted performance, execution behavior, or resource consumption.
Use Cases
Use Compare Runs to:
Investigate performance regressions.
Validate Spark tuning changes.
Compare resource allocation between executions.
Analyze the impact of configuration modifications.
Troubleshoot differences in execution behavior across application runs.
Configuration Details
The Configurations section displays the Spark resources allocated to the application.

Configuration information includes:
Number of Cores
Number of Executors
Executor Memory
Driver Cores
Driver Memory
Use this information when analyzing performance issues related to resource sizing or workload tuning.
Spark Jobs
The Spark Jobs section provides a breakdown of all jobs executed within the Spark application.
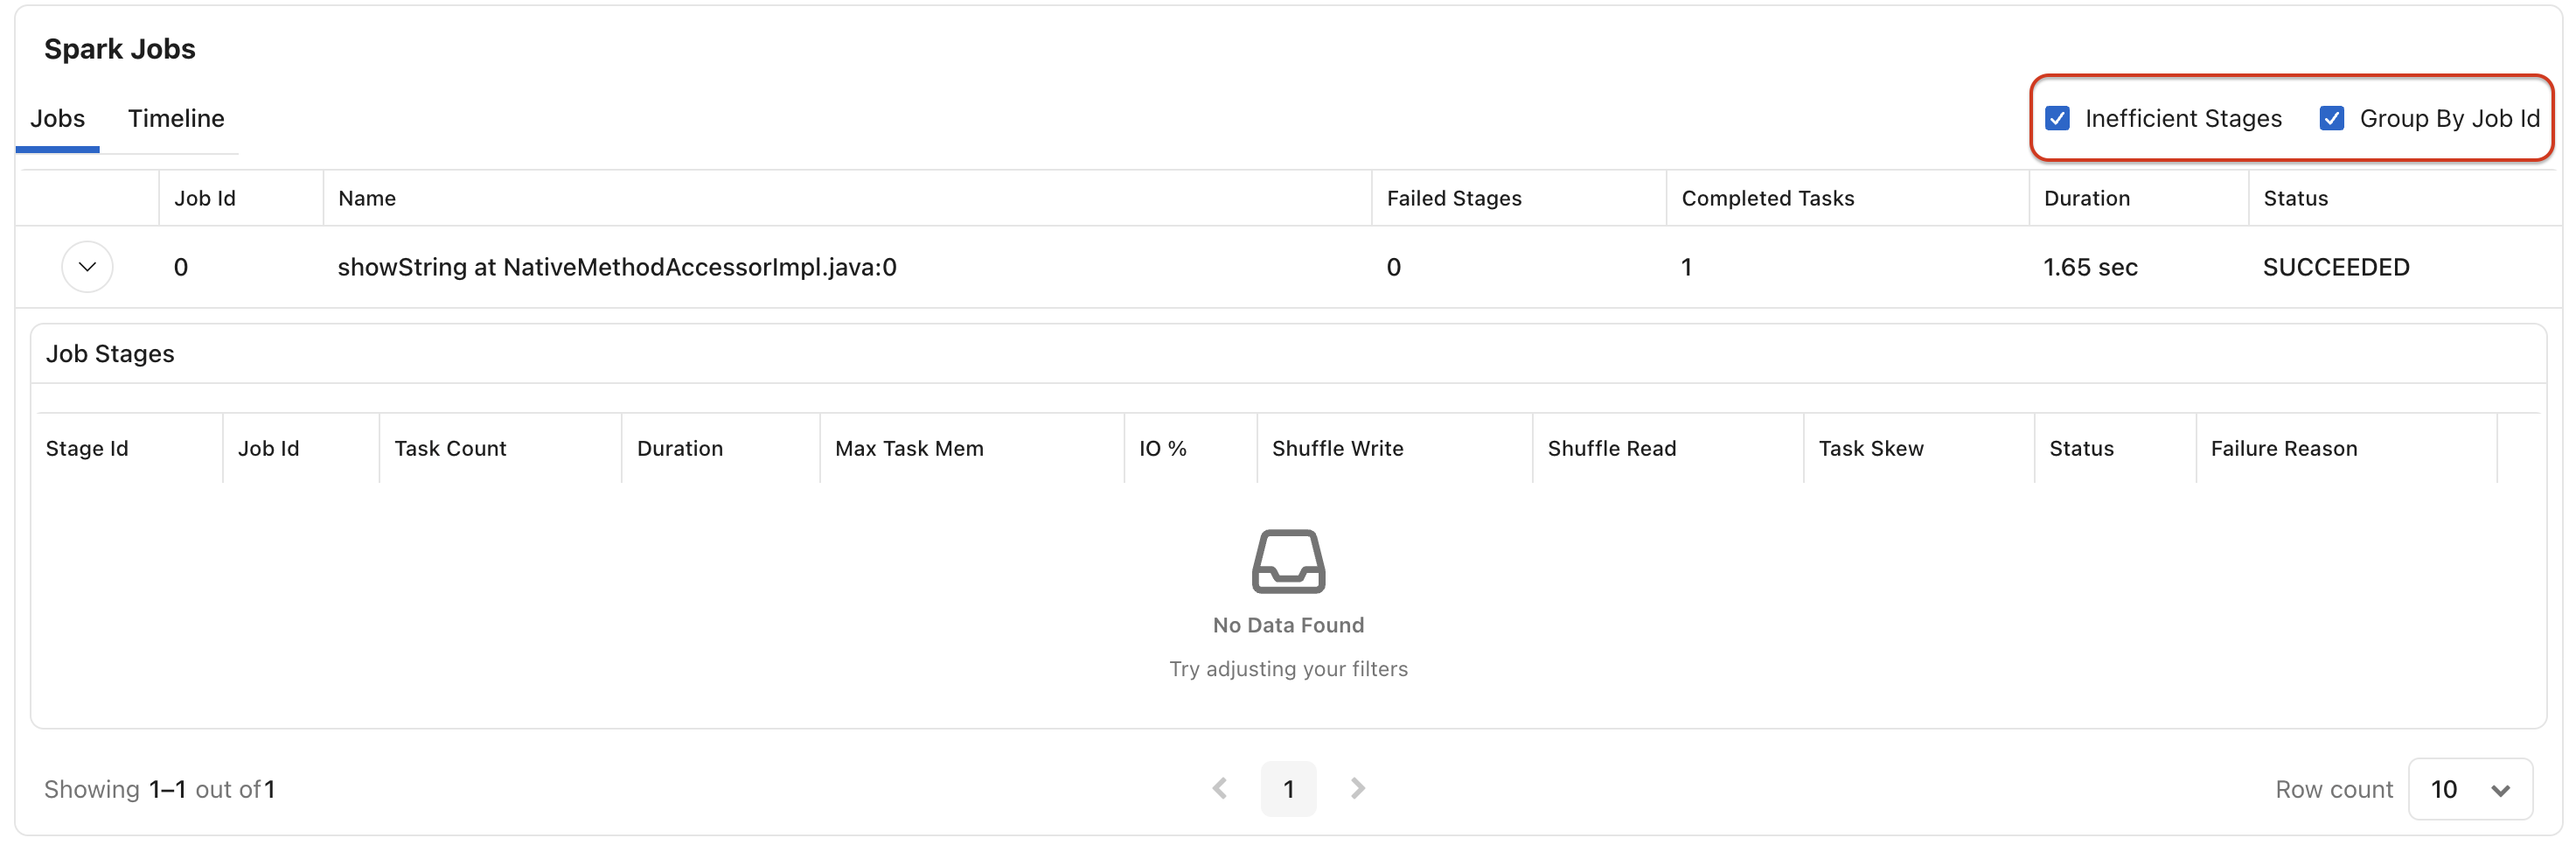
For each job, view:
Job ID
Job Name
Failed Stages
Completed Tasks
Duration
Status
Additional options include:
Group By Job ID
Show Inefficient Stages
These views help identify problematic or resource-intensive jobs.
Job Stages
Expand a job to view its stage-level details.
For each stage, monitor:
Stage ID
Job ID
Task Count
Duration
Maximum Task Memory
I/O Utilization
Shuffle Read
Shuffle Write
Task Skew
Status
Failure Reason
Use stage-level metrics to identify:
Long-running stages
Data skew issues
Shuffle bottlenecks
Memory pressure
Failed execution stages
Job Timeline
The Timeline view provides a chronological representation of job execution activity.
Use the timeline to:
Visualize execution progress
Identify scheduling delays
Understand stage sequencing
Analyze parallel execution behavior
Time Series Information
The Timeseries Information section displays runtime trends for the selected Spark application.
Track metrics such as:
Driver Time
Executor Activity
Resource Utilization Trends
Use the time range selector to focus on specific execution windows.
Charts
Schedule Information
The Schedule Information panel helps analyze task scheduling behavior.
Metrics include:
Active Tasks
Current Thread Pool Activity
This view helps identify:
Scheduling delays
Resource contention
Task concurrency behavior
You can optionally display metrics for individual executors.
I/O Metrics
The I/O section provides visibility into application data movement.
Monitor:
Input Bytes Read
Output Bytes Written
Use these metrics to understand workload throughput and identify I/O bottlenecks.
Driver Memory Usage
Monitor memory utilization of the Spark driver process.
Metrics include:
Driver Total Memory
Heap Memory Usage Distribution
Use this information to:
Detect memory pressure
Prevent driver out-of-memory failures
Optimize driver sizing
Executor Memory Usage
Track memory consumption across Spark executors.
Metrics include:
Executor Total Memory
Heap Memory Usage Distribution
You can view aggregate metrics or display individual executor statistics.
Use this information to:
Identify executor memory bottlenecks
Detect inefficient memory utilization
Tune executor resource allocation
GC and CPU Distribution
Analyze JVM and CPU behavior during execution.
Metrics include:
JVM Garbage Collection Count
CPU Utilization
Use these metrics to identify:
Excessive garbage collection activity
CPU saturation
Resource inefficiencies
Executor-level views are available for deeper analysis.
Shuffle Information
The Shuffle Information section provides insights into data exchange between Spark stages.
Monitor:
Shuffle Bytes Written
Shuffle Local Bytes Read
Shuffle Remote Bytes Read
Shuffle Remote Bytes Read to Disk
Use these metrics to:
Detect expensive shuffle operations
Identify network bottlenecks
Analyze stage communication overhead
Storage Memory
Monitor Spark storage memory utilization.
Metrics include:
Block Off-Heap Memory Used
Block On-Heap Memory Used
Block Max On-Heap Memory
Block Max Off-Heap Memory
Block Disk Space Used
Use this information to evaluate caching effectiveness and memory consumption patterns.
HDFS Information
The HDFS Information section provides visibility into storage interactions.
Monitor:
HDFS Read Activity
HDFS Write Activity
Use these metrics to understand storage access patterns and identify potential storage bottlenecks.
Aggregate Metrics
The Aggregate Metrics table provides summarized execution statistics across tasks.
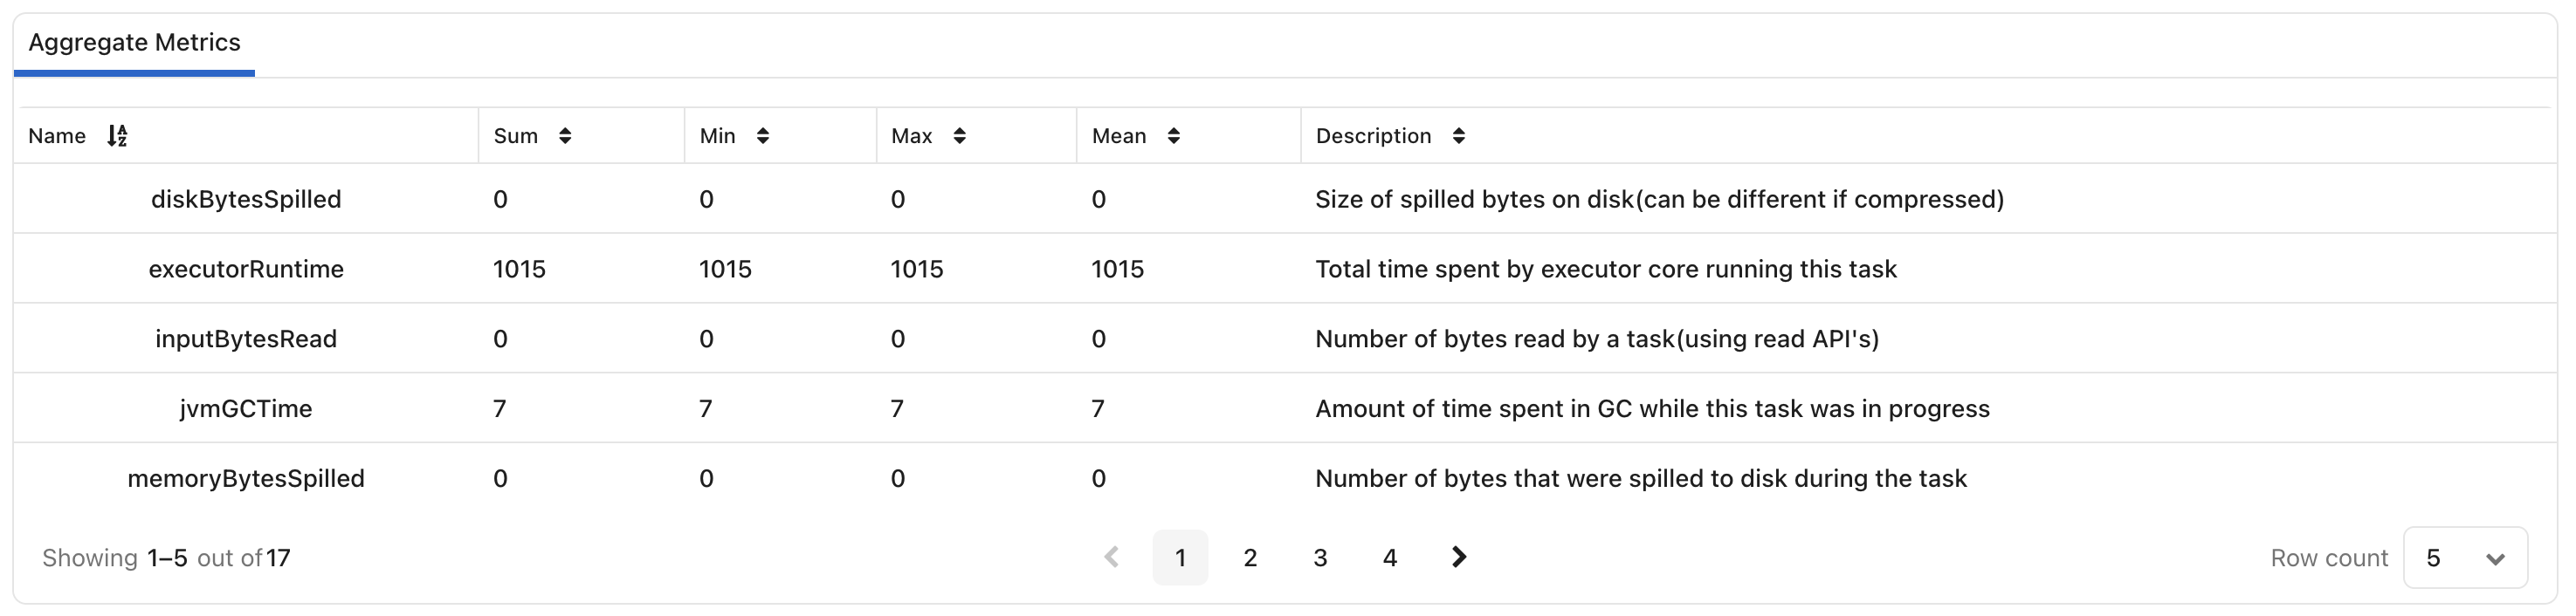
Examples include:
Executor Runtime
JVM GC Time
Input Bytes Read
Disk Bytes Spilled
Memory Bytes Spilled
For each metric, view:
Sum
Minimum
Maximum
Mean
Description
Use aggregate metrics to identify:
Resource-intensive workloads
Spill-heavy executions
GC overhead
Runtime inefficiencies
Core Usage by Locality
The Core Usage by Locality section helps evaluate compute efficiency.
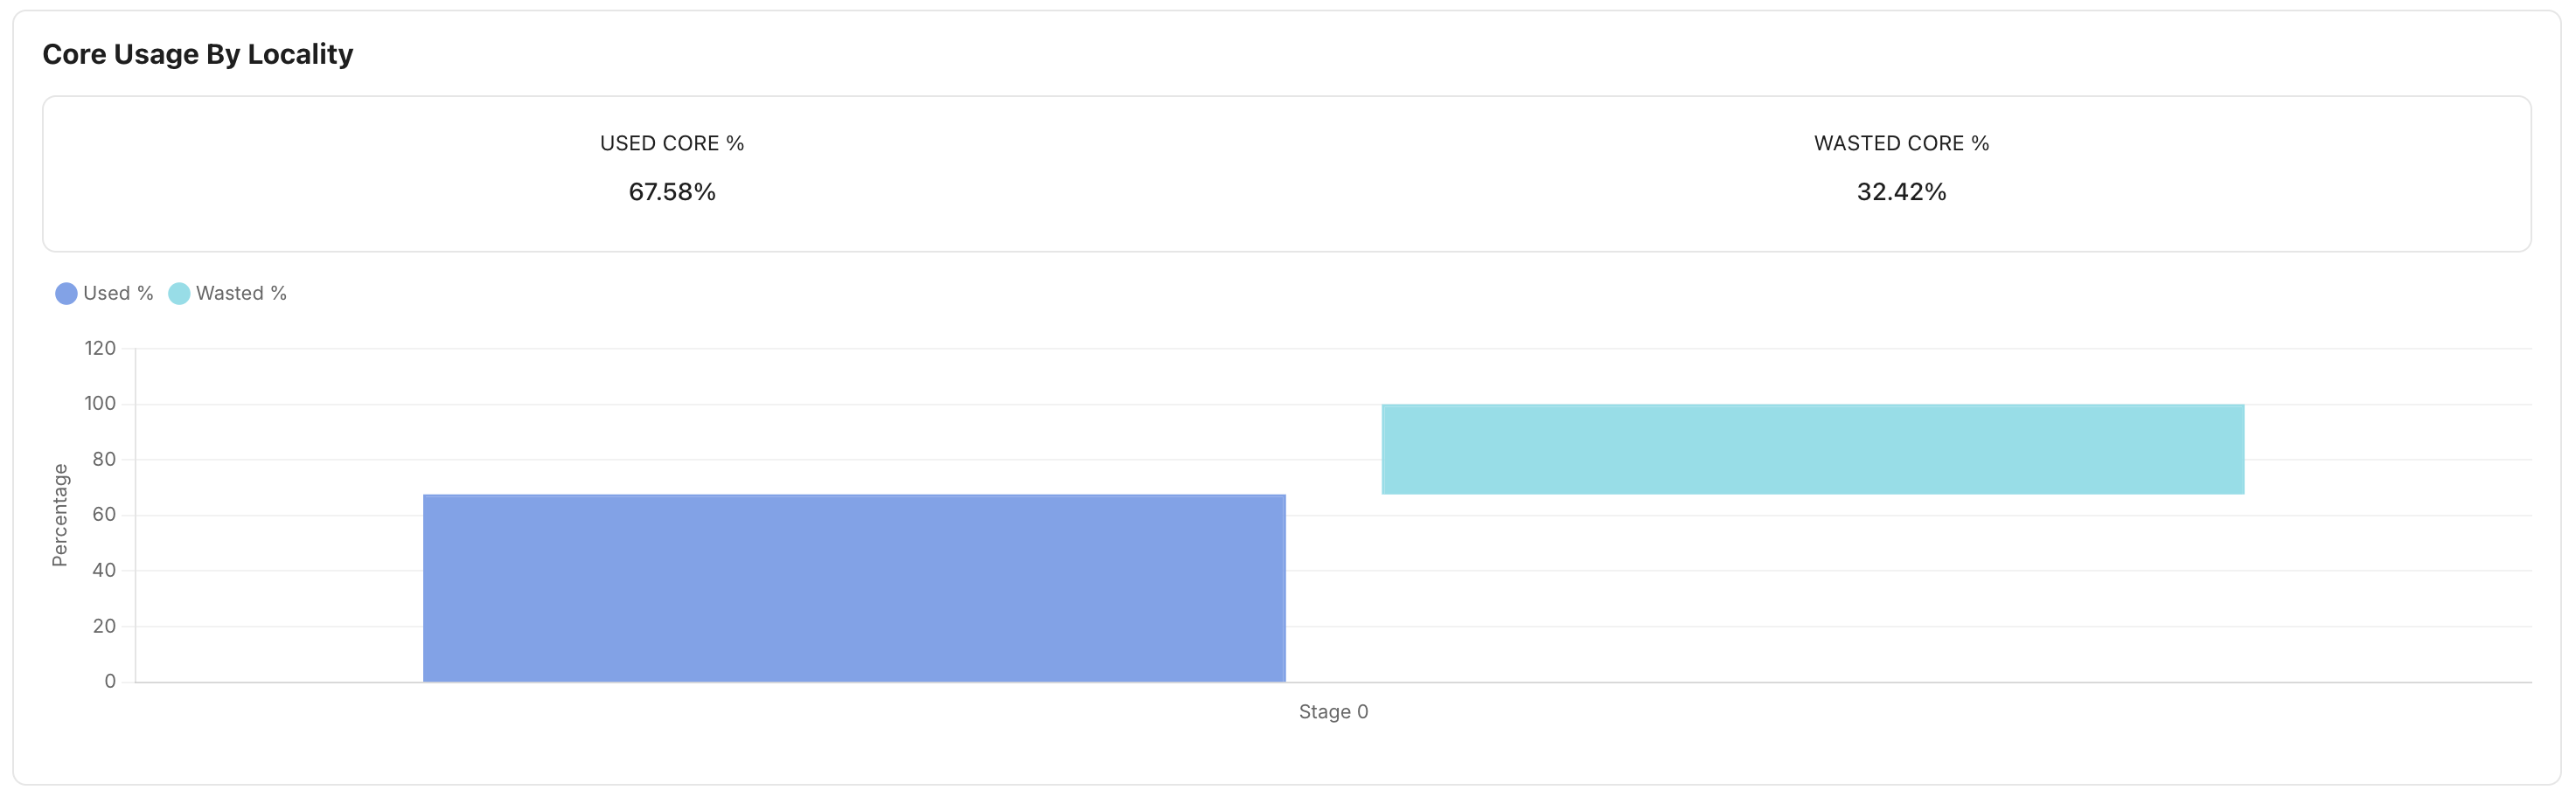
Metrics include:
Used Core Percentage
Wasted Core Percentage
Use this view to:
Identify underutilized resources
Improve executor sizing
Optimize workload placement
Reduce wasted compute capacity
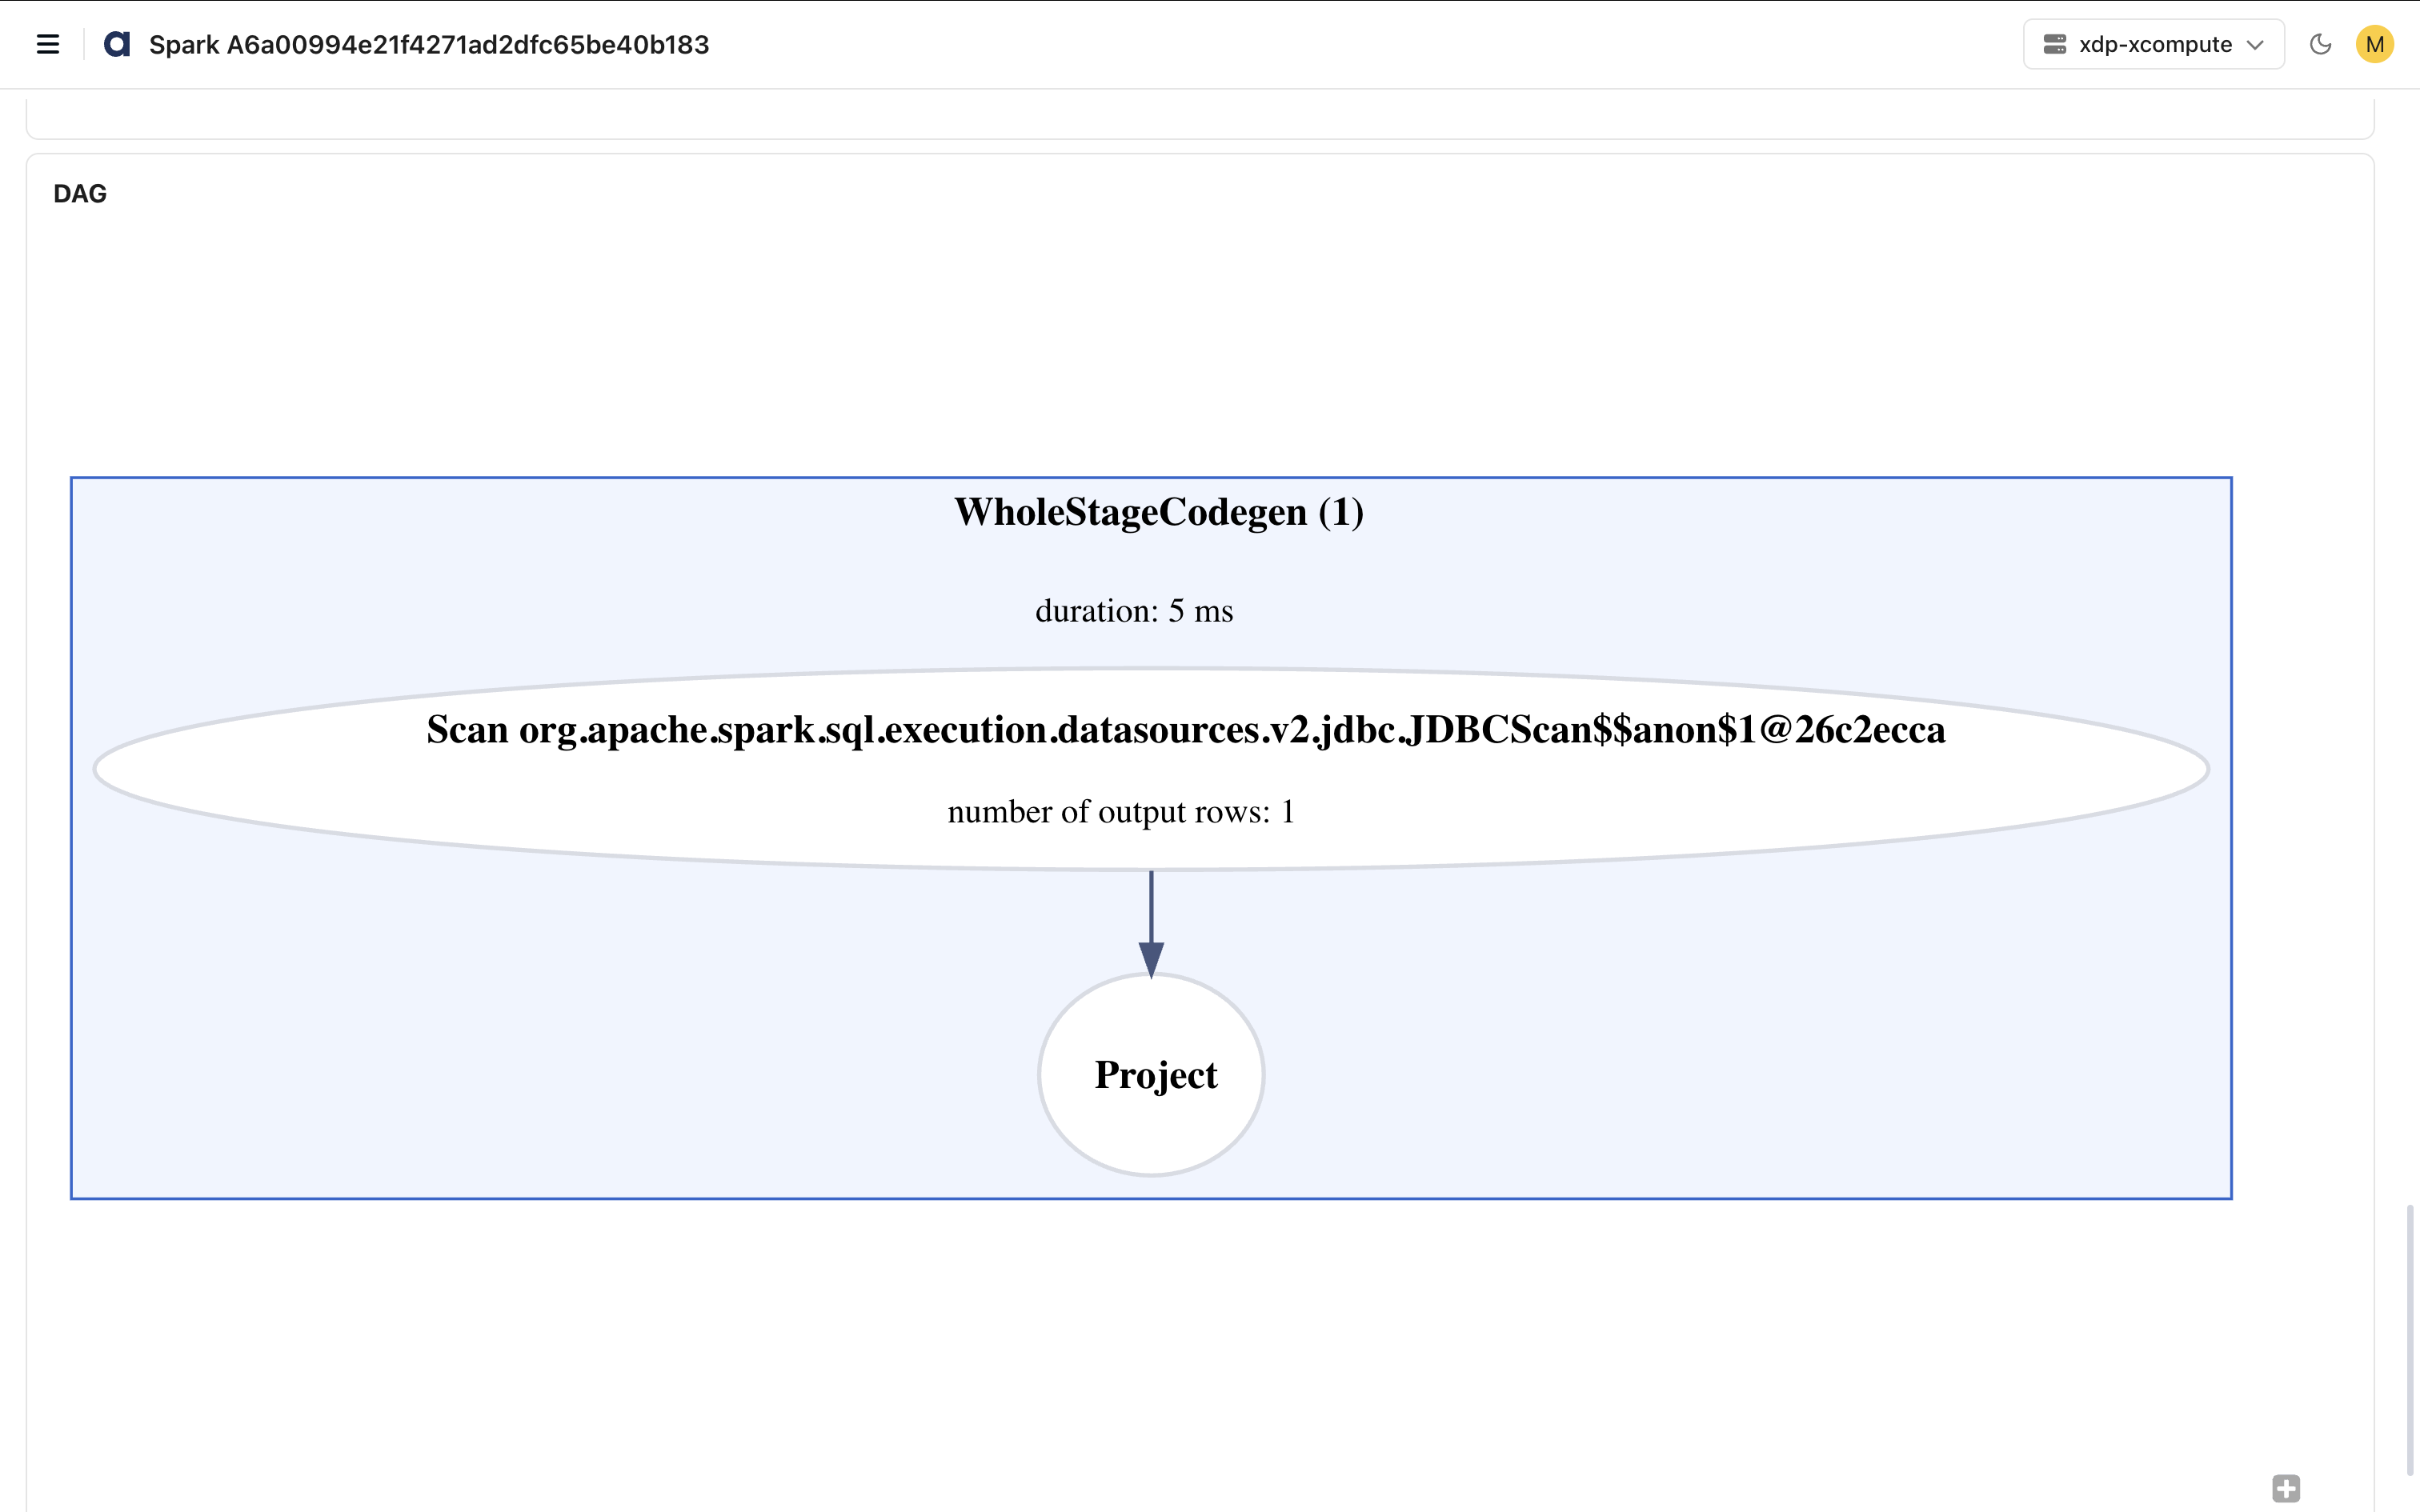
DAG Visualization
The DAG section displays the Spark execution plan as a Directed Acyclic Graph (DAG).
The DAG visualization helps you:
Understand execution flow
Analyze stage dependencies
Review transformations and actions
Identify expensive execution paths
For each node, you can view information such as:
Operation Name
Duration
Output Rows
Execution Relationships
Use the DAG view to perform detailed query and execution-plan analysis and to identify optimization opportunities.
Features
This page includes the following capabilities.
Search and filter job information where applicable.
Expand jobs to view detailed stage information.
Switch between Jobs and Timeline views.
Compare historical executions using Compare Runs.
Analyze executor-specific metrics by enabling Show Individual Executors.
Refresh the page to view the latest execution data.