The JupyterHub Dashboard provides visibility into user activity, notebook server health, resource utilization, and platform performance.
Use this dashboard to monitor active users, track notebook server status, analyze resource consumption, and identify performance bottlenecks across the JupyterHub deployment.
Navigation Steps
In the xObserve UI, select JupyterHub from the left navigation pane.
Select JupyterHub > Dashboard.
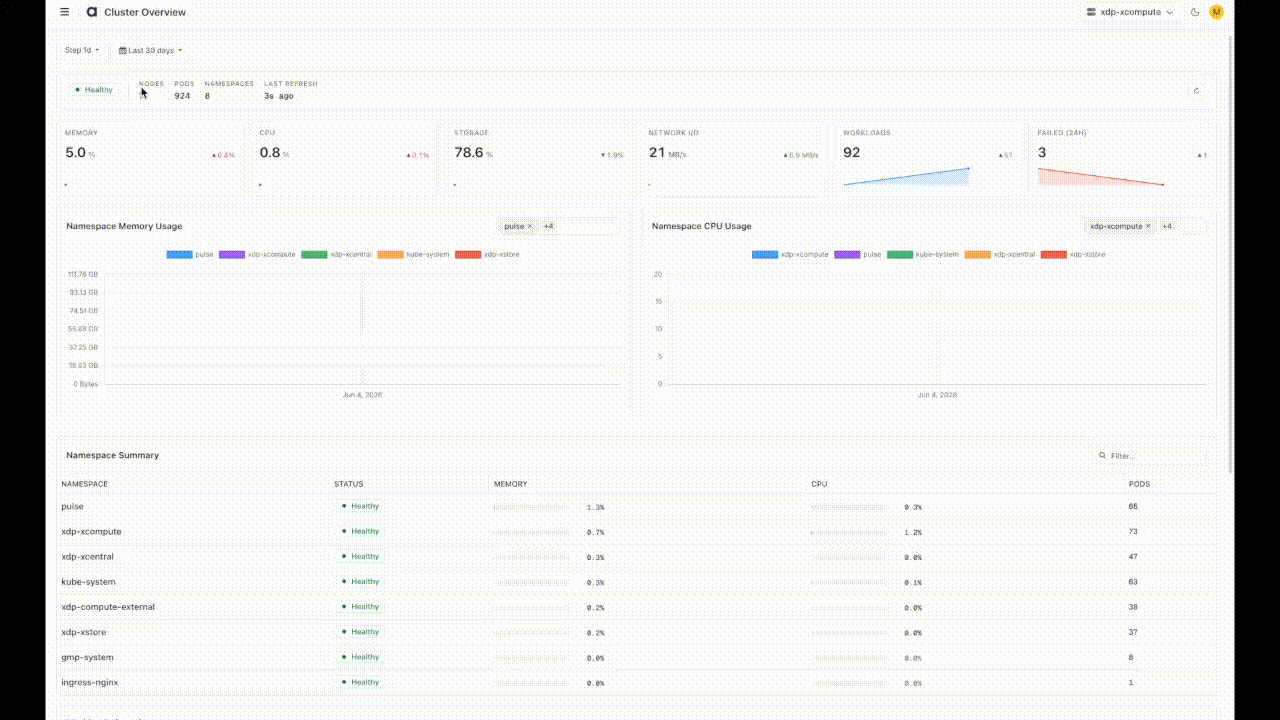
Select the desired cluster from the cluster selector in the upper-right corner.
The JupyterHub Dashboard opens and displays key metrics related to user activity, notebook server health, resource utilization, and overall JupyterHub performance.
Time Period
Use the Time Period selector in the upper-left corner of the dashboard to filter metrics and charts for a specific monitoring window.
Step Interval
This controls how often the dashboard needs to refresh.
Metrics
User Activity
Total Users – Total number of JupyterHub users.
Running Servers – Total number of active notebook servers.
Active Users – Displays active users and their notebook server activity.
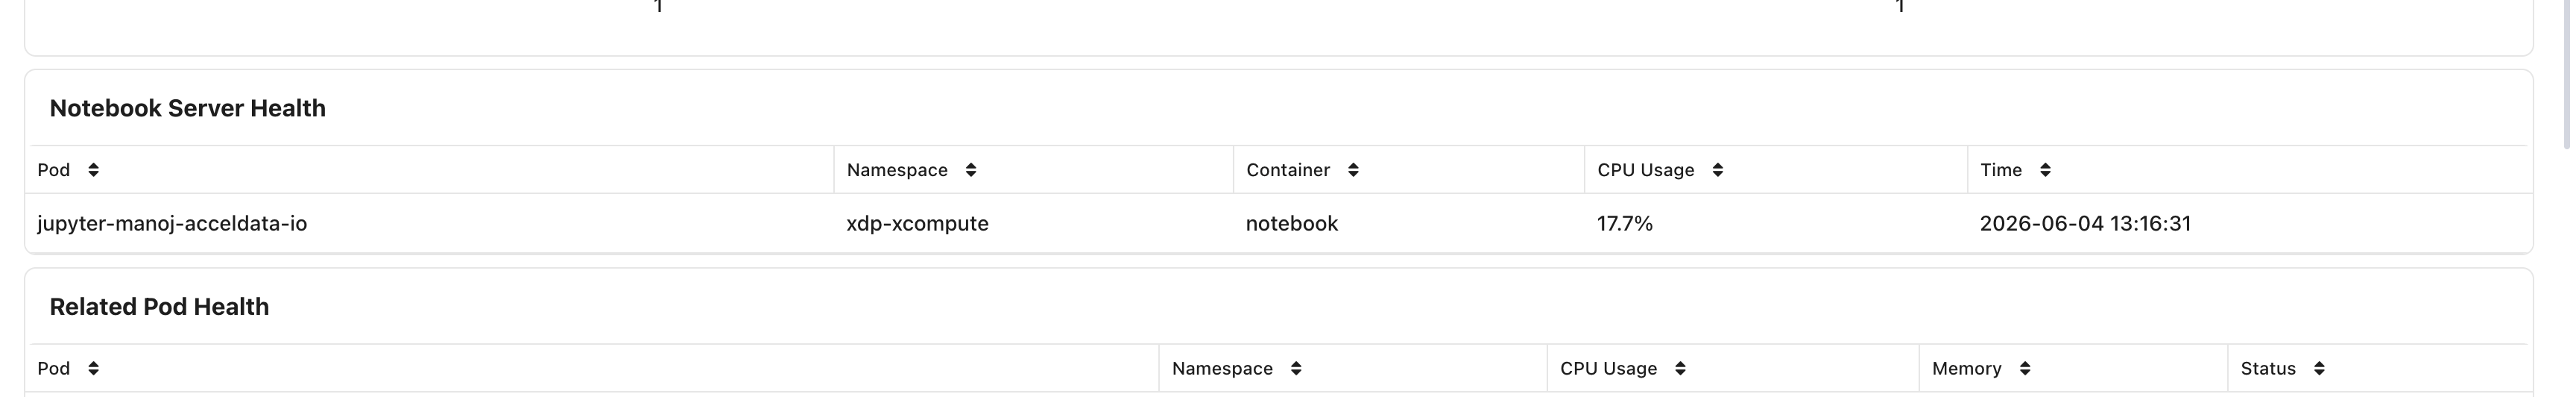
Notebook Server Health
Notebook Server Health
Displays the health status of notebook server pods, including namespace, container information, CPU usage, and uptime.
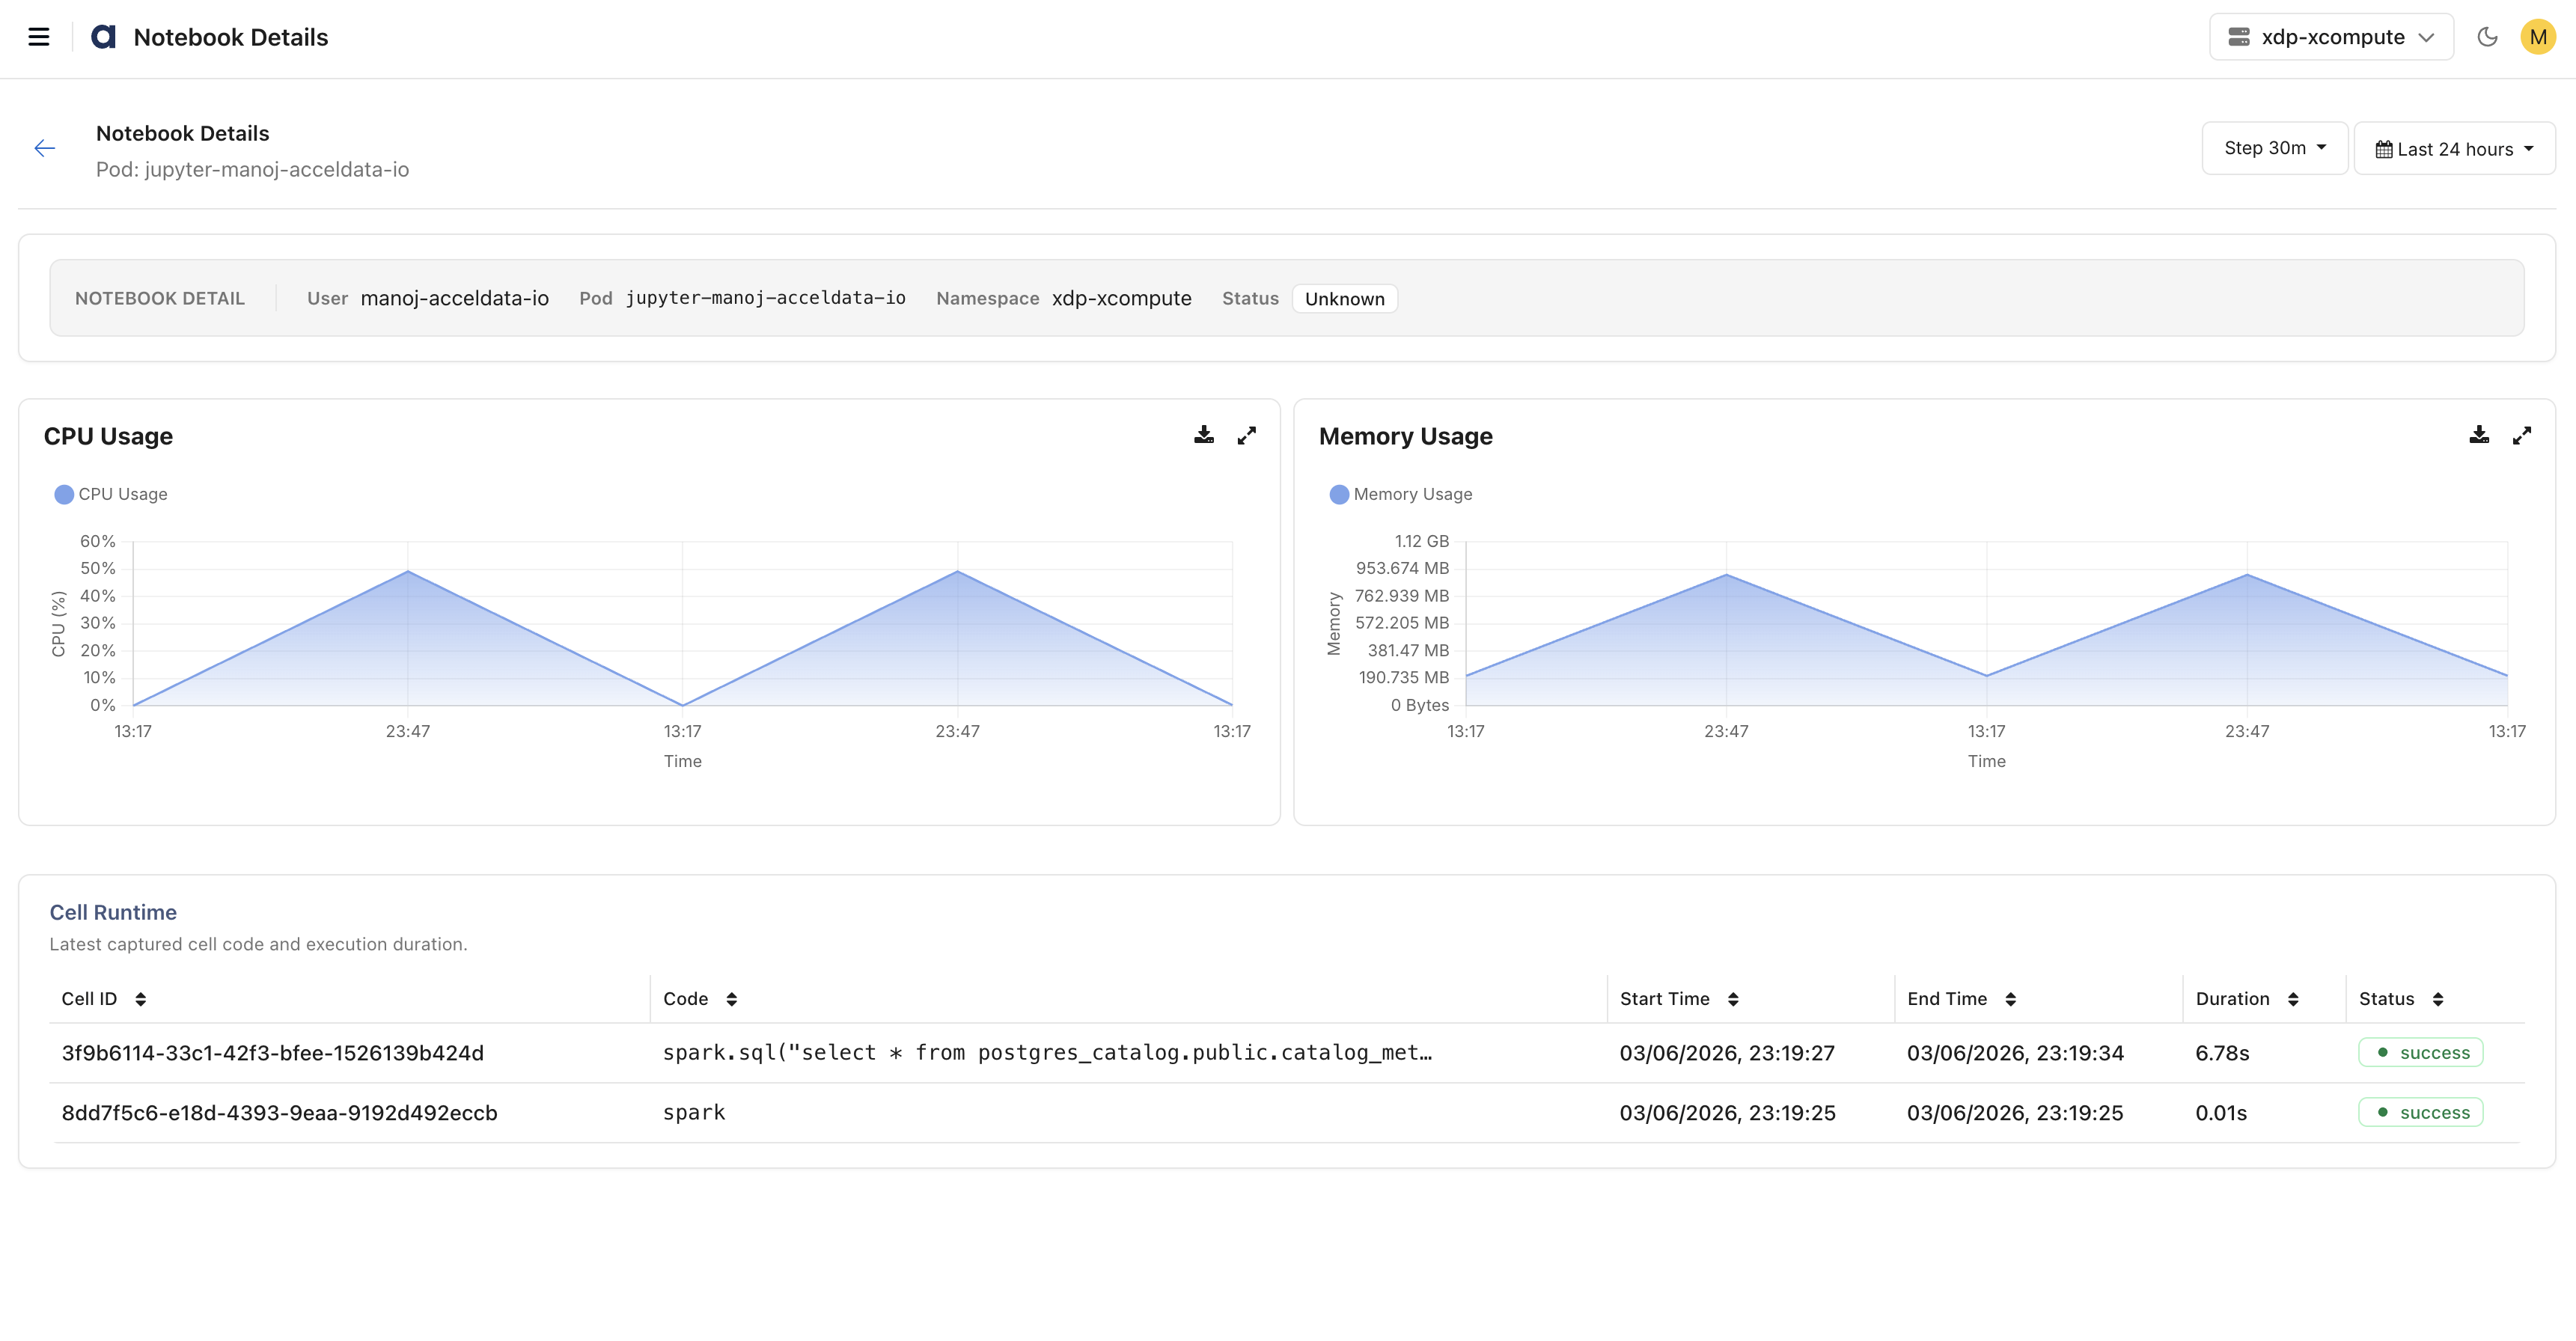
Click a notebook server to view detailed server metrics, including:
CPU Utilization – CPU consumption of the notebook server.
Memory Utilization – Memory usage of the notebook server.
Recent Cell Executions – List of recently executed notebook cells, including execution details and status.
Currently, the Notebook Server Health page displays information only for running notebook server pods. Notebook details, resource utilization metrics, and recent cell execution information are available only for active notebook server instances.
Notebook Server Pods
Notebook Details
Related Pod Health – Displays the health and status of JupyterHub-related pods, including CPU usage, memory consumption, and pod status.
Memory Utilization
Virtual Memory Size – Amount of virtual memory allocated by JupyterHub processes.
Resident Set Size – Physical memory currently used by JupyterHub processes.
CPU Utilization
CPU Time per Sec – CPU time consumed by JupyterHub processes per second.
Performance Metrics
User Server Lifecycle
Monitor notebook server provisioning and lifecycle operations.
Average Startup Duration – Tracks the time required for the JupyterHub service to initialize after startup or restart.
Average Server Spawn Duration – Measures how long users wait for notebook servers to become available after launch.
Average Server Stop Duration – Tracks the time required to stop notebook servers and release allocated resources.
Average Spawner Initialization Duration – Measures the time required to initialize and synchronize notebook server spawners.
Hub Performance
Monitor the responsiveness of the JupyterHub service.
Average HTTP Request Duration – Measures the latency of requests handled by the JupyterHub service, helping identify responsiveness issues.
Proxy and Routing Performance
Monitor communication and route synchronization between JupyterHub and the proxy service.
Average Proxy Poll Duration – Measures the time required to retrieve routing information from the proxy.
Average Proxy Add Duration – Measures how quickly new notebook server routes are added to the proxy.
Average Proxy Delete Duration – Measures how quickly routes are removed when notebook servers stop.
Average Route Check Duration – Measures the time required to validate routing information and route availability.
User Activity and Capacity
Monitor platform adoption and current workload levels.
Total Users – Total number of users registered in JupyterHub.
Active Users – Number of users actively interacting with JupyterHub during the selected time period.
Running Servers – Number of notebook servers currently running, indicating current platform load.
Resource Utilization
Monitor resource consumption by JupyterHub services.
Virtual Memory Size – Total memory allocated by JupyterHub processes, including reserved and shared memory.
Resident Set Size – Physical memory currently consumed by JupyterHub processes.
CPU Time per Sec – CPU utilization rate of JupyterHub processes, helping identify high CPU consumption and potential resource bottlenecks.
Platform Health
Monitor the operational health of notebook servers and supporting services.
Notebook Server Health – Displays the health, resource utilization, and uptime of notebook server pods.
Related Pod Health – Displays the health status, CPU usage, memory consumption, and operational state of JupyterHub-related pods and services.